International Journal of Emerging Technology and Advanced Engineering
Website: www.ijetae.com (ISSN 2250-2459, ISO 9001:2008 Certified Journal, Volume 4, Issue 3, March 2014)
1
Detection Settlements and Population Distribution Using GIS
And Remotely Sensed Data, In The Surrounding Area of
Merapi Volcano, Central Java, Indonesia
Fajar Yulianto
1, Boedi Tjahjono
2, Syaiful Anwar
31,2,3Disaster Mitigation and Land Degradation (MBK), Faculty of Agriculture, Bogor Agricultural University (IPB),
Jl. Raya Darmaga Kampus IPB Darmaga Bogor, West Java, Indonesia.
1Remote Sensing Application Center, Indonesian National Institute of Aeronautics and Space (LAPAN),
Jl. LAPAN No. 70, Pekayon, Pasar Rebo, Jakarta, Indonesia.
Abstract— The 2010 eruption of Merapi volcano has resulted in fatalities, injuries, suffering and psychological distress on the people who live in the surrounding area. Information on detailed population distribution, post of the 2010 eruption of Merapi volcano is required as a form of risk management activities and efforts for disaster prevention and minimizes loss of lives in the future. Dasymetric mapping is one method of thematic mapping which produce a region based spatial information in more detail. Landsat 8 LDCM images were used as input data in extracting information of settlement area using Index-based Built-up Index (IBI) approach. Estimation of the spatial population distribution is generated by a combination of extraction yield settlement area with population census data using Geographic Information System (GIS) technology. The results showed that the use of IBI approach describes the condition of settlement areas with an accuracy rate of 84% against the reference data. Error analysis of the population distribution is indicated by the reference data was shown by Root Mean Square Error (RMSE) with the average of 1954 people and Population Distribution Error (PDE) average of 35.88%.
Keywords— Index-based Built-up Index (IBI), population distribution, GIS and remote sensing, Merapi volcano, Central Java, Indonesia
I. INTRODUCTION
The availability of the detailed population distribution information, post of the 2010 eruption of Merapi volcano becomes an important part of disaster risk management activities, which are expected to be useful in preventing and reducing the number of fatalities. Additionally, the availability of such information may also be used to help governments and related agencies to improve evacuation planning of the impact of volcanic hazards in the future.
Demographic data in relation to the general population can be obtained in the form of statistical tables and presented spatially according to the regional administrative unit, which can be inferred as the data representation in choropleth map (Tobler et al., 1997; Demers, 1999; Liu et al., 2006; Harvey, 2008; Bajat et al., 2011).
In terms of presentation, the weakness of the use of the choropleth map is that the information generated by census bureau shows uniformity within the administrative area unit and does not reflect the actual population distribution (Mennis, 2003; Hay et al., 2005; Langford et al., 2008; Lung et al., 2013). In order to overcome the drawbacks of choropleth mapping, several studies have been developed to decrease (downscale) census data through dasymetric mapping (Tian et al., 2005; Briggs et al., 2006).
Dasymetric mapping is one method of region based thematic mapping spatial information which results in more detail, by combining the global area information such as administrative units with additional data (Liu, 2006; Khomarudin, 2010). Dasymetric mapping has the advan-tage of producing a more realistic population distribution map than that with choropleth mapping. This can be done by overlaying the boundaries of administrative units with land use data information in databases of Geographic Information System (GIS) extracted using remote sensing data (Bajat et al., 2010; Linard et al., 2013). Several methods of estimating the population distribution have been developed by using remote sensing data, as was previously done by Zha et al., 2003; Xu, 2007; Briggs et al., 2006; Khomarudin, 2010; Alahmadi et al., 2013.
International Journal of Emerging Technology and Advanced Engineering
Website: www.ijetae.com (ISSN 2250-2459, ISO 9001:2008 Certified Journal, Volume 4, Issue 3, March 2014)
2
Khomarudin (2010) has classified the settlement areas using TerraSAR-X data, where the classification of the use of radar images was done with using Speckle divergence analysis and neighborhood. The classification procedures consist of three stages: pre-processing (speckle divergence analysis), analysis of the threshold value (threshold value determination for settlement areas), and neighborhood analysis (classification of settlement areas). The distribu-tion of the populadistribu-tion in the study was carried out by combining the results of the classification of settlement areas with population census data, which was modeled based on the current activities of the day and night.
Alahmadi et al. (2013) has been using Landsat ETM data, elevation data of altitude, population census and the number of dwelling units to lower the population distribu-tion data. The distribudistribu-tion of the populadistribu-tion in the area can be estimated based on the average number of residents per dwelling unit using ISODATA conventional approach classification model to generate land use information. Furthermore, the model results are used as reference data in evaluating other models.
In this study, Landsat 8 LDCM was used as input data in extracting settlement information located in the study area. Extraction and classification of settlement areas were quickly done based on approach to Index-based Built-up Index (IBI), as was done by Xu (2007). The development of the Index-based Built-up Index (IBI) approach in the study was conducted by adding data fusion using pan-chromatic channels on the Landsat 8 LDCM. Panchro-matic data fusion was performed after the formulation of the IBI approach. Classification of settlement areas and non-settlement area were produced by the process of object segmentation. Results and classification of image were done by combining the population census data and administrative boundaries of research areas was used to implement a model of spatial distribution of population based on Geographic Information System (GIS).
The purpose of this study was (a) to identify settlement areas which are classified based on Landsat 8 LDCM data, (b) to estimate the population distribution using dasymetric mapping based on classification results of settlement areas in the study area.
II. STUDY AREA
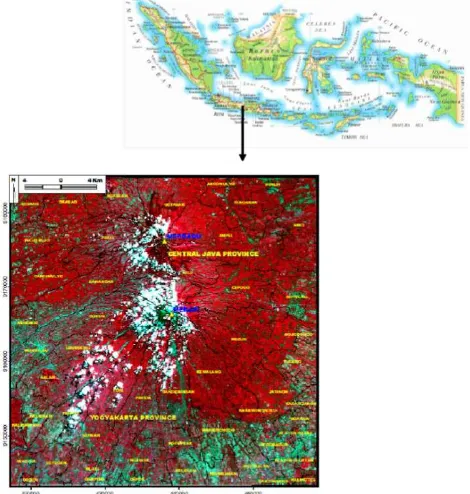
Merapi volcano is administratively located on two different provinces, namely: Central Java and Yogyakarta (Fig 1), with an altitude of 2,914 meters elevation above sea level (Yulianto and Parwati, 2012).
Merapi belongs to a group of young volcanoes on the island of Java, which is located at a subduction zone characterized by the explosive eruptions of andesitic magma (Hamilton, 1979). It is formed due to the convergence of Indo-Australian Plate causing volcanic activities along Java island, Indonesia (Lavigne et al., 2000; Yulianto et al., 2013).
Fig 1 Study area of Merapi volcano, Central Java and Yogyakarta Province (Sub-scene image of Landsat 8 LDCM acquired 24 June
2013 Path/ Row: 120/65 in the study area)
International Journal of Emerging Technology and Advanced Engineering
Website: www.ijetae.com (ISSN 2250-2459, ISO 9001:2008 Certified Journal, Volume 4, Issue 3, March 2014)
3
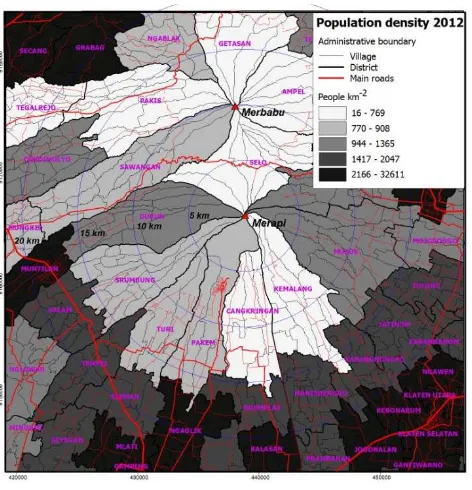
Fig 2 Population density (population per km2) of people living aroundMerapi volcano at the radius of 0 to 30 km in 2012
III. METHODOLOGY
A. Research data
Data utilisation in this study is presented Table 2. Data utilisation can be divided into spatial and non-spatial data. Spatial data consists of Landsat 8 LDCM data and topographic map. In addition, the availability of non-spatial data, such as population census data is required. The availability of data is expected to be useful in describing the number and distribution of the population, which can be used as an input to estimate the potential risk, post of the 2010 eruption of Merapi volcano in the study area.
Table 1
Number of population living at the slope of Merapi volcano within the radius of 0 to 30 km in Central Java Province and Yogyakarta (Source: BPS of Sleman, Magelang, Klaten, and Boyolali Regency,
2012)
Number of Population in 2012
Sleman Magelang Klaten Boyolali
Turi
Data utilisation and availability in the study area
Type of data Acquired period Scale /spatial
International Journal of Emerging Technology and Advanced Engineering
Website: www.ijetae.com (ISSN 2250-2459, ISO 9001:2008 Certified Journal, Volume 4, Issue 3, March 2014)
4
B. Processing and analysis of remote sensing data
Initial data analysis (pre-processing) in the study was done by converting the Digital Numbers (DNs) to the reflectance values (Top of Atmosphere (TOA)). Standard products from Landsat 8 LDCM (Landsat Data Continuity Mission) which can be obtained from the USGS EROS Center and used in this study is available in the format of 16-bit unsigned integer. The process is required to rescale DNs values in the image into reflectance values or radian using radiometric coefficients available in the metadata file (MTL file). In general, the process of converting the DNs values into reflectance values consists of two stages: the first stage is to convert the DNs to radian values and the second stage is to convert the radian to reflectance values. The formula in converting the DNs values into radian values can be expressed in Eq. (1) and the formula to convert radian values to reflectance values can be expressed in Eq. (2) (Chavez, 1988; 1996; USGS, 2013a; USGS, 2013b).
Lλ = ML * Qcal + AL (1)
Lλ is spectral radiant TOA. ML is the specification of a band or channel, and the multiplicative rescaling factor obtained from the metadata. AL is specification of bands or channels, and additive rescaling factor can be obtained from the metadata. Qcal is standard pixel value products that have been quantized and calibrated in the form of the Digital Number (DNs).
ρλ' = Mρ * Qcal + Aρ (2)
ρλ' is TOA reflectance without solar angle correction. Mρ is the specification of a band or channel, and the multiplica-tive rescaling factor can be obtained from the metadata. Aρ is the specification of bands or channels, and additive rescaling factor can be obtained from the metadata. Qcal is the pixel value of the product standards that have been quantized and calibrated in the form of the Digital Number (DNs).
C. Settlements classifications
Classification of settlement areas in the study was conducted using Index-based Built-up Index (IBI) approach through Landsat 8 LDCM satellite images. IBI is one approach that can be used to perform rapid classification of settlement areas, which have been developed by Xu (2007). This approach is indicative of an approach to the development of Normalized Difference Built-up Index (NDBI) which has been done by Zha et al. (2003).
IBI approach is made using a combination of three thematic layers, namely: NDBI, Soil Adjusted Vegetation Index (SAVI) and Modified Normalized Difference Water Index (MNDWI). The results of the use of formulations IBI approach, settlement areas will appear and have a higher value when compared with other land uses. Formula of the approach can be presented in Eq. (3) to (6) (Zha et al., 2003; Xu, 2007; Khomarudin, 2010).
= (( )) (3)
=(( )( )) (4)
= (( )) (5)
= [ ( !"#$%&!)' ]
[ ( !"#$%&!)' ] (6)
Where: MIR is mid-infrared bands on Landsat data. NIR is near-infrared bands on Landsat data. Red is a red band on Landsat data. Green is a green band on Landsat data. l is dependent weight with vegetation cover and soil moisture, varied between 0 and 1 (default l of these factors, the value of 0.5 can be used for the entire image).
International Journal of Emerging Technology and Advanced Engineering
Website: www.ijetae.com (ISSN 2250-2459, ISO 9001:2008 Certified Journal, Volume 4, Issue 3, March 2014)
5
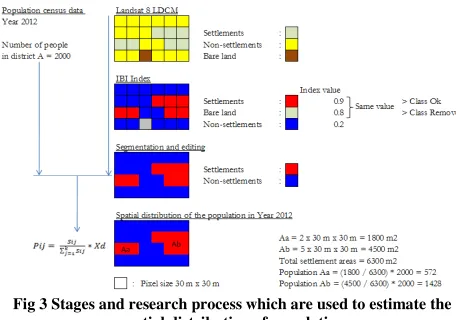
D. Spatial estimation of population distribution
In this study, the results of classification and segmentation on settlement areas using Index-based Built-up index (IBI) at Landsat 8 LDCM images were used as input to estimate the spatial distribution of the population. In addition, the use of census data in the year 2012 the population of the Central Statistics Agency (BPS) and the administrative boundaries of the area of Geospatial Information Agency (BIG) at 1:25,000 scale were also required in this study. The utilization of input data classification and segmentation of settlement areas on the IBI approach at Landsat 8 LDCM images in 2013, along with the population census in 2012 and regional administrative borders can describe the conditions, post of the 2010 eruption of Merapi volcano in the study area.
Estimation of the spatial distribution of the population is based on the formula that has been developed previously by Khomarudin et al. (2010). The estimation formulas are presented in Eq. (7) to (9).
)* = + ,-./ (7)
,- = + ,-01
2/ (8)
,-0 = +43.23.2
567 ∗ )* (9)
Where: Xd is the number of people in the administrative unit. Pi is the number of people in the area of settlement land use i. Pij is the number of people in settlement polygon j within the area of settlement land use i. Sij is the size of the settlement polygon j in the settlement area of land use i. n is the number of polygons in the area of settlement land use administrative units.
Fig 3 Stages and research process which are used to estimate the spatial distribution of population
The process and stages of research used in estimating the spatial distribution of the population in the study area are presented in Fig 3.
These results certainly have the potential errors. Calculation of the error analysis can be performed by determining the Root Mean Square Error (RMSE) and the Population Distribution Error (PDE). Comparison between the results of the estimation of spatial food distribution and population reference data is necessary to determine the magnitude of RMSE and PDE. In this study, the reference data being used is village potential (PODES) data in 2012 available in each district. The availability of PODES data in each district is not homogenous (PODES data were only available in certain areas within in the study area). The assumption of the use of PODES data is that population contained in one area of the village population is considered truly live in the area. A formula in determining the RMSE and PDE are presented in Eq. (10) to (11) (Khomarudin, 2010).
9 : = ;+./ (<.2 <.2 =)' (10)
, : (%) = | <.2 <.2 = |<.2 = @ 100% (11)
Where: RMSE is root mean square error. PDE is population distribution error. Pij is number of people within the settlement area polygon (distribution model). PijRQ is the number of people within the settlement area polygon (reference). n is the number of sample used in calculation.
IV. RESULTS AND DISCUSSION
Results and discussion of this study can be divided into two parts of analysis. Section A presents results related to the classification and segmentation approach settlement areas using Index-based Built-up Index (IBI) at Landsat 8 LDCM satellite images. Section B presents results of the spatial distribution of population estimation and error calculation analysis.
A. Classification of settlement and non-settlement area
International Journal of Emerging Technology and Advanced Engineering
Website: www.ijetae.com (ISSN 2250-2459, ISO 9001:2008 Certified Journal, Volume 4, Issue 3, March 2014)
6
In a short period of time, settlement area of information can be extracted using index-based to Built-up Index (IBI) approach on Landsat 8 LDCM data. Its use produce relatively fast result in distinguishing settlement and non-settlement objects, when compared with manually digitized approach (onscreen digitations), although some classification errors were found as noted previously by Xu (2007). The results of calculation of Index-based approaches Built-up Index (IBI) at Landsat 8 LDCM satellite imagery in the study area can be seen in Fig 5. Meanwhile, the results of the classification of non-settlement and settlement in the study location are presented in Fig 6.
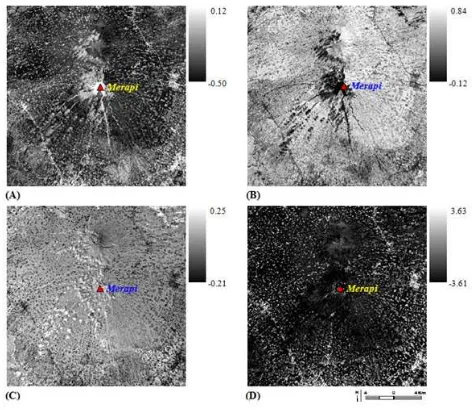
Fig 5 Calculation results of Index-based Built-up Index (IBI) approach on Landsat 8 LDCM in study area. IBI approach is calculated using a combination of three thematic layers, namely: NDBI, SAVI and MNDWI. (A) Normalized Difference Built-up Index
(NDBI). (B) Soil Adjusted Vegetation Index (SAVI). (C) Modified Normalized Difference Water Index (MNDWI). (D) index-based
built-up index (IBI).
In Fig 5a, based on the calculation of NDBI index, the settlement object looks bright (white) tends to be positive (0.12), while non-settlement objects look dark (black) tend to be negative (-0.50). The weakness of the use of the index is that the NDBI shows pyroclastic material objects and clouds that have similar color with the settlement object. In
Fig 5b, the results of the use of the SAVI index are similar to NDWI index calculation, which is pyroclastic material objects and clouds have the same color as the settlement objects. However, the use of this index is indicated with the reversed color of that of NDBI index, namely: the settlement object appears to be negative (-0.12) and light-colored (white), while non-settlement objects appears to be positive (0.84) and dark-colored (black).
In Fig 5c, the results of the use of the index MNDWI can minimize the appearance of pyroclastic material object, but the appearance of white cloud is still visible. The use of IBI method based on Fig 5d, which is an amalgamation of NDBI index, SAVI and MNDWI, can be used and has the ability to classify objects with minimal errors in differentia-ting settlement and non-settlement. Shown in Fig 5d appearance of pyroclastic material objects and clouds tend to be eliminated. Settlement objects can be demonstrated with bright color (white) which tends to be positive (3.63), while non-settlement objects can be shown with a dark color (black) that tend to be negative (-3.61).
The calculation results IBI in Fig 5 is clearly visible can distinguish settlement objects and non-settlement. This suggests that in order to update the data of land use (settlement) use IBI method can be applied quickly. Data conversion from raster format to vector format of IBI calculation results can be done with the object segmenta-tion which can distinguish directly between settlement and non-settlement object by identifying the spatial structure of the image data from IBI result calculation. Furthermore, the editing process to some misclassification can be done based on the results of vector segmentation, to reduce the error to the presence of speckle noise.
Accuracy calculations performed in this study utilized cross folder confusion matrix. The purpose of these calculations is to demonstrate the accuracy of the use of IBI index method for classifying non-settlement areas and settlement area against reference data (topographic map, updated in 2009). The choice of location accuracy calcula-tions was performed at 4 different locacalcula-tions (Fig 6), namely: a) the settlement site located in rural areas, b) settlement area are located in urban areas, c) settlement site located between paddy field and mixed plantation, and d) the settlement site located in the mountainous slopes of Merapi volcano. Assumption on selected location is that the area that is relatively unchanged in terms of the distribution of the settlement. This is done because the data used for the calculation of the reference acquisition time and accuracy possess different acquisition time and different year, with the source of data used in the calculation of the index IBI. The results of calculation of the level of accuracy can be presented in Table 3 to 7.
International Journal of Emerging Technology and Advanced Engineering
Website: www.ijetae.com (ISSN 2250-2459, ISO 9001:2008 Certified Journal, Volume 4, Issue 3, March 2014)
7
The average accuracy in location A is calculated as the sum of digits of accuracy in the column and divided by the number of classes from the classification being made. The value is 83%. While the average reliability in location A is calculated based on the total number of reliability in a row and divided by the number of classes from the classification being made, with the value of 84%.
Fig 6 Results classification process on the land use for settlement and non-settlement in the study area. (1) The results of Index-based Built-up Index (IBI) approach on Landsat 8 LDCM images. (2) Addition of
the panchromatic image data fusion on images created based on IBI calculation approach. (3) The object segmentation process in classifying settlement areas. (4) The results of the classification and
editing area settlement and non-settlement. (A) Location of settlements are located in rural areas. (B) The location of settlements
are located in urban areas. (C) Location of settlements located between paddy field and mixed plantations. (D) Location of
settlements located in the slope of Merapi volcano.
These results are used to calculate the magnitude of the overall accuracy as the sum of the average accuracy and average reliability which is then divided by the number of classification results. Table 7 shows that at location A, an overall accuracy of 83.50% was obtained. While on location B, C and D overall accuracy obtained were 85.50%, 82.50%, and 84.50%, respectively.
Overall, the average calculation results show that the use of IBI method is able to describe the land use classification class, settlement and non-settlement based on topographic maps reference of 84.00%.
Table 3
Calculation of accuracy, reliability using cross map confusion matrix IBI map and reference map at location A
Confussion matrix
Model map
Accuracy Non-Settlements Settlements
Source Map
Non-Settlements 9213.40 422.73 0.96
Settlements 518.05 1182.34 0.70
Reliability 0.95 0.74
Table 4
Calculation of accuracy, reliability using cross map confusion matrix IBI map and reference map at location B
Confussion matrix
Model map
Accuracy Non-Settlements Settlements
Source Map
Non-Settlements 9287.45 418.33 0.96
Settlements 425.63 1214.67 0.74
Reliability 0.96 0.74
Table 5
Calculation of accuracy, reliability using cross map confusion matrix IBI map and reference map at location C
Confussion matrix
Model map
Accuracy Non-Settlements Settlements
Source Map
Non-Settlements 7342.10 450.06 0.94
Settlements 1224.58 2329.36 0.66
Reliability 0.86 0.84
Table 6
Calculation of accuracy, reliability using cross map confusion matrix IBI map and reference map at location D
Confussion matrix
Model map
Accuracy Non-Settlements Settlements
Source Map
Non-Settlements 6925.50 517.16 0.93
Settlements 1050.70 2832.24 0.73
International Journal of Emerging Technology and Advanced Engineering
Website: www.ijetae.com (ISSN 2250-2459, ISO 9001:2008 Certified Journal, Volume 4, Issue 3, March 2014)
8
Table 7Calculation of accuracy, reliability using cross map confusion matrix IBI map and reference map at the study area
Calculation (in %)
Sample Location Average
total
(in %)
A B C D
Average accuracy 83.00 85.00 80.00 83.00 82.75
Average reliability 84.00 85.00 85.00 86.00 85.00
Overall accuracy 83.50 85.50 82.50 84.50 84.00
B. Estimated spatial distribution of population and error
calculation analysis
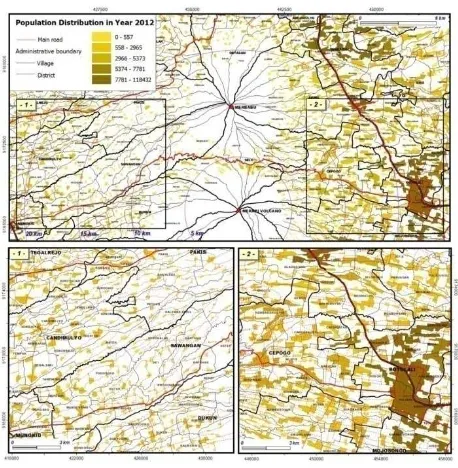
The results of the classification of settlement areas from the calculation of the index approach IBI at Landsat 8 LDCM images are used as input to estimate the spatial distribution of the population in the study area. In addition, the use of population census data in 2012 obtained from the Central Statistics Agency (BPS) is also required in this study. These data can describe the conditions, post of the 2010 eruption of Merapi volcano in the study area. Estima-tion is done by calculating the area of settlement in study area per administration unit (in this case the sub-district administrative units). According to Khomarudin et al. (2010), the total population can be distributed evenly and proportionally based on the extent of settlement areas contained in each sub-district. The results of the estimation of the distribution of the population in the study area are presented in Fig 7a and 7b. In Fig 7a shows a map of population distribution on the southern slope of Merapi volcano, while Fig 7b shows the distribution of the population on the northern slopes of Merapi volcano. Estimated distribution of the population in the study area has some potential errors and the results of these calculations are shown in Table 8.
Error analysis of population distribution in this study was calculated based on the value of the Root Mean Square Error (RMSE) and Population Distribution Error (PDE). Reference data is the data used village potential (PODES) in 2012 obtained from each district. The assumption of the use of the PODES data is that the village population is the smallest unit which perceived as the real population in the area. A total of 125 villages were used in this study as reference data which are scattered and are available in 13 districts. The results of the average RMSE obtained was 1954 people with a minimum of error of 583 people (in the District Pakis, Magelang) and a maximum error of is 4208 people (in the District Turi, Sleman). Based on the calculation of the average PDE, the observed error is 35.88% of the minimum error of 25.92% and the maximum error of 58.9%.
Fig 7a Estimated population distribution map 2012 in the southern part of Merapi volcano
International Journal of Emerging Technology and Advanced Engineering
Website: www.ijetae.com (ISSN 2250-2459, ISO 9001:2008 Certified Journal, Volume 4, Issue 3, March 2014)
9
Table 8Results of population distribution error analysis using Root Mean Square Error (RMSE) and Population Distribution Error (PDE)
No District Regency Number of village
RMSE (people)
PDE (%)
1 Cepogo Boyolali 14 1271 28.86
2 Selo Boyolali 9 1062 35.81
3 Karangnongko Klaten 4 1955 54.22
4 Kemalang Klaten 5 1494 46.48
5 Dukun Magelang 14 888 25.92
6 Pakis Magelang 19 583 16.13
7 Salam Magelang 11 1335 28.50
8 Sawangan Magelang 15 1513 31.88
9 Srumbung Magelang 17 987 28.17
10 Cangkringan Sleman 5 2467 39.22
11 Pakem Sleman 5 3476 40.29
12 Tempel Sleman 3 4170 58.09
13 Turi Sleman 4 4208 32.91
Total 125 - -
Average error - 1954 35.88
V. CONCLUSION
This study has shown that the detailed information on population distribution in the study area can be derived by applying the dasymetric mapping method. Location of settlement areas as the primary basis in mapping the distribution of rapid population can be extracted by using remote sensing data, the Landsat 8 LDCM with Index-based to Built-up Index (IBI) approach. Dasymetric mapping of population distribution can be develop to map the potential risk, post of the 2010 eruption of Merapi volcano in the study area The results of this study provides contribution at the level of mapping scale between 1:25,000 to 1:50,000.
The same method can be recommended for future studies with a contribution rate of more detailed mapping scales (< 1:25,000), using other remote sensing data such as: Worldview-2, Quickbird, SPOT 4, SPOT 5 etc.
Acknowledgments
This article derives from research in progress by F. Yulianto on “The potential risk of pyroclastic flows after the events of the 2010 eruption of Merapi Volcano using remotely sensed data in Central Java, Indonesia”. This project is being done at the Disaster Mitigation and Land Degradation (MBK), Faculty of Agriculture, Bogor Agri-cultural University (IPB), Bogor, West Java, Indonesia. Supported by Indonesian National Institute of Aeronautics and Space (LAPAN). Landsat 8 LDCM data were provided by the U. S. Geological Survey (USGS). Topographic maps were provided by the Geospatial Information Agency (BIG). The authors express their gratitude to the reviewers for their helpful advice.
R
EFERENCES[1] Alahmadi, M., Atkinson, P., Martin, D. 2013. Estimating the spatial distribution of the population of Riyadh, Saudi Arabia using remotely sensed built land cover and height data. Journal of Computers, Environment and Urban Systems, 41:167-176.
[2] Bajat, B., Hengl, T., Kilibarda, M., Krunić, N. 2011. Mapping population change index in Southern Serbia (1961–2027) as a function of environmental factors. Journal of Computers, Environment and Urban Systems, 35(1):35–44.
[3] Briggs, D. J., Gulliver, J., Fecht, D., Vienneau, D. M. 2006. Dasymetric modelling of small-area population distribution using land cover and light emissions data. Journal of Remote Sensing of Environment, 108:451–466.
[4] Chavez, P. S. Jr. 1988. An improved dark-object subtraction technique for atmospheric scattering correction of multispectral data. Remote Sensing of Environment, 24:459-479.
[5] Chavez, P. S. Jr. 1996. Image-based atmospheric corrections - revisited and improved. Photogrammetric Engineering and Remote Sensing, 62(9):1025-1036.
[6] Demers, M. N. 1999. Fundamentals of geographic information systems (2nd Ed.). New York: John Wiley.
[7] Gallego, F. J., Batista, F., Rocha, C., Mubareka, S. 2011. Disaggregating population density of the European Union with CORINE land cover. International Journal of Geographic Information Science, 25(12):2051-2069.
[8] Hamilto, W. 1989. Convergent-plate tectonics viewed from the Indonesian Region. Majalah IAGI.
[9] Harvey, F. 2008. A primer of GIS: Fundamental geographic and cartographic concepts. New York: The Guilford Press.
[10] Hay, S. I., Noor, A. M., Nelson, A., Tatem, A. J. 2005. The accuracy of human population maps for public health application. Tropical Medicine & International Health, 10(10):1073-1086.
International Journal of Emerging Technology and Advanced Engineering
Website: www.ijetae.com (ISSN 2250-2459, ISO 9001:2008 Certified Journal, Volume 4, Issue 3, March 2014)
10
[12] Khomarudin, M. R., Strunz, G., Ludwig, R., ZoBeder, K., Post, J.,Kongko, W., Pranowo, W. S. 2010. Hazard analysis and estimation of people exposure as contribution to tsunami risk assessment in the West Coast of Sumatera, the South Coast of Java and Bali. Zeitschrift fur Geomorphologie, 54(3):337-356.
[13] Langford, M., Higgs, G., Radcliffe, J., White, S. 2008. Urban population distribution models and service accessibility estimation. Computers, Environment and Urban Systems, 32(1):66-80.
[14] Lavigne, F., Thouret, J. C., Voight, B., Suwa, H., Sumaryono, A. 2000. Lahars at Merapi volcano, Central Java: an overview. Journal of volcanology and geothermal research. 100(1-4):423-456.
[15] Linard, C., Andrew, J., Tatem, A. J., Gilbert, M. 2013. Modelling spatial patterns of urban growth in Africa. Journal of Applied Geography, 44:23-32.
[16] Liu, X., Clarke, K., Herold, M. 2006. Population density and image texture: a comparison study. Journal of Photogrammetric Engineering and Remote Sensing, 72:187-196.
[17] Lung, T., Lübker, T., Ngochoch, J. K., Schaab, G. 2013. Human population distribution modelling at regional level using very high resolution satellite imagery. Applied Geography, 41:36-45.
[18] Mennis, J. 2003. Generating surface models of population using dasymetric mapping. Professional Geographer, 55(1):31-42.
[19] Pulvirenti, L., Pierdicca, N., Chini, M., Guerriero, L. 2011. An algorithm for operational flood mapping from Synthetic Aperture Radar (SAR) data based on the fuzzy logic. Journal of Natural Hazard and Earth System Sciences, 11:529-540.
[20] The Indonesian of Central Agency Statistics (BPS). 2012. Statistic of Sleman regency.
[21] The Indonesian of Central Agency Statistics (BPS). 2012. Statistic of Magelang regency.
[22] The Indonesian of Central Agency Statistics (BPS). 2012. Statistic of Klaten regency.
[23] The Indonesian of Central Agency Statistics (BPS). 2012. Statistic of Boyolali regency.
[24] Tian, Y., Yue, T., Zhu, L., Clinton, N. 2005. Modeling population density using land cover data. Journal of Ecological Modelling, 189:72–88.
[25] Tobler, W. R. 1979. Smooth pycnophylactic interpolation for geographical regions. Journal of the American Statistical Association, 74:519–530.
[26] USGS. 2013a. Landsat missions: frequently asked questions about the Landsat missions U. S. Geological Survey. Last modified: 5/30/123. Cited at: http://landsat.usgs.gov/band_designations _landsat_ sate llites.php.
[27] USGS. 2013b. Using the U. S. Geological Survey Landsat 8 product. Cited at: http://landsat7.usgs.gov/Landsat8_Using_Product.php
[28] Xu, H. 2007. A New Index for Delineating Built-up Land Features in Satellite Imagery. International Journal of Remote Sensing, 29(14):4269-4276.
[29] Yulianto, F., and Parwati. 2012. Aplikasi model probabilistik untuk simulasi aliran material erupsi studi kasus: Gunung Merapi, Jawa Tengah. Journal Penginderaan Jauh dan Pengolahan Data Citra Digital, 9:1-11. (In Indonesia)
[30] Yulianto, F., Sofan, P., Khomarudin, M. R., Haidar, M. 2013. Extracting the damaging effects of the 2010 eruption of Merapi volcano in Central Java, Indonesia. Natural Hazards, 66(2):229-247.