T
HE
A
PPLICATION OF
GIS
AND
R
EMOTE
S
ENSING
FOR
D
ETERMINING
S
ENSITIVE
A
REA
B
ASED
O
N
G
EOLOGICAL
H
AZARD
P
ERSPECTIVES
EFO HADI
GRADUATE SCHOOL
STATEMENT
I, Efo Hadi, here by stated that this thesis entitled:
The Application of GIS and Remote Sensing
for Determining Sensitive Area
Based on Geological Hazard Perspectives
Are result of my own work during the period of January to August 2006 and that
it has not been published before. The content of the thesis has been examined by
the advising committee and external examiner.
Bogor, August 2006
ABSTRACT
EFO HADI (2006). The Application of GIS and Remote Sensing for Determining Sensitive Area Based On Geological Hazard Perspectives. Under the supervision of KUDANG BORO SEMINAR and IWAN SETIAWAN
Geological hazards is hazard which is usually classified as geological: earthquakes, faulting, tsunamis, volcanoes, avalanches, landslides, and floods. It is a well known fact that geological hazard disaster strikes countries, causes enormous destruction and creates human sufferings and produces negative impacts on national economies. Due to diverse geo-climatic conditions prevalent in different parts of the globe, different types of geological hazard disaster strikes according to vulnerability of the area. Worldwide growth of population and particularly concentration of man and his works into urban areas, has heightened such treats to level where large-scale, and often costly, planning to reduce the hazard has become essential in many country.
By using GIS and Remote sensing technology to determine sensitive area based on geological hazard persepectives, constitute the new point of view in performing hte research. Remote sensing can enable geomorphic study of areas that are inacessible to field-investigation and GIS can performing spatial analysis by an unique way. Such conducting unsupervised to determine settlement area, generating slope from satellite imagery and with GIS all result can be map and analysis by using spatial analysis. To develop knowledge base which will use as an input for decision support system.
The core and simultaneously benefit of this research is the capabilities of GIS and Remote Sensing technology that can help geoscientist especially geologist to capture, manipulate and analyze of information about an object without physical contact as preliminary survey (reconnaissance), mainly for geomorphic study of areas that are inaccesible to field-base investigation. Moreover, by utilizing the available sources of data (data provider) GIS and Remote Sensing can be used more effective and efficient compared to the current or traditional methods for interpreting extremely large cover research area.
THE APPLICATION OF GIS AND REMOTE SENSING
FOR DETERMINING SENSITIVE AREA
BASED ON GEOLOGICAL HAZARD PERSPECTIVES
EFO HADI
A Thesis for the degree of Master of Science Of Bogor Agricultural University
MASTER OF SCIENCE IN INFORMATION TECHNOLOGY
FOR NATURAL RESOURCE MANAGEMENT
GRADUATE SCHOOL
Master of Science in Information Technology for Natural Resources Management
: Study Program
G.051034011 :
Student ID.
Efo Hadi :
Name
The Application of GIS and Remote Sensing for Determining Sensitive Area Based On Geological Hazard Perspectives
: Research Title
Approved by, Advisory Board
Ir. Iwan Setiawan, PM Co-Supervisor DR. Ir. Kudang Boro Seminar, M.Sc.
Supervisor
Endorsed by,
Dean of Graduate School
DR. Ir. Khairil A. Notodiputro, MS Program Coordinator
DR. Ir. Tania June
CURRICULUM VITAE
Efo Hadi was born in Jakarta, Capital City of Indonesia at
September 24, 1963. He spent of his childhood and school
from elementary to SMU at Jakarta. He achieved his
undergraduate degree from Department of Geological
Engineering, Universitas Pakuan, Bogor in 1995. Since
1987, during undergraduate study, he worked as geologist
assistant in several mining companies in Indonesia, particularly for geological
data processing by means of computer technology.
In the year 2003, Efo Hadi pursued his master degree at MIT (Master of
Science in Information Technology) for Natural Resource Management Program
at Bogor Agricultural University. He proposed a method for Determining
Sensitive Area based on Geological Hazard Prespectives by using GIS and
ACKNOWLEDGEMENT
Intiallly, I would like to express my gratefulness to ALLAH SWT for the
favors and mercies to me during the time. I wish to thank to my supervisor DR. Ir.
Kudang Boro Seminar, M.Sc and my co-supervisor Ir. Iwan Setiawan, PM for the
guidance, advices, comments, encouragement and also constructive criticism
during the supervision of my research through all months until the research was
finished.
I wish also to thank and give most appreciation to MIT student’s batch
2003 for the togetherness, assistances, and the enlightment we shared for all this
time, how we support each other during study until the last semester of our study.
It is really a big gift and honor to me for knowing great people with different
background and expertise like you guys. I would like to thank also to the staff of
the Master of Science in Information Technology for Natural Resources
Management (MIT) Program for the good cooperation and facilitation, special
thank also to MIT lectures for sharing and imparting their knowledge and
experiences during the time.
Finally, I deeply wish to express my most gratefulness to my beloved wife,
Vietnami Ardya Gharini Kusumawardhani, for her support, patient, caring,
devotion, and everything during my study, especially to watch over our doughters
(Maulidina Inayah and Nabila Lam’anah) and son (Ahmad Sya’roni). Thank also
to my mother and father (alm.), sister, uncles, aunts, parent in law for your
support and caring. Last but not least, I wish to dedicate this thesis to my dear
uncle, Prof. DR. Harsono Suwardi, MA for spirit you inspired me in finishing this
TABLE OF CONTENTS
45 Geological Hazard Sensitive Area
4.6. . . . 44 Geomorphological Interpretation
4.5. . . . 43 Rock Type Risk Zone
4.4. . . . 42 Slope Stability Risk Zone
4.3. . . . 40 Land Stability Risk Zone
4.2. . . . 39 Settlement Area
4.1. . . .
RESULT AND DISCUSSION IV.
38 Geological Hazard Mitigation Map
3.7. . . . 35 Geomorphological Interpretation
3.6. . . . 34 3.5.2. Vector Data Preparation, Classification and Analysis . . . .
33 3.5.1. Images Data Preparation, Classification and Analysis . . . .
32 Methodology
3.5. . . . 31 Required Tools
3.4. . . . 28 Data Sources
3.3. . . . 28 Research Area
3.2. . . . 28 Time and Location
3.1. . . .
RESEARCH METHODOLOGY III.
22 Geology of Research Area
2.5. . . . 20 2.4.3. Geological Risk Map . . . .
19 2.4.2. Sensitive Area . . . .
18 2.4.1. Plate Tectonics At A Glance . . . .
14 2.4. Geological Hazards . . . .
12 2.3. Decision Support System . . . .
11 2.2.1. Classification of Remotely Sensed Imagery . . . .
9 2.2. Remote Sensing And Interpretation . . . .
5 2.1. Geographic Information System (GIS) . . . .
LITERATURE REVIEW II.
4 1.5. Thesis Structure . . . .
3 1.4. Benefit of Research . . . .
3 1.3. Objectives . . . .
2 1.2. Scope of The Research . . . .
1 1.1. Background . . . .
INTRODUCTION I.
vi List of Appendices . . . .
v List of Tables . . . .
iii List of Figures . . . .
i Table of Contents . . . .
54
REFERENCES . . . . 52 Recommendations
5.2. . . . 52 Conclusions
5.1. . . .
CONCLUSIONS AND RECOMMENDATION V.
LIST OF FIGURES
Figure 4.6. . . .
44 Structural Geology interpretation by fault pattern of back-hill, valley
and main stream of research area Figure 4.5.
. . . .
44 Risk Zone by Rock Type
Figure 4.4. . . .
43 Slope Stability Risk Zone Map
Figure 4.3. . . .
41 Mineralization Zone indicating Land Stability Risk Zone
Figure 4.2. . . .
39 Result of unsupervised settlement area
Figure 4.1. . . .
37 Types of drainage patterns (Thornbury, 1989)
Figure 3.7. . . .
36 Dendritic pattern (Thornbury, 1989)
Figure 3.6. . . .
32 Methodology of Research
Figure 3.5. . . .
30 Landsat 7ETM+ of research area
Figure 3.4. . . .
30 Geologic Map of Study Area
Figure 3.3. . . .
29 SRTM of Study Area
Figure 3.2. . . .
29 Administration Map from BAKOSURTANAL
Figure 3.1. . . .
26 Southeast Asia Seismic Zonation Map Planned by USGS (USGS in
Irsyam, 2006) Figure 2.11.
. . . .
25 Active Tectonic of Indonesia: Crustal motion from GPS study. (Bock
et all. 2004 in Natawijaya & Latif, 2006) Figure 2.10.
. . . .
23 Physiographic Distribution Map of West Java (Asikin, 1986)
Figure 2.9. . . .
22 Research area (Landsat TM Path/Row: 122/65)
Figure 2.8. . . .
19 The rock cycle, interpreted in plate-tectonic terms. (Source:
Montgomery, 1991, p. 140) Figure 2.7.
. . . .
18 Lithosphere plate movements (Source: Asikin, 2003)
Figure 2.6. . . .
17 Volcanism and Plate Tectonic (Source: After Montgomery, 1991, p.
180) Figure 2.5.
. . . .
16 Location of modern volcanoes and earthquake around the world
(Source: After Montgomery, 1991, p. 126) Figure 2.4.
. . . .
14 General Tectonic Pattern of Indonesia (Source: USGS)
Figure 2.3. . . .
11 A. Geology structure interpretation on satellite image showing the
direction of earth surface movement (strike-slip fault). B. (Top) The occurrence processes of fault and slip; (Middle) Elastic energy will assembled within the earth; (Below) Earthquake damage settlement along the fault line.
Figure 2.2.
. . . .
5 Component of GIS (Eastman, J.R, 2003)
Figure 2.1. . . .
3 Research Scope that will be Applicated By Using Remote Sensing
and GIS (Asikin, 2003) Figure 1.1.
. . . .
48 Geological Hazard Risky Settlement
Figure 4.10. . . .
48 Geological Hazard Settlement Sensitive Area
Figure 4.9. . . .
47 Sensitive Area over Rock Type
Figure 4.8. . . .
45 Drainage pattern interpretation of research area
Figure 4.7. . . .
45 Rose-diagram of 150 lineaments of research area, show the
Southwest-Northeast direction of fault system of research area
(N10o-20oE) . . . .
LIST OF TABLES
49 Risky Settlement Area in West Java and Banten
Table 4.4. . . .
43 Rock Type Distribution Weighting
Table 4.3. . . .
42 Slope Distribution Weighting
Table 4.2. . . .
42 Mineral Distribution Weighting
Table 4.1. . . .
35 Rock type and physical characteristics in research area (Sampurno,
1975) Table 3.2.
. . . .
34 Characteristics of the slope categories for land development (Howard
& Remson, 1978) Table 3.1.
. . . .
23 Study Area of Research
Table 2.1. . . .
LIST OF APPENDICES
Appendix 5. Geologic Time Scale
Appendix 4. Slope Generating from SRTM by means of Global Mapper & ArcGIS
Appendix 3. Creating Alteration Zone by means of ER Mapper
Appendix 2. Settlement Extraction from Landsat Imagery by means of ER Mapper and ArcView/ArGIS
I. INTRODUCTION
1.1. Background
Geological hazards is hazard which is usually classified as geological:
earthquakes, faulting, tsunamis, volcanoes, avalanches, landslides, and floods. It
is a well known fact that geological hazard disaster strikes countries, causes
enormous destruction and creates human sufferings and produces negative
impacts on national economies. Due to diverse geo-climatic conditions prevalent
in different parts of the globe, different types of geological hazard disaster strikes
according to vulnerability of the area. Worldwide growth of population and
particularly concentration of man and his works into urban areas, has heightened
such treats to level where large-scale, and often costly, planning to reduce the
hazard has become essential in many country.
Overall assessment of actions needed is complicated in many ways. In fact,
the source of major geological hazard may be, at the same time, a great asset to
community. A mountain range providing water, irrigation, and recreation may
lead to killer flood; rich volcanic soil for agriculture may surround a still lethal
volcano; by products of great active fault or rift are often minerals, natural
resources, beneficial climatic effects and magnificent scenery. Volcanic and
geothermal areas may provide geothermal steam for power generation.
The area under study it self is located in the West Java province that
represent a part of Java Island in Indonesia which has a complex geologic
According to Sampurno (1975) this area has many experiences of suffering
hazard from landslides compared to other areas. Those hazard are progressively
felt nowadays due to mass movements or landslide is endangering human life and
their properties, such as houses, roads and rail roads, rice fields and farms, ranch,
irrigation channel and others.
Although landslide is influenced by steepness of slope factor, rain falls,
water stream, vegetation, and the result of man activities such as digging and
others that can enlarger particular slope angle, however the major dominant
control factor of those hazard is beginning from geologic structure which includes
stratigraphic implications and tectonic activities to constructs the land forms from
within the earth’s.
In the framework of this research, GIS and remote sensing technology will
be used to determine geological hazard sensitive area. Remote sensing is used for
geological interpretation such geomorphology, drainage and structure patterns
which indicate the general tectonic patterns. While GIS is used for spatial analysis
to determine geological hazard sensitive area by overlying the geological
interpretation result with geologic map and other maps that required in analysis.
1.2 Scope of The Research
Geological hazard is disaster generated by effect of direct or indirect
corresponding natural phenomenon with geologic processes including man.
The scope of this research is how GIS and Remote Sensing technology
simultaneously can be used to determining geological hazard sensitive area based
on geomorphological interpretation from satellite imagery, distribution of rocks
Figure 1.2. Research scope that will be applicated by using Remote Sensing & GIS. (Asikin, 2003)
1.3 Objectives
The main purpose of the research is using GIS and Remote Sensing
technology to determine sensitive area based on geological hazard perspectives. It
will have a function to support a decision support system in order to take decision
for placement of settlement location in West Java area. The result will contribute
as a knowledge base which can be utilized by public, city planners, city officials
and also policy makers to make future decision concerning the places of suitable
settlement in order to obtain the sustainable development.
1.4 Benefit of Research
The core and simultaneously benefit of this research is how GIS and
Remote Sensing technology will helps geoscientist especially geologist to capture,
manipulate and analyze of information about an object without physical contact as
preliminary survey (reconnaissance), mainly for geomorphic study of areas that
sources of data (data provider) GIS and Remote Sensing can be used more
effective and efficient compared to the current or traditional methods particularly
for interpreting extremely large cover research area.
Finally, the result of the research will be mapped in digital and paper forms
that come with additional data showing further information, created with GIS
software and intentionally published in digital map which entitled as Geological
Hazard Sensitive Area Map.
1.5 Thesis Structure
The thesis is structured into five chapters, each of which is described as
follows:
Chapter 1 describes research background, scope and objectives;
Chapter 2 describes literature review related to the theory of Geological
Hazard, remote sensing and spatial analysis in GIS and decision support
system weighting methods;
Chapter 3 describes research methodology includes data source, tools
used in the research, location and also weighting procedures;
Chapter 4 represent results and discussions of the research, and
II. LITERATURE REVIEW
To determine geological hazard sensitive area by using GIS and remote
sensing approach needs fundamental building theory to stretch the system
thinking of building thesis structure.
2.1 Geographic Information System (GIS)
Geographic Information System (GIS) is a computer-assisted system for the
acquisition, storage, analysis and display of geographic data. GIS is typically
made up of variety of different components. Figure 2.1 gives a broad overview of
the software components typically found in a GIS.
Figure 2.1. Components of GIS (Eastman, J.R, 2003)
Central to the systems is the database - a collection of maps and associated
futures, it can be seen to be compromised of two elements: (i) a spatial database
describing the geography (shape and position) of earth surface features, and (ii) an
attribute database describing the characteristics or qualities of these features. Thus
for example, a property parcel defined in the spatial database and qualities such as
its land use, owner, property valuation, and so on, in the attribute database.
In some systems, the spatial and attribute database are rigidly distinguished
from one another, while in others they are closely integrated into a single entity,
hence the line extending only half-way through the middle circle of Figure 2.1.
However, it also offers the option of keeping some elements of the attribute
database quite separate.
Surrounding the central database, there are a series of software components.
The most basic of these is the Cartographic Display System. Cartographic
Display System allows one to take selected elements of the database and produce
map output on the screen or some hardcopy device such as a printer or plotter.
Software systems that are only capable of accessing and displaying elements of
the database are often referred to as Viewers or Electronic Atlases.
After cartographic display, the next most essential element is a Map
Digitizing System. With a Map Digitizing System, one can take existing paper
maps and convert them into digital form, thus further developing the database. In
the most common method of digitizing, one attaches the paper map to a digitizing
tablet or board, then traces the feature of interest with stylus or puck according to
the procedures required by the digitizing software. Many Map Digitizing Software
also allow for editing of the digitized data. Scanners may also be used to digitized
outlines of features that are created with a digitizing tablet. Scanning software
typically provides users with a variety of standard graphics file formats for export.
These files are then imported into the GIS. Digitizing packages, Computer
Assisted Design (CAD), and Coordinate Geometry (COGO) are examples of
software system that provide the ability to add digitized map information to the
database, in addition to providing cartographic display capabilities.
The next logical component in a GIS is a Database Management System
(DBMS) such as those which have been discuss in the previous. Traditionally, this
term refers to a type of software that used to input, manage and analyze attribute
data. It is also used in that sense here, although we need to recognize that spatial
database management is also required. Thus, a GIS typically incorporates not only
a traditional DBMS, but also a variety of utilities to manage the spatial and
attribute components of the geographic data stored.
With a DBMS, it is possible to enter attribute data, such as tabular
information and statistics, and subsequently extract specialized tabulations and
statistical summaries to provide new tabular reports. However, most importantly,
a Database Management System provides us with the ability to analyze attribute
data. Many map analyses have no true spatial component, and for these, a DBMS
will often function quite well. The final product (a map) is certainly spatial, but
the analysis itself has no spatial qualities whatsoever. Thus, the double arrows
between the DBMS and the attribute database in Figure 2.1 signify this distinctly
non-spatial form of data analysis. Software that provides cartographic display,
map digitizing, and database query capabilities are sometimes referred to as
Beside a very powerful set of capabilities of the ability to digitize spatial
data and attach attributes to the features stored, to analyze these data based on
those attributes, and to map out the result, one most important in GIS is
Geographic Analysis System.
With a Geographic Analysis System, the capabilities of traditional database
query can be extend to include the ability to analyze data based on their location.
Perhaps the simplest example of this is to consider what happens when users are
concerned with the joint occurrence of features with different geographies. For
example, suppose the user want to find all areas of residential land on bedrock
types with high level of radon gas. This is a problem that a traditional DBMS
simply cannot solve because bedrock types and landuse divisions do not share the
same geography. Traditional database query is fine as longs we are talking about
attributes belonging to the same features. But when the features are different, it
cannot cope. For this we need GIS. In fact, it is this ability to compare different
features based on their common geographic occurrence that is the hallmark of
GIS. This analysis is accomplished through a process called overlay, thus named
because it is identical in character to overlaying transparent maps of the two entity
groups on top of one another.
Like the DBMS, the Geographic Analysis System is seen in Figure 2.1 to
have a two way interaction with database. The process is distinctly analytical in
character. Thus, while it may access data from the database, it may equally
contribute the results of that analysis as a new addition to the database. For
example, we might look for the joint occurrence of lands on steep slopes with
risk map was not in the original database, but was derived based on existing data
and set of specified relationships. Thus the analytical capabilities of the
Geographic Analysis System and the DBMS play vital role in extending the
database through the addition of knowledge of relationships between features.
In addition to these essential element of a GIS, a Cartographic Display
System, a Map Digitizing System, a Database Management System and a
Geographic Analysis System, some software system also include the ability to
analyze remotely sensed images and provide specialized statistical analyses.
Image processing software allows one to take raw remotely sensed imagery (such
as Landsat or SPOT satellite imagery) and convert it into interpreted map data
according to various classification procedures.
For statistical analysis, some GIS software system offers both traditional
statistical procedures as well as some specialized routines for the statistical
analysis of spatial data. Geographers has developed a series of specialized
routines for the statistical description of spatial data, partly because of the special
character of spatial data, but also because spatial data pose special problems for
inferences drawn from statistical procedures.
2.2 Remote Sensing and Interpretation
Remote sensing is the science and art of obtaining information about an
object, area, or phenomenon through the analysis of data acquired by a device that
is not in contact with the object, area, or phenomenon under investigation
(Lillesand and Kiefer, 1994). Satellite-based systems can measure phenomenon
(Aronoff, 1989). By convention “from distance” generally considered being large
relative to what a person can reach out and touching, hundreds of feet, hundred of
miles or more. Remote sensing techniques are used extensively to gather
measurement.
Geologists, geomorphologist, and other scientists routinely use the synoptic
view associated with remotely sensed data to identify and interpret geomorphic
features on the Earth’s surface. In fact, identifying, understanding, and
appreciating the nature of landforms present on remotely sensed imagery is one of
the great benefits of remote sensing science. One should take time to appreciate
the tremendous beauty and variety of landform on the Earth and how ecosystems
associated with the various landforms interact with one another. For example,
satellite-based system can measure that change continuously over time and large
cover, even inaccessible areas. The science of remote sensing provides instrument
and theory to understand how objects and phenomena can be detected. The art of
remote sensing is in the development and use of analysis techniques to generate
useful information.
Though remote sensing will not replace the traditional geological field
study, the value of remote sensing to provide a synoptic overview of a landscape
cannot be overlooked. Historically, the use of remote sensing in geomorphology
has been mainly interpretive, enabling geomorphologist to develop ‘picture’ of
landscape and as a map-making aid. However, the use of remote sensing for
quantitative geomorphic study is growing rapidly.
Remote sensing provides unique global views at different spatial scales and
useful for the sub disciplines of megageomorphology, which emphasizes the study
of planetary surfaces at large scales (Baker, 1986). Remote sensing can also
enable geomorphic study of areas that are inaccessible to field-based
investigation.
In the framework to this research, since geomorphology constitute a
primarily geology (Thornbury, 1969) we will use remote sensing as the tools for
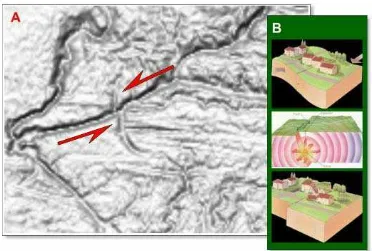
[image:34.595.125.497.288.539.2]monitoring geomorphological aspects that produced by geological processes.
Figure 2.2. A. Geology structure interpretation on satellite image (SRTM) of research area, showing the direction of earth surface movement (strike-slip fault). B. (Top) The occurrence processes of fault and slip; (Middle) Elastic energy will assembled within the earth; (Below) Earthquake damage settlement along the fault line.
2.2.1 Classification of Remotely Sensed Imagery
Classification is the process of developing interpreted maps from remotely
sensed images. As a consequence, classification is perhaps the most important
However, with the advent of computers and digital imagery, attention has focused
on the use of computer-assisted interpretation. Although the human eye still
brings a superior set of capabilities to the classification process, the speed and
consistency of digital procedures make them very attractive. As a consequence,
the majority of classification projects today make use of digital classification
procedures, guides by human interpretation.
There are two basic approaches to the classification process: supervised and
unsupervised classification. With supervised classification, one provides a
statistical description of the manner in which expected land cover classes should
appear in the imagery, and then a procedure (known as a classifier) is used to
evaluate the likehood that each pixel belongs to one of these classes. With
unsupervised classification, a very different approach is used. Here another type
of classifier is used to uncover commonly occuring and distinctive reflectance
patterns in the imagery, on the assumption that these represent major land cover
classes. The analyst then determinees the identity of each class by combination of
experience and ground truth (i.e., visiting the study area and observing the actual
cover types).
2.3 Decision Support System
While decision support is one of the most important function of a GIS, tools
designed especially for this are relatively few in most GIS software. However, a
complete GIS software should include several modules specifically developed to
aid in the resources allocation decision making process. These include modules
suitability maps under varying levels of trade off, and address allocation decision
when there are multiple objectives involved. Used in conjunction with the other
components of the system, these modules provide a powerful tool for resource
allocation decision makers.
The concept of decision support system (DSS) was first enunciated in
1970s by Scott Morton under term management decision systems. He defined
such systems as “interactive computer-based system, which help decision makers
utilize data and models to solve unstructured problems”. Another definition was
also introduced by Keen and Scott Morton in 1978s that declare the “decision
support system couple the intellectual resources of individuals with the
capabilities of the computer to improve the quality of decisions. It is a
computer-based support system for management decision makers who deal with
semi-structured problems.”
Furthermore, Moore and Chang (1980) define DSS as (i) extendable
systems, (ii) capable of supporting ad hoc data analysis and decision modeling,
(iii) oriented toward future planning, and (iv) used at irregular, unplanned
intervals. Thereby, from several definition above and much more, we can simplify
that DSS constitute an interactive, flexible, and adaptable computer-based
information system, specially developed for supporting the solution of a
non-structured management problem for improving decision making. It utilizes
data, it provides easy user interface, and it allows for the decision maker’s own
insight.
Aiding the deficiencies of human judgment and decision making has been a
of decisions is important, as particularly in complex systems, as management of
organizational operations, industrial processes, or bidding processes.
2.4. Geological Hazards
The majority of geological hazard that happening in Indonesia, especially
take place along volcanic belt mostly in Indonesian islands. This indicates that
Indonesian Islands located and controlled by a set of major tectonic activities.
Most of Indonesia's volcanoes are part of the Sunda arc, a 3,000-km-long line of
volcanoes extending from northern Sumatra to the Banda Sea. Most of these
volcanoes are the result of subduction of the Australian Plate beneath the Eurasian
Plate. Volcanoes in the Banda Sea are the result from subduction of the Pacific
Plate under the Eurasia Plate. On the Figure 2.3 shows the black "teeth" are on the
overriding plate and the arrows showing the direction of movement along major
transform faults.
Figure 2.3. General Tectonic Pattern of Indonesia (Source: USGS)
In congeniality of geomorphic processes, the landscape changes is a
represents a fleeting stage in a continuing conflict between internal processes
which tend to elevate the lands and external processes which tend to wear them
down. Although the results of such changes is generally imperceptible and
becomes visible in the landscape only after centuries or millennia, however,
individual local events such earthquakes, tsunamis, volcanoes, avalanches,
landslides and floods may take place very rapidly and constitute serious
environmental hazards.
Those geological hazards, are mostly, unpredictable. On the other hand,
human often induce change or accelerate the process of changes with their needs
for existence. Their problems is not to bring environmental change to a halt, a
generally impossible task, but to adapt to the environmental and to occupy it with
the least physical and aesthetic damage. Thereby, as a consequence, one of them,
as does a victim of geologic disaster that occurred in our country is primarily
caused by poorly planned placement of settlement locations. To do so, people
must be familiar with earth processes so that they may avoid or minimize damage
to the terrain as well as to life and property, equally, to reduce its detrimental
effects, however, we should understand the condition of our environment
geologically, mainly the major of geological aspect that operates in selected areas.
Refering to the scope of the research on the previous chapter, geological
hazards is disaster generated by effect of direct or indirect corresponding natural
phenomenon with geologic processes including man. There are two types of
geological hazards generated by the direct effect, first earthquake and the second
Figure 2.4. Location of modern volcanoes and earthquakes around the world (Source: After Montgomery, 1991, page: 126)
Earthquakes result from sudden slippage or failure of rocks along fault
zones in response to stress. Most earthquakes occur at plate boundaries and are
related to plate-tectonic processes. The pent-up energy is released through seismic
waves, which include both compressional and shear body waves, plus surface
waves, which cause the most structural damage. Earthquake hazards include
damage from ground rupture and shaking, fire, liquefaction, landslide, and
tsunamis (Montgomery, 1991).
We cannot hope to stop earthquakes, but we can try to limit their destructive
effects. Physical damage could be limited by the following: seeking ways to cause
locked faults to slip gradually and harmlessly, perhaps by using fluid injection to
reduce frictional resistance to shear; designing structures in active fault zones to
be more resistant to earthquake damage; identifying and, wherever possible,
avoiding developments in areas at particular risk from earthquake-related hazards.
Casualties could be reduced by increasing public awareness of and by improving
our understanding of earthquake precursor phenomena so that accurate and timely
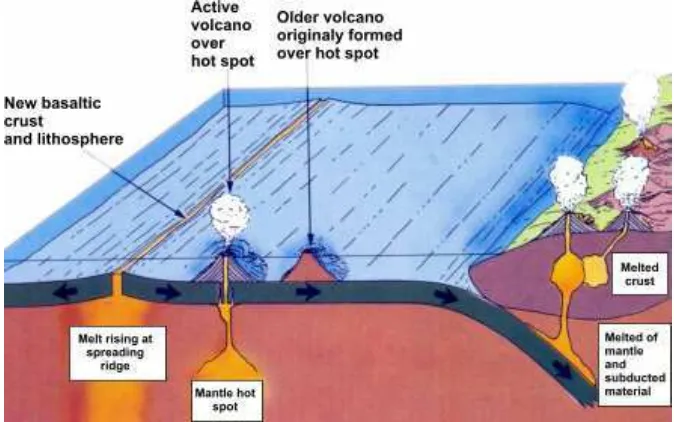
Furthermore, most volcanic activity is concentrated near plate boundaries.
Volcanoes differ widely in eruptive style and thus in the kinds of dangers they
represent. Spreading ridges and hot spots are characterized by the more fluid,
basaltic lava's. Subduction-zone volcanoes typically produce much more viscous,
silica-rich, gas-charged andesitic magma, so in addition to lava they may emit
large quantities of pyroclastics and other deadly products like nuées ardentes.
Lava is perhaps the least serious hazard associated with volcanoes: it moves
[image:40.595.143.480.309.520.2]slowly, it can sometimes be diverted, and its path can be predicted.
Figure 2.5. Volcanism and Plate Tectonic (Source: Montgomery, 1991, page: 180)
The result of explosive eruption are less predictable, and the eruptions
themselves more sudden. According to Montgomery (1991) an early sign of
potential volcanic activity includes bulging and warming of the ground surface
and increased seismic activity. Volcanologists cannot yet predict precisely the
definite time or type of eruption, except insofar as they can anticipate eruptive
style on the basis of historic records, the nature of the products of previous
2.4.1 Plate Tectonics At A Glance
The outermost solid layer of the earth is the 50- to 100-kilometer-thick
lithosphere, which is broken up into a series of rigid plates. The lithosphere is
underlain by a plastic, partly molten layer of the mantle, asthenosphere, over
which the plates can move.
Figure 2.6. Lithosphere plates movements (Source: Asikin, 2003)
This plate motion give rise to earthquakes and volcanic activity at the plate
boundaries. At seafloor spreading ridge, which are divergent boundaries, new sea
floor is created from magma rising from asthenosphere. The sea floor moves in
conveyor-belt fashion, ultimately to be destroyed in subduction zones, a type of
convergent plate boundary, where it is carried down into the asthenosphere and
eventually remelted. Convergence of continents from high mountain ranges.
According to Montgomery (1991), the evidence for seafloor spreading
includes the distribution of ages of seafloor rocks, and magnetic stripes on the
ocean floor. Continental drift can be demonstrated by such means as polar-wander
curves and evidence of ancient climates as revealed in the rock record. Past
margins and matching up similar geologic features and fossil deposits from
continent to continent.
Present rates of plate movement average a few centimeters a year. A
mechanism for moving the plates has not been proven definitively. The most
likely driving force is slow convection in the asthenosphere (and perhaps in the
deeper mantle). Although plate motions are less readily determined in ancient
rocks, plate- tectonic processes have probably been more or less active for much
of the earth’s history. They play an integral part in the rock cycle as shown in
Figure 2.7.
Figure 2.7. The rock cycle, interpreted in plate-tectonic terms. (Source: Montgomery, 1991, page: 140)
2.4.2 Sensitive Area
The term of sensitive area in this research is areas which are geologically
can generate hazard when on those respected areas used as settlement areas or
human other activities. Its includes areas which are dominant controlled by
areas which are formed above clay and limestone, volcanic and geothermal area
and of course an opened coastal areas surrounds by bay, which entirely, in
agreement with on going geomorphic processes which shape the Earth’s surface.
2.4.3 Geological Risk Map
The first step in the study of collective geological hazards is the plotting of
specific information on maps at the same scale. A geological map, for example,
present the areal distribution of rock structure and type. The scale chosen and the
emphasis on particularr features may be selected to optimize the use of
information for a particular need.
In California, a new 1:750,000 scale geological map was produced in 1972
to give an over-view of the geological properties of the State with sufficient detail
to be useful for preliminary land-use planning. Published in color, it emphasizes
recent volcanic rocks and volcanoes, earthquake fault and the major folds in the
layered rocks. Maps with much more detail than feasible on the usual 1:250,000
to 1:1,000,000 scale maps are needed for specific hazard evaluations. For urban
areas, specializied mapping for land-use planning and engineering design must
show considerable detail and even include geophysical and boreholes studies of
local subsurface structure. The required scale may be of the order of 1:20,000.
Recent examples are slope maps produced by the U.S. Geological Survey with
scale of 1:24,000. These maps indicaete the per cent of slope of hills and
mountains by means of color code so that assessment of hillside erosion and
stability conditions can be made. Likewise, U.S.G.S and Corps of Engineers flood
hazard maps at about this scale show the elevations attained by major historical
There are several unsatisfactory features of the usual geological map
published in most countries. First, these maps often emphasize the formations
(igneous, basin deposits, etc.) rather than the rock types involved. Alluvium
consists of fine- and coarse-grained material may have depth and horizontal facies
changes that lead to major seismic response consequences. Again, it is not
sufficient to say that a given formation consists largely of sandstone and shale
without mapping bed boundaries. The Geological Survey of New South Wales in
Australia has tried to solve the problem by indicating overburden and underlying
rock units by appropriate symbols. In this way, the map color defines the
underlying rock, while the map symbol tags the type of overburden. In New
Zealand, the Soil Bureau of the Department of Scientific and Industrial Researche
produces maps of soil type that may be read in conjunction with standard
geological maps. In the New England States, USA, one series of maps delineates
bedrock and another the superficial glacial deposits (Bolt et al 1975: 288).
Another weakness is lack of detail when mapping the weathered conditions
of the rock types. The depth of weathering may be of considerable importance in
estimating the response of the ground to strong earthquake motion. In the same
way, locations of unobscured bedrock exposures deserve plotting on the basic
geological maps so that when detailed investigations are needed these outcrops
can be revisited quickly Alluvial deposits often require sub-division, appropriate
to the scale used (e.g. 1:250,000) showing flood plains, lake deposits, colluvial,
residual soils, and so on. In this way, parts of a particular surficial deposit,
consisting of fine-grained material with braided stream channels of coarser
In many country and also in Indonesia, a recent imaginative development is
the use of computers to calculate and draw predictive hazard maps. Once the
controling parameters of the hazard are known these can be combined into
mathematical form and programmed once and for all.
The differences between this research compared with another that
mentioned above, principally in geological and geomorphological interpretation
point of view. This research thoroughly used GIS and Remote Sensing
Technology for determining geological hazard sensitive area through integrating
remote sensing capability especially principal component analysis (PCA)
procedures to obtain common picture of present rocks and minerals distribution
which indicating past as well as endogenetic and exogenetic processes.
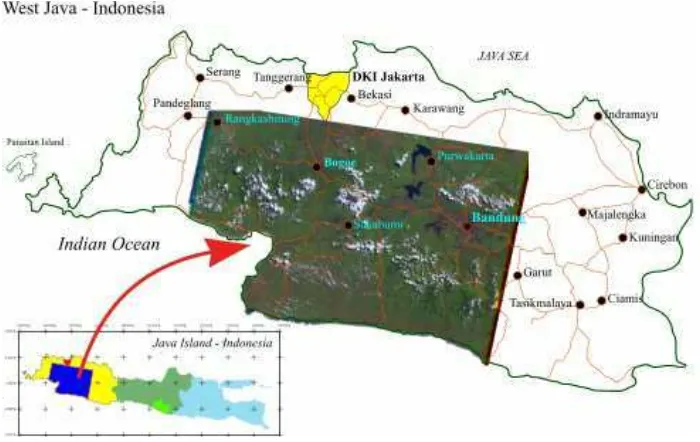
2.5. Geology of Research Area
Research area located in West Java, precisely one scene of Landsat 7 ETM,
[image:45.595.124.474.491.712.2]path: 122 row: 65. (Figure 2.8)
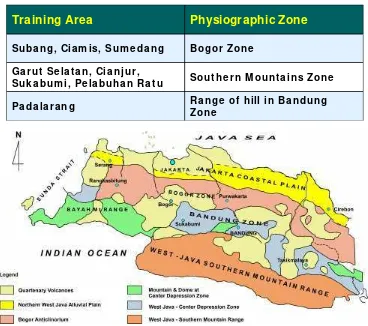
In general, geologically, there are three physiographic zone that represent
sensitive areas in Southern West Java, that are Bogor Zone, Southern Mountain
Range Zone (‘Zona Pegunungan Selatan’) and range of hill in Bandung Zone.
Ra n ge of h ill in Ba n du n g Zon e
Pa da la r a n g
Sou t h e r n M ou n t a in s Zon e Ga r u t Se la t a n , Cia n j u r ,
Su k a bu m i, Pe la bu h a n Ra t u
Bogor Zon e Su ba n g, Cia m is, Su m e da n g
[image:46.595.127.495.187.513.2]Physiographic Zone Training Area
Table 2.1. Study area of Research
Figure 2.9. Physiographic Distribution Map of West Java (Asikin, 1986)
According to Sampurno (1975), Bogor Zone is characterized by series of
Tertiary marine deposite which mostly consist of clay, napal, tuff claystone,
sandstone and volcanic sediment. Most of those sedimentary beds folded
moderately with steepness more than 25 degree. Dimensional of this area more or
less 10 percent of West Java. Covered unconformability by young volcanic
Fault structures frequently founded with intensive joint. Field frequently
constitute elongated hilliest that unidirectional with strike of bed that shows
West-East direction with steepness of slope about 10 - 30 percent in general
including steepy escarpment. Loose rock particles deposit can be founded at base
of escarpments as there are in North Ciamis area.
Furthermore, the Southern Mountain Range Zone, geologically
characterized by Tertiary marine sedimentary rocks in term of clay, sandstone,
limestone and turbidity volcanic sediment. Additionally, igneous rock intrusion
also exist in this zone. According to Sampurno (1975), in general, this zone has a
horizontal or aslant beds direct to South. Dimesional of this area more or less 20
percent of West Java and in general constitute form of plateau with steepy valley
incised. Loose rock particles deposit founded at broad valley basement which
represent accumulated from valleys wall surrounding as there are in South Garut
and South Cianjur.
Endmost, the Range of Hill in Bandung Zone, According to Sampurno
(1975), this area deputized by Rajamandala Mountains which geologically
characterized by Tertiary marine sedimentary rocks in term of clay, sandstone,
limestone, with small intrusion on some place. Steepness of slope is about 25 - 45
degree which controlled by fault and intensive joint. The area, in general
approximately steepy in term of elongated hilliest with steepy escarpments.
Tectonically, physiographically Banten area very resemble with
characteristic of Sumatra Island, if compared with its East side. Except some
which many acid tuff (Banten Tuff) as does Acid Lampung Tuff, at least it can be
used as a base of an opinion.
Figure 2.10. Active Tectronic of Indonesia: Crustal motion from GPS study. (Natawijaya & Latif 2006)
According to Asikin (1986) based on gravity, seismic, landsat image
interpretation and field observation, there are four fault pattern systems in West
Java, i.e.:
1. Sumatra direction (Northwest - Southeast),
2. Java direction (East - West), and
3. North - South direction which very dominant at North side of Java Island and
Java Sea area.
4. Southwest - Northeast direction that very prominent at corner of Northeast of
Java Island (Cimandiri / Sukabumi) which assumed still active in connection
with distribution of intermediate and shallow earthquake epicentre. (Figure
Figure 2.11. Southeast Asia Seismic Zonation Map Planned by USGS ( USGS in Irsyam, 2006)
The oldest rock unit that exsposed in West Java is Early Eocene rocks at
Ciletuh area (Southern Pelabuhan Ratu). Its tectonically connected with
brecciated and serpentinized ophiolites rock at contact belt. Those ophiolites
interpreted as part of melangé which also constitute of Early Eocene olistostrome.
Thus, the oldest rock unit in West Java is Pre-Eocene subduction belt.
Another Pre-Tertiary rocks in West Java only founded from oil drilling at
such volcanic breccia, lava and tuff (Jatibarang Formation), and also metamorphic
rocks such slate, phyllite and marble. Those rocks association mentioned can be
related with Cretaceous subduction belt that in this case constitute its magmatic
belt.
Another tectonic setting of West Java according to Asikin (1986) is Tertiary
Magmatic Belt which located along Southern Java Island coast line namely Old
Andesite Formation at the age of Early Oligo Miocene. In West Java, part of this
III. METHODOLOGY
3.1 Time and Location
This research has been conducted from January 2006 to May 2006 at MIT
(Master of Science in Information Technology) research laboratory, SEAMEO
BIOTROP, Bogor Agricultural University, Bogor and GTC@UNPAK (UNPAK
GIS Center), Faculty of Engineering, Universitas Pakuan, Bogor. The location of
this research is in Southern West Java (Figure 2.8. Page: 22) where active tectonic
produces many geological phenomena which generated hazard sensitive areas.
3.2 Research Area
The research is focus on the determination toward sensitive area based on
geological hazard perspectives by means of remotely sensed data and GIS spatial
analysis methods, and also it will extend the mitigation recommendation for
secure settlement location by means weighting procedures for decision making.
3.3 Data Sources
Mainly the data has been used for this research acquired from previous
geologic research report, Administration Map from BAKOSURTANAL (Figure
3.1), free downloaded SRTM-Shuttle Radar Topographic Mission (Figure 3.2)
from internet, Geologic digital map from PT. Aneka Tambang, Tbk - Geomineral
Unit, Jakarta (Figure 3.3) and Landsat TM image of West Java 2001 with
Figure 3.1. Administration Map from BAKOSURTANAL
[image:52.595.168.459.464.714.2]Figure 3.3. Geologic Map of Study Area
3.4 Required Tools
Some supporting hardware’s and software’s that used for accomplishing this
research among others are:
y Microsoft Windows XP Professional SP1 operating system run on
Dell Latitude D400, Pentium class 1398 MHz and 512 MB RAM.
y ER Mapper 6.4. This software is used for image data collecting,
capturing, processing and analysis.
y Global Mapper 7.01. This software is used for converting SRTM
(shuttle radar topographic mission) to Digital Elevation Model format.
y ArcGIS 8.3. This software is used for spatial data collecting, capturing,
processing and analysis.
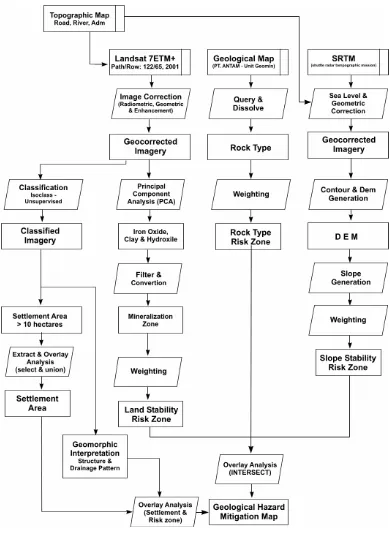
3.5 Methodology
[image:55.595.116.506.137.671.2]There are five main steps to perform the research as seen in figure 3.5.
3.5.1 Images Data Preparation, Classification and Analysis
The first step to this research is preparation of Landsat 7ETM+ (path/row:
122/65, 2001) using ER Mapper 6.4 software to obtain Settlement Area, surely
after correcting spatial distortion in an image (geometric correction) and removing
noise and image intensity variations due to antenna radiation pattern dan ground
scattering elements before. In this research topographic map from
BAKOSURTANAL data used in geometric correction as the GCP (ground control
point) information to rectify the errors. After all images corrected, the next
procedures is classifying image by unsupervised classification to obtain the
classified imageries. Furthermore, from the classified imageries, querying
performs to obtain settlement and openland area that have dimensional bigger
than 10 hectares. Finally, the desirable Settlement Area obtained after
performing overlay analysis (union) base on the image by means ArcGIS
software.
Meanwhile, by means of Landsat 7ETM+ path/row 122/65, year 2001,
another procedures to obtain Mineralization Zone can generated by extracting
iron-oxide and clay mineral in an image by performing PCA (principal
component analysis), filtering and convertion in ER Mapper software.
Another images data preparation is to generate Slope Stability Risk Zone
from SRTM data. As does Landsat imagery, SRTM also use topographic map to
make its corrected by geometric correction procedures in ER Mapper. Afterwards,
DEM obtained by generating contour in ArcGIS, where Slope Stability Risk
Zone obtained from weighting the slope generation based on characteristics of the
Generally too steep for real real estate development. Best resticted to wildlife, forestry, and limited grazing. Over 50 percent
(over 270)
High-rise apartment clusters and large-lot residences appropriate. Low density required. Suitable for low-intensity recreation and summer resorts. Forest and grazing lands.
30 to 50 percent (17 to 270
)
Too steep for most cultivation. Erosion problems. Slopes up to 20 percent suitable for crops such as artichoke and brussel sprouts. Also suitable for limited light industry, detached houses, high-rise apartments, institutional complexes and intensive recreational facilities.
15 to 30 percent (9 to 170
)
Moderately sloping. Too steep for airports or most heavy industry. I rrigation restricted but suitable for dry farming. Good drainage. Good setting for residential development.
5 to 15 percent (3 to 90
)
Almost level. Suitable for urban and agricultural development. Part susceptible to flooding and part with poor drainage.
0 - 5 percent (0 to 30
)
Characteristics and Suitability Slope Category
Table 3.1. Characteristics of the slope categories for land development
(Howard & Remson 1978)
3.5.2 Vector Data Preparation, Classification and Analysis
The only one vector data is Geological/Lithologic Map that will proceeses
to obtained Rock Type Risk Zone, where all procedures for this purpose has
been done by means of ArcGIS software. Lithologic/rock weighting obtained base
Loose soil, plastics Hard
Poor Volcanic breccia,
igneous rock, lava or andesite intrusion, dasite Composing decomposed soil; unfertile; exessively landslides for claystone/ shale Hard for limestone,
greywacke and soft/ intermediate for claystone Good for limestone;
poor for another rock. Limestone, sandstone, claystone/ shale, greywacke, volcanic breccia Composing loose soil - plastics; fertile soil:
escarpment slide / landslide potential I ntermediate, sometimes loose cause low cemented, permeable good: (10-1-10-2)
cm/ det. Volcanoc tuff, tuffaceous sandstone, lapili (lava fragment), volcanic breccia Loose weathered soil - plastics; partly can function as good aquifer, flood potential. Elastic, brittle,
permeable, loose poor: some may
good (10-1
-10-7
) cm/ det.
Clay, Tuffaceous claystone, organic clay, sand, gravel (breccia).
Another Condition Hardness
Permeability Rock type/ Bed
structure
Table 3.2. Rock type and physical characteristics in research area.
(Sampurno 1975)
3.6 Geomorphological Interpretation
Geomorphology is the branch of geology that examines the formation and
structure of the features of the surface of the Earth or another planet’s surface.
For geologists, geomorphological interpretation regularly conducted for
preliminary study before field-investigation performed.
In this research, geomorphic interpretation and description conducted
concerning fault (Figure 3.6.) and drainage (Figure 3.7.) pattern based on Landsat
7ETM+ (band 457 for structure lineaments and band 542 for drainage pattern)
Endogenic processes would give constructional forms which continuingly
slowly or catastrophically and causing lifting, folding and faulting. This
phenomenon produced Earth’s surface architecture known as structural geology.
In performing interpretation, structural geology represented by drawing
lineaments of back-hill, valley and main stream over a combined satellite images
such Landsat 7 ETM+ band 457 and SRTM of research area. Whereas in
performing drainage pattern interpretation conducted by using Landsat 7 ETM
ban 542 based on types of drainage pattern from Thornbury (1969).
The most commonly encountered drainage patterns are the dendritic, trellis,
barbed, rectangular, complex and deranged. Among these patterns, dendritic
pattern are by far the most common. They are characterized by irregular
branching of tributary streams in many directions and at almost any angle,
although usually at considerable less than a right angle. They develop upon rocks
of uniform resistance and imply a noteable lack of structural control. Dendritic
pattern are most likely to be found upon nearly horizontal sedimentary rocks or in
areas of massive igneous rocks but may be seen on folded or complexly
metamorphosed rocks, particularly when imposed upon them by superposision.
Another, parallel patterns are usually found where there are pronounced
slope or structural control which lead to regular spacing of parallel or
near-parallel streams. In rectangular drainage patterns, both main stream and its
tributaries display right-angle bends. They reflect control exerted by joint or fault
systems. Furthermore, trellis pattern display system of subparallel streams which
constitute characteristics of folded and strong steepnes area. Whereas radial
pattern have streams diverging from a central elevated tract. They developes on
domes, volcanic cones, and various other types os isolated conical or subconical
hills.
Figure 3.7. Types of drainage patterns (Thornbury, 1969)
Radial pattern Parallel pattern
3.7 Geological Hazard Sensitive Area Map
The Geological Hazard Sensitive Area Map will be produced by
intersections between Land Stability Risk Zone, Rock Type Risk Zone and
Slope Stability Risk Zone Maps named Risk Zone Map. Finally Settlement
Area Map is overlaid under the risk zone map. Importantly, the result from
IV. RESULT AND DISCUSSION
4.1 Settlement Area
Settlement area was extracted from Landsat 7 ETM+ data which is recorded
in year 2001.
Classification method being used is ISOCLASS Unsupervised
Classification with the result showed on Figure 4.1. Cause of the limitation of
spatial resolution in Landsat imagery which is 1 pixel represents area around 30
m2, it is quite difficult to distinguish between settlement area and open land. Thus,
the interpretation of settlement area was regarded from the calculation of
settlement class and open land class. (Appendix 2).
Figure 4.1. Result of unsupervised settlement area over Landsat 7ETM+ Year 2001
One of many Landsat 7 ETM+ capabilities is used for alteration zone