Corresponding Author: Marizan Sulaiman, Faculty of Electrical Engineering, Universiti Teknikal Malaysia Melaka, Durian Tunggal, Melaka
Detecting High Impedance Fault in Power Distribution Feeder with Fuzzy Subtractive
Clustering Model
1
Marizan Sulaiman, 2Adnan Hasan Tawafan and 3Zulkifilie Ibrahim
1,3
Faculty of Electrical Engineering, Universiti Teknikal Malaysia Melaka, Durian Tunggal, Melaka 2
Foundation of Technical Education, Baghdad, Iraq.
Abstract: An irregular activity on electric power distribution feeder, which does not draw adequate fault current to be detected by general protective devices, is called as High impedance fault (HIF). This paper presents the algorithm for HIF detection based on the amplitude of third and fifth harmonics of current, voltage and power. This paper proposes an intelligent algorithm using the Takagi Sugeno-Kang (TSK) fuzzy modeling approach based on subtractive clustering to detect the high impedance fault. The Fast Fourier Transformation (FFT) is used to extract the feature of the faulted signals and other power system events. The effect of capacitor bank switching, non-linear load current, no-load line switching and other normal event on distribution feeder harmonics is discussed. The HIF and other operation event data were obtained by simulation of a 13.8 kV distribution feeder using PSCAD. It is evident from the outcomes that the proposed algorithm can effectively differentiate the HIFs from other events in power distribution feeder.
Key words: Fft, High Impedance Faults, Subtractive Clustering, Tsk Fuzzy Modeling.
INTRODUCTION
A High Impedance Fault (HIF) is a weird event and difficult to detect on electric power distribution feeder. A high impedance fault is generated due to a faulty high impedance object or during an unnecessary electrical contact made by a main circuit conductor, which limits the current flow below the level of detection for the protective devices. Generally the resultant level of fault current will be lesser than the normal current (approximately 10 to 50 A) of the electric power distribution feeder (M. SEDIGHIZADEH1, A. REZAZADEH2, 2010).The failure to detect HIF results in adverse consequences such as, electric shock to human and probable fire accidents, which might cost human lives and assets. HIF does not usually pose any risk to the electric power distribution feeder; however, the protection against them desirable. Significant number of studies has been conducted since early seventies related to HIFs for identifying features in the current or voltage waveform, which might facilitate the detection of HIF (M. SEDIGHIZADEH1, A. REZAZADEH2, 2010).
HIF has many characteristics, the most two characteristics are the low current and arcing. The gaps created due to looseness of contact with the ground or the object that has been grounded. Furthermore, air gaps might also appear in the ground (soil) or in the grounded objects such as, concrete, trees etc. As soon as the air gap breaks down, a high potential is generated in a short distance and the sustainable current level in the arc is not adequate to be detected consistently by standard methods.
Few other electrical events also behave like the HIF (capacitor bank operation, air switching operation, nonlinear load and starting induction motor), therefore, the algorithm proposed to detect HIF should have ability to discriminate HIF from other normal events in power distribution system. Most of the detection methods require extensive computation in the reprocessing stage for feature extraction of the input signals. Then a strategy is applied to obtain detection parameters.
discrete S-transform (DST) , discrete time–time transform (DTT) (Samantaray, S.R., Panigrahi, B.K., Dash, 2008) and the wavelet packet transform (WPT) (Ghaffarzadeh & Vahidi, 2010).
A method for detecting HIF based on the nonlinear behaviour of current waveforms has been in the research work (Etemadi & Sanaye-Pasand, 2008), which employs a wavelet multi-resolution signal decomposition method to extracting features and an adaptive neural fuzzy inference system (ANFIS) for identifying and classifying purposes. Similarly, wavelet transform and principal component analysis are employed for extracting and selecting features (Haghifam, M.-R.; Sedighi, A.-R.; Malik, 2006). Moreover, classification is carried out by fuzzy inference system and input membership functions are adjusted by a genetic algorithm. In (Abdel Aziz, Moustafa Hassan, & Zahab, 2011) the author uses (ANFIS) as a classifier to detect HIF. The 3rd harmonics, magnitude and angle, for the 3 phase currents are uses as features of HIF. And in (Saleem & Sharaf, 2008) a ‘feature’ or ‘diagnostic’ vector are formed by a group of foremost key harmonic signals, rather than a single dominant harmonic signal. In this paper, fast Fourier transform (FFT) is employed to extract the vector, which comprises the third and fifth harmonics of the voltage, current and power signals.
Fuzzy systems have two useful properties and capabilities: (i) potential of approximating any complex nonlinear system and (ii) model determination, through the input-output data (learning process). Fuzzy system is adaptive and depends on input output data rather than on a classical method, so the resulting scheme is valuable, efficient and capable of reflecting changes in high impedance fault behaviors. Takagi–Sugeno–Kang (TSK) (Tagaki, T., Sugeno, 1985)(Sugeno & Kang, 1988) fuzzy system is a more general class of fuzzy systems which is used in this paper. In this system, the resulting part is a crisp function.
Fuzzy Modeling Based On Subtractive Clustering:
Takagi, Sugeno and kang (TSK fuzzy system) has introduced fuzzy subtractive clustering system (Tagaki, T., Sugeno, 1985) (Sugeno & Kang, 1988). This model is fast, a one-pass algorithm, which is efficient in ascertaining the amount of the clusters and cluster centers in a set of data. The quantity of data points in the feature space and recognized regions in the feature space with huge quantity of data points form FS clustering. The center for a cluster is represented by the point and in accordance with the maximum number of neighbours. The data points in a pre-specified fuzzy radius are then confined (separated), and a new point, with the highest number of neighbours is searched by the algorithm. This process is continued until all the data points are inspected. A significant benefit for employing a subtractive method to identify rules is that, the resulting rules are heavily modified to the input data as against the fuzzy inference system, where they are created devoid of clustering. This minimizes the challenges of combinatorial explosion of rules, with high dimensional input data. The TSK fuzzy system is a efficient method to producing from a given input-output data set. This model comprises rules with fuzzy sets in the antecedents and crisp function (generally is a polynomial in the input variables) in the subsequent part. The TSK model contains of IF-THEN rules of the following form:
1 1 2 2 the MF and regression parameter in the kth rule, respectively. Initially, the rule extraction method employs the subtractive clustering function, to ascertain the amount of antecedent membership functions and rules; later it employs linear least squares estimation to establish the consequent equations of all the rules. This function retorts a FIS structure, which comprises a set of fuzzy rules to encompass the feature space (Chiu SL, 1994).
Assume a group of m data points in an N-dimensional space. The data points are normalized, without losing generalization. In this algorithm, a potential Pj is allotted to each data points zj= (xj, yj), based on its location to all other data points,
Pj represents the potential value i-data as a cluster center.
α is the weight between i-data to j-data.
ra is a positive constant known as cluster radius.
Subsequent to the calculation of the prospective of all the data points, the point with the maximum prospect is selected as the center for a cluster. Let x1 and P1* be the center of the first cluster and its potential value. The potential of each data point x1* is recalculated as follows:
*
Pi* is the potential value data as cluster center.
x1* is the cluster center of data. is the weight i- cluster center.
ri is the distance between cluster center.
η is a positive constant and is called the squash factor.
After recalculating the prospects of all data by (2), the data point with the maximum outstanding prospect is chosen as the second cluster center. Normally, after obtaining the kth
cluster center, the prospect of all the data points are recomputed as follows:
The process of acquiring new cluster center and recalculating potential repeats in relation to squash factor together with the accept ratio, reject ratio and influence range. A fraction of the potential of the first cluster center is set by the accept ratio, above which another data point will be accepted as a cluster center. However the potential is set by the reject ratio, as a fraction of the potential of the first cluster center, under which a data point will be rejected as a cluster center.
By the end of clustering, a adequate number of cluster centers and cluster sigma is produced. The initial number of rules and antecedent membership functions are determined by this information and then fuzzy inference system of TSK model is identified.
System Modeling:
A. Model of Distribution Feeder:
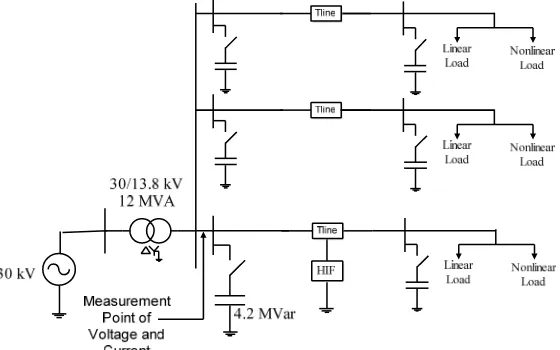
A 13.8 kV distribution feeder was performed in PSCAD/ EMTDC. This comprises a substation and three distribution feeders with radial network. The figure-1illustrates the schematic diagrams. The generator is of 30 kV and 10 MV connected to the transformer with 30/13.8 kV and 10 MV.
Fig. 2: Typical HIF fault currents (a) HIF current signal (linear load) (b) HIF current signal (nonlinear load)
The distribution network functions at 13.8 kV voltages. The linear and nonlinear loads with various loading conditions stimulate the networks. The nonlinear load is represented by 6-pulse rectifier. The selected sampling rate is 12.8 kHz.
The figure 2 above, illustrates the typical HIF fault current under linear and nonlinear loads. The fault occurs at 0.2 sec. The signal of HIF under linear loading condition comprises higher harmonic components assimilated with the signal before the fault (Fig. 2a). Thus, the distinguish HIF from other normal condition under linear loading condition is easy. However, in case of HIF under nonlinear loading condition, the signal before and during the HIF comprises higher harmonic components (Fig. 2b). Consequently, it becomes hard to differentiate HIF from other normal condition under nonlinear loading condition and this is a crucial problem in power distribution network. Additionally, it is mandatory to test the consistency of any HIF algorithm due to the transient phenomena produced by capacitor switching, which is similar to those of HIFs in frequency domain. Many of capacitor energisation events have been considered while studying the distribution system.
B. HIF Simulation:
In the past, several models of HIF have been proposed, based on Emanuel arc model. These models have been analyzed by researchers to select the best model for HIF. A simplified Emanuel model proposed in 2003 comprises two DC sources, Vp and Vn, which signify the beginning voltage of air in soil and/or between trees and the distribution line. The two varying resistors, Rp and Rn, were employed to signify the fault resistance, irregular values enables asymmetric fault currents to be simulated. The fault current flows towards the ground if the phase voltage is higher than the positive DC voltage Vp, however, when the line voltage is less than the negative DC voltage Vn, then the fault current reverses. For values of the phase voltage between Vn and Vp no fault current flows. The figure 3 illustrates a simplified two diode model of HIF (T. Lai, Snider, & Lo, 2003).
Fig. 3: Simplified two-diode fault model of a high-impedance faults.
Detection Algorithm:
The detection algorithm includes three important parts: data preparation, features generation and classification. Data preparation part is described in simulation section. The rest parts are described below.
A. Features Generation:
On the modeled distribution system, different operation conditions have been simulated by using PSCAD/ EMTDC. The simulated data then were transferred to MATLAB to complete the rest algorithm. The main goal of algorithm is to discriminate between HIFs and other similar waveforms.
1- The amplitude of third and fifth harmonics of current, voltage and power.(Type 1)
[I3 V3 P3 I5 V5 P5]
2- The ratio of third and fifth to the fundamental of current, voltage and power. (Type 2)
[I3/If V3/Vf P3/Pf I5/If V5/Vf P5/Pf]
3- The ratio of harmonics amplitude (2nd, 3rd, 5th, 7th, 9th and 11th) to the fundamental harmonic amplitude of current.(Type 3)
[I2/If I3/If I5/If I7/If I9/If I11/If]
Where If, Vf, and Pfare the fundamental of current, voltage and power. Features from HIF and other events signals of diverse operating conditions of the power distribution networks are extracted by a Fast Fourier Transform (FFT) method. After the process of fault inception, the features are extracted for 6 cycle fault current signal. The HIF and other events signals are generated from the designed power distribution models. The typical signals of HIF fault current, voltage and power under linear load and their spectrum is shown in Figs. 4a, b and c respectively.
The association among the features is illustrated in figure 5, of which few features are distinctive, while some are overlapped. The plots provide information related to the capability of the extracted features for classification in raw feature form, for using those features as inputs to the designed FS, for classifying HIF and other events. Hence the intelligent classification techniques based on neural classifier are employed to classify the HIF and other events with nonlinear load, from the above mentioned features.
a
b
c
Fig. 4: (a), (b) and (c) the typical signals of HIF fault current, voltage and power under linear load and their Spectrum
B. Classification:
explanation/interpretation. In short basically the cluster analysis identifies structures in data without explaining their existence.
Fuzzy Logic allows finding clusters in input-output training data. The cluster information is employed to produce a Sugeno-type fuzzy inference system, which effectively models the data behaviour with few rules. The rules divide themselves based on the fuzzy qualities related with each of the data clusters
In this study, subtractive clustering fuzzy logic is used as the classifier to serve for the fuzzy classification. Six extracted features are employed to produce fuzzy inference system.
a b
Fig. 5: Feature plots for first types of feature (a) Feature F2 against F3 (b) Feature F4 against F6.
Simulation:
A. Data Preparation:
Building a fuzzy inference system with fuzzy subtractive (FS) involves two steps: A) Clustering Data Preparation and,
B) Rules generation.
A) Clustering Data Preparation for FS
Generating a FS clustering-based fuzzy inference system needs to divide the training data into two data sets: a) An input data set which has values for the six inputs [F1, F2, F3, F4, F5, F6] represent either the amplitude of third and fifth harmonic of current, voltage and power, the ratio of third and fifth to the fundamental of current, voltage and power or the ratio of harmonics amplitude (2nd, 3rd, 5th, 7th, 9th and 11th) to the fundamental harmonic amplitude of current. 1440 input data points were selected from frequency domain of current, voltage and power signals. These points were placed into a single input data set.
b) An output data set which has values for the one output (1 or 0). The output of FIS either 1 for high impedance fault occurs or zero for other normal event in power system. 1440 output data points, related to the chosen input points. These points were placed into a single output data set.
The remaining 160 input and output data points, which are dissimilar from the training data, will be employed for the purpose of testing.
B) Rules Generation for FS
The cluster centers in a set of data are estimated by the fuzzy subtractive clustering algorithm. Each data point is assumed as a potential cluster center by the algorithm and a level of the probability is calculated that each data point would define the cluster center, based on the density of neighboring data points. The algorithm has three important steps:
1) The data point with the highest potential to be the first cluster center is chosen.
2) All data points from the first cluster center region are removed (as determined by radii) , for determining the next cluster and its center location
3) These steps are repeated until all of the data is within radii of a cluster center.
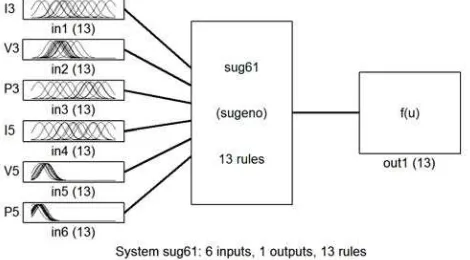
The least squares method of this function functions on the subsequent part of the fuzzy inference system, particularly on the consequent equations that are generated. Figure 6 shows the architecture of the subtractive clustering fuzzy system with feature type 1.
Fig. 6: The architecture of the subtractive clustering fuzzy system with feature type 1
B. Results:
The first order TSK fuzzy approach, which depends on the subtractive clustering, has been employed in this study, to detect high impedance fault. The process of model building using subtractive clustering was carried out by making of clusters in the data space and translation of these clusters into TSK rules.
There have been 1440 training cases which were selected to train the network. The training sets included 360 HIF cases and the rest are non fault cases. The subtractive clustering fuzzy system has one output, the output is one when the system detect HIF case and is zero when other cases. Three types of feature are investigated. Different combinations of inputs are used to train and test fuzzy subtractive, to test the influence on classification rate. The classification rates are computed on the training and testing data sets.
The HIF classification rate of fuzzy subtractive using three types of features from FFT is illustrated in the figure 6. The y-axis of the fig.7 shows the percentage HIF classification, and x-axis shows the training and testing for three types feature.
Fig. 7: Classification rate of fuzzy subtractive with three types feature
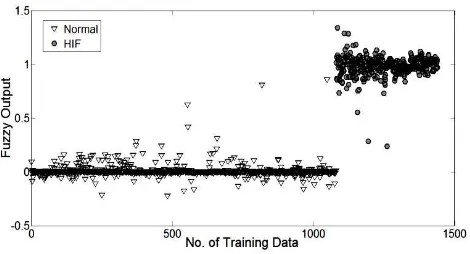
Fig. 8: Fuzzy subtractive response to training data
To evaluate the suitability of proposed algorithm, test data cases were fed to the FS and the obtained output is shown in Fig. 9. It shows that the proposed method could classify different input categories successfully and reliably. It is found that the proposed algorithm is capable to categorize 100% in case of HIF testing and 98.33% for non HIF testing cases. The classification rate over all cases is 98.75 and the RMSE value of the model of training case is 0.0566. Results of the testing phase, which demonstrates that the algorithm is reasonably reliable.
Fig. 9: Fuzzy subtractive response to testing data
Furthermore, three goals are selected to validate the method of HIF detection. The first objective is to identify the influence of input feature sets of training data, which are used to be input vector to train the fuzzy subtractive. The second objective is to examine the impact of percentage input training set on the classification rate performances of the fuzzy subtractive. The third objective is to evaluate the performances of classification of the fuzzy subtractive with the algorithm in (Samantaray, S.R., Panigrahi, B.K., Dash, 2008)
C. The Impact Of Input Feature Sets:
Various feature sets are investigated to study the impact of input feature set on the classification rate of the fuzzy subtractive. Table-1 illustrates these sets, whereas the table 2 tabulates the classification rate of the proposed method for each of the sets.
Table1: Input Feature Set Types
Feature type No. of feature
FS1 [ I3, V3, P3, I5, V5, P5] 6
FS2 [I3, V3, I5, V3] 4
FS3 [I3, P3, I5, P5] 4
Table 2: The Classification Rate Of Input Feature Set Types
Feature set RMSE Classification rate for training set Classification rate for testing set
FS1 0.0697 98.81 98.75
FS2 0.1828 86.87 85.62
It is evident that generally the FS1feature sets contain more selective information as against other feature sets, as exposed in average classification rate. Also, it can be concluded that the features of the FS1 has shown good results. Fig. 10 shows the classification rate for the different feature set.
Fig. 10: Classification rate of fuzzy subtractive different feature set.
D. The Effect Of Number Training Data:
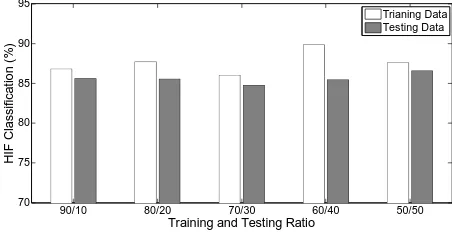
The proposed fuzzy subtractive is trained and tested with 1600 stimulated cases. Various combinations of inputs are used to test the fuzzy subtractive, to test the impact on classification rate. The classification rates are calculated on the training and testing data sets. In this stage, the fuzzy subtractive is trained with different number of training data set to get the best classification rate of the fuzzy subtractive. Figs. 11 shows the HIF classification rate of fuzzy subtractive with input training data set (FS1) that has different number of training data. The maximum classification rate is 98.81% and 98.75% for training and testing data, respectively with 90% of training data and classification rate is reduced with others percentage training data.
Fig. 11: Classification rate of fuzzy subtractive with FS1
Fig. 12-13 show the effect the percentage of training data on the classification rate with input training data set (FS2, FS2)
90/10 80/20 70/30 60/40 50/50
70 75 80 85 90 95
Training and Testing Ratio
HI
F
Cla
s
si
fi
c
a
ti
o
n
(
%
)
Trianing Data Testing Data
90/10 80/20 70/30 60/40 50/50
Fig. 13: Classification rate of fuzzy subtractive with FS2
E. Evaluating The Proposed Algorithm:
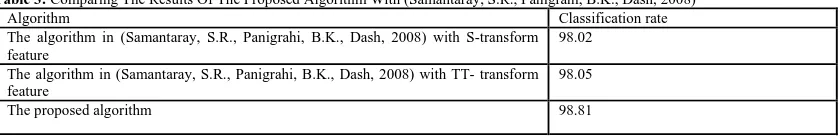
The final study is performed to compare the performances of the proposed algorithm, with the algorithms in (Samantaray, S.R., Panigrahi, B.K., Dash, 2008). In (Samantaray, S.R., Panigrahi, B.K., Dash, 2008), the feature generation module is based on S-transform and TT- transform, and in the decision-making module, the probabilistic neural network is applied. The results are given in Table 3, where the proposed algorithm outperforms algorithm in (Samantaray, S.R., Panigrahi, B.K., Dash, 2008) in classification rate.
Table 3: Comparing The Results Of The Proposed Algorithm With (Samantaray, S.R., Panigrahi, B.K., Dash, 2008)
Algorithm Classification rate
The algorithm in (Samantaray, S.R., Panigrahi, B.K., Dash, 2008) with S-transform feature
98.02
The algorithm in (Samantaray, S.R., Panigrahi, B.K., Dash, 2008) with TT- transform feature
98.05
The proposed algorithm 98.81
Discussion:
A qualitative comparison was made among three types of features for HIF detection in power distribution feeder, in the proposed algorithm. Based on the outcomes, it was found that the feature of type1 provides better results compared with other features. The classification rate for radial distribution network is 98.81% for feature of type1compared with 91.4% and 85.41for both features of type3 and type 2, respectively. Also with using 90% training and 10% testing data sets to train and test the fuzzy subtractive has given a good classification rate result.
Conclusions:
This study has presented the fuzzy subtractive clustering for HIF detection and classification. An effort has been made to classify the HIF from other event in distribution system under linear and nonlinear loads. In this paper, the harmonic of current, voltage and power of the HIF and other events current and voltage signals were extracted using FFT and different features like (type1, type2 and type3) were computed and used to train and test the fuzzy subtractive clustering for HIF classification. HIF classification rate is more than 98%, obtained from fuzzy subtractive clustering with using 3rd and 5th harmonic of current, voltage and power feature. Ultimately, the proposed approach is quick and precise in identifying HIF and can be extended to guard huge power distribution networks.
ACKNOWLEDGEMENTS
The authors wish to record the utmost appreciation the Faculty of Electrical Engineering, UTeM for providing the required research facilities for this research.
REFERENCES
Abdel Aziz, M.S., M.a. Moustafa Hassan, & E.a. Zahab, 2011. Applications of ANFIS in high impedance faults detection and classification in distribution networks. 8th IEEE Symposium on Diagnostics for Electrical Machines, Power Electronics & Drives, 612–619. doi:10.1109/DEMPED.2011.6063687
Chiu, S.L., 1994. Fuzzy Model Identification Based On Cluster Estimation. journal of intelligent and fuzzy systems, 2: 267-278.
Emanuel, A.E., D. Cyganski, J.A. Orr, S. Shiller, E.M. Gulachenski, 1990. High impedance fault arcing on sandy soil in 15 kV distribution feeders: contributions to the evaluation of the low frequency spectrum. IEEE
Trans. Power Delivery, …, 5(2), 676–686. Retrieved from
http://ieeexplore.ieee.org/xpls/abs_all.jsp?arnumber=53070
Etemadi, A., & M. Sanaye-Pasand, 2008. High-impedance fault detection using multi-resolution signal decomposition and adaptive neural fuzzy inference system. Generation, Transmission & …, 2(1), 110–118. doi:10.1049/iet-gtd
Ghaffarzadeh, N., & B. Vahidi, 2010. A New Protection Scheme for High Impedance Fault Detection using Wavelet Packet Transform. Advances in Electrical and Computer Engineering, 10(3), 17–20. doi:10.4316/aece.2010.03003
Haghifam, M.-R., A.-R. Sedighi, O.P. Malik, 2006. Development of a fuzzy inference system based on genetic algorithm for high-impedance fault detection. Generation, Transmission & …, 153(3): 359-367. doi:10.1049/ip-gtd
Kwon, W., & G. Lee, 1991. High impedance fault detection utilizing incremental variance of normalized even order harmonic power. IEEE Trans. Power Deliv, 6(2): 557–564. Retrieved from http://ieeexplore.ieee.org/xpls/abs_all.jsp?arnumber=131112
Lai, T.M., L.a. Snider, E. Lo, & D. Sutanto, 2005. High-Impedance Fault Detection Using Discrete Wavelet Transform and Frequency Range and RMS Conversion. IEEE Trans. Power Deliv, 20(1): 397-407. doi:10.1109/TPWRD.2004.837836
Lai, T., L. Snider, & E. Lo, 2003. Wavelet transform based relay algorithm for the detection of stochastic high impedance faults. International Conference on Power Systems Transients, 1(1): 1-6. Retrieved from http://www.sciencedirect.com/science/article/pii/S0378779605002816
Lai, L.L., E. Styvaktakis, A.G. Sichanie, 1998. Application of discrete wavelet transform to high impedance fault identification. Proc. Int. Conf. Energy Management and Power Deliveivery, 689-693. Retrieved from http://ieeexplore.ieee.org/xpls/abs_all.jsp?arnumber=702772
Lazkano, A., J. Ruiz, E. Aramendi, J.A. Gonzalez, 2000. Study of high impedance fault detection in levante area in Spain. Proc. Int. Conf. Harmonics and Quality of power, 1011–1016. Retrieved from http://ieeexplore.ieee.org/xpls/abs_all.jsp?arnumber=896867
Lien, K.Y., S.L. Chen, C.J.L. Tzong, Y. Guo, T.M. Lin, S. Shen, 1999. Energy variance criterion and threshold tuning scheme for high impedance fault detection. IEEE Trans. Power Deliv, 14(3): 810-817. doi:10.1109/61.772319
SEDIGHIZADEH1, M., A. REZAZADEH2, N.I.E. 2010. Approaches in High Impedance Fault Detection - A Chronological Review. Advances in Electrical and Computer Engineering, 10(3): 114-128. doi:10.4316/aece.2010.03019
Michalik, M., M. Lukowicz, W. Rabizant, S.J. Lee, S.H. Kang, 2008. New ANN-based algorithms for detecting HIFs in multigrounded MV networks. IEEE Trans. Power Deliv, 23(1): 58-66. Retrieved from http://ieeexplore.ieee.org/xpls/abs_all.jsp?arnumber=4385728
Russell, B.D., K. Mehta, R.P. Cinchali, 1988. An arcing fault detection technique using low frequency current components performance evaluation using recorded field data. IEEE Trans. Power Deliv, 3(4): 1493-1500.
Saleem, S., & A. Sharaf, 2008. A fuzzy ARTMAP based high impedance arc fault detection scheme.
Electrical and Computer Engineering,2008. CCECE 2008. Canadian Conference on (pp. 871–876). Retrieved from http://ieeexplore.ieee.org/xpls/abs_all.jsp?arnumber=4564660
Samantaray, S.R., B.K. Panigrahi, P.K. Dash, 2008. High impedance fault detection in power distribution networks using time-frequency transform and probabilistic neural network. IET Generation, Transmission & Distribution, 2(2): 261-270. doi:10.1049/iet-gtd
Sedighi, A.R., M.R. Haghifam, O.P. Malik, M. Ghassemian, 2005. High impedance fault detection based on wavelet transform and statistical pattern recognition. IEEE Trans. Power Deliv, 20(4): 2414-2421. Retrieved from http://ieeexplore.ieee.org/xpls/abs_all.jsp?arnumber=1514486
Sugeno, M., & G.T. Kang, 1988. Structure identification of fuzzy model. Fuzzy Sets and Systems. Fuzzy Sets and Systems, 28(1): 15-33.