RUBBER TIRE DUST-RICE HUSK PYRAMIDAL MICROWAVE ABSORBER
F. Malek1, E. M. Cheng2, O. Nadiah3, H. Nornikman3, *, M. Ahmed3, M. Z. A. Abd Aziz4, A. R. Osman4, P. J. Soh3, A. A. H. Azremi3, A. Hasnain5, and M. N. Taib6
1School of Electrical System Engineering, Universiti Malaysia Perlis
(UniMAP), Taman Seberang Jaya Fasa 3, Kuala Perlis 02000, Perlis, Malaysia
2School of Mechatronic Engineering, Universiti Malaysia Perlis
(UniMAP), Ulu Pauh Campus, Arau 02600, Perlis, Malaysia
3School of Computer and Communication Engineering, Universiti
Malaysia Perlis (UniMAP), Taman Seberang Jaya Fasa 3, Kuala Perlis 02000, Perlis, Malaysia
4Faculty of Electronic and Computer Engineering, Universiti Teknikal
Malaysia Melaka (UTeM), Hang Tuah Jaya, Durian Tunggal 76100, Melaka, Malaysia
5Faculty of Electrical Engineering, Universiti Teknologi MARA Pulau
Pinang, Permatang Pauh, Pulau Pinang, Malaysia
6Faculty of Electrical Engineering, Universiti Teknologi MARA Shah
Alam, Shah Alam 40450, Selangor, Malaysia
Abstract—Rubber tire dust-rice husk is an innovation in improving the design of pyramidal microwave absorbers to be used in radio frequency (RF) anechoic chambers. An RF anechoic chamber is a shielded room covered with absorbers to eliminate unwanted reflection signals. To design the pyramidal microwave absorber, rice husk will be added to rubber tire dust since the study shows that both have high percentages of carbon. This innovative material combination will be investigated to determine the best reflectivity or reflection loss performance of pyramidal microwave absorbers. Carbon is the most important element that must be in the absorber in order to help the absorption of unwanted microwave signals. In the commercial
Received 8 April 2011, Accepted 13 June 2011, Scheduled 17 June 2011
market, polyurethane and polystyrene are the most popular foam-based material that has been used in pyramidal microwave absorber fabrication. Instead of using chemical material, this study shows that agricultural waste is more environmentally friendly and has much lower cost. In this paper, three combinations of rubber tire dust and rice husk are fabricated to investigate the performance of microwave absorber reflection loss in operating in the frequency range from 7 GHz to 12 GHz.
1. INTRODUCTION
Every year, tire rubber is dumped into landfills. These wastes are non-environment friendly and hazardous to animals, soil, and community [1]. Several studies have examined various applications of recycled tire rubber in order to reduce the waste at landfills. In the United Kingdom, about 40 million tires are disposed as waste every year [2]. The increasing number of vehicles on the road worldwide will continue to increasing this waste, which will affect the environment because rubber is not easily bridgeable material and because it produces hazardous chemicals. Old tires at landfills can hold water for long periods, providing breeding sites for mosquito larvae [3]. Rainwater in tires can cause bad smells and environmental pollution [4]. Many countries have banned landfills from accepting rubber tire waste.
The advantages of rubber tire material are its lightweight, elastic, energy absorption, and sound- and heat-insulating properties [5]. Many researchers have used this material in their research in such areas as rubberized concrete [6–8], athletic facilities like jogging tracks and playgrounds [9], and synthetic reefs in marine environments [10]. This material contains carbon as its major element.
microwave absorbers are typically manufactured by impregnating conductive carbon into a foamed plastic medium. Polyurethane and polystyrene are the most popular foam-based material used in the fabrication of pyramidal microwave absorbers.
Agriculture waste has also been investigated to build microwave absorbers. Agriculture waste, also known as biomaterial, such as rice husks and banana leaves, is environmentally friendly material that has great potential to be fabricated as microwave absorbers. If these biomaterials can be used wisely, the amount of industrial waste will be reduced, perhaps leading to a reduction in environmentally harmful emissions. Hence, rice husk has been investigated as an alternative to the current material in order to design a low-cost microwave absorber. Rice husks consist of 92–95 percent silica, are highly porous and lightweight, and have a very high external surface area. Rice husks’ absorbent and insulating properties are useful for many industrial applications [13]. For example, rice husks have been used in biomass fuels to generate power and in concrete mixtures in building construction [14–16]. Recently, rice husks have been investigated as potential materials for the pyramidal microwave absorbers [17]. The large percentage of carbon that occurs naturally in the rice husks has the potential to provide good reflection loss performance for the microwave absorbers [18].
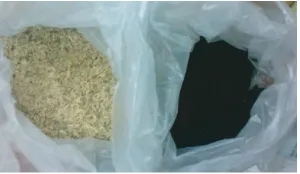
Figure 1. Example of waste: Rice husk and carbon black from rubber tire dust.
Pyramidal microwave absorber = 13cm of height Base part of
pyramidal = 2cm of thickness
Boundary
Source signal (Waveguide port)
= 30cm from the tips of the
absorber
Figure 2. Simulation setup for pyramidal microwave absorber using CST microwave studio.
2. SIMULATION OF THE PYRAMIDAL MICROWAVE ABSORBER
Figure 2 shows the simulation setup of the rubber tire dust-rice husk pyramidal microwave absorber. The source signal is located in the direct path of the pyramidal microwave absorber. The set-up of this design is based on [19].
In the current work, the microwave absorbers are designed using Computer Simulation Technology Microwave Studio (CST MWS) simulation software. The design of the pyramidal absorber design shape in this work is based on the commercially available Eccosorb
VHP-8-NRL Pyramidal Microwave Absorber [20] and TDK ICT-030
Pyramidal Microwave Absorber [21]. The pyramidal shape has two main parts: the first part is the base part with a 5 cm length × 5 cm
length×2 cm thickness or height, and the second part is the pyramid
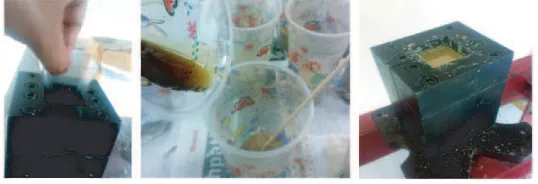
Figure 3. Development of rubber tire dust-rice husk pyramidal microwave absorber.
3. DEVELOPMENT OF PYRAMIDAL MICROWAVE ABSORBER
RF absorbers are one of the main components that are installed at the wall and floor of the anechoic chamber — sometimes called the “quiet room”. This equipment has been used to eliminate reflected signals. The microwave frequency range absorber is operates in the frequency range of 1–40 GHz. There have been many investigations of the RF absorbers [27–33].
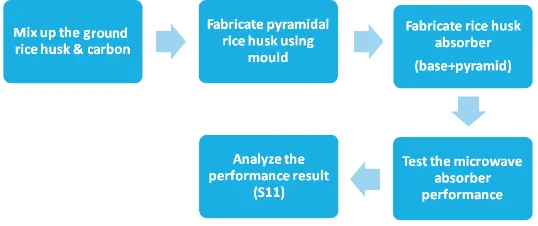
Figure 3 shows the development of the pyramidal microwave absorber. First, the ground rice husks are added to rubber tire dust (carbon black) using polyester as a bonding agent and methyl ethyl ketone peroxide (MEKP) as a hardener agent. Resins or bonding agents are used to glue the adjacent material particles and layers when fabricating using agricultural wastes, while MEKP is a colorless, oily liquid at room temperature. The mixture was fabricated into a pyramidal shape with a square base. The next step was to test the reflection loss performance of the pyramidal microwave absorber. Finally, the performance results of three different percentages of rubber tire dust and rice husks were analyzed.
Figure 4. The mixture of 75 percent rubber tire dust and 25 percent rice husks (Mixture C).
Figure 5. Fabrication process of the pyramidal microwave absorber.
Table 1. Rubber tire dust and rice husk ratios.
Rubber tire dust-rice husk mixture
Percentage (%) Rubber tire dust Rice husk
Mixture A 25 75
Mixture B 50 50
MixtureC 75 25
4. PRINCIPLE OF COAXIAL LINE
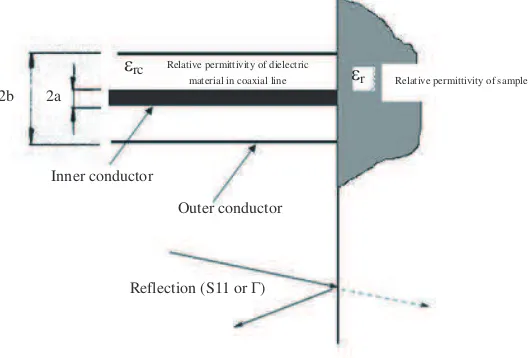
The open-ended coaxial probe is a cut off section of transmission line. The material is measured by immersing the probe into a liquid or touching it to the flat face of a solid (or powder) material. The fields at the probe end “fringe” into the material and change as they come into contact with the materials under test (MUT), as shown in Figure 6. The reflected signal (S11) can be measured and is related to εr*.
The open end of the coaxial line is terminated by a semi-infinite sample on a ground plane. In general, the medium between the conductors is filled by free space or lossless materials such as Teflon (PTFE). The application is based on the principle that a reflected signal through the coaxial opening will carry the desired information about the material sample at terminal surface. Thus, if the aperture admittance or reflection coefficient characteristics can be precisely formulated then, it can be used as a probe for the characterization of material samples.
The radii of inner and outer conductors,a and b(Figure 6) obey the inequality a, b ≪ λ0
√
εr, G(εr). G(εr) (Figure 7) is the radiation
conductance; Cf is the capacitance of the fringing field in the coaxial
line; and C(εr) is the capacitance of the field in the sample with εr. BothCandGare the function ofεr, which depends on the permittivity of the sample. Meanwhile, Cf,C andG(conductance) depend on the dimensions of the coaxial line such as the radius of inner conductor,
Inner conductor
Outer conductor
Reflection (S11 or Γ) Relative permittivity of dielectric
material in coaxial line εrc
εr Relative permittivity of sample 2a
2b
Cf
C(εr)
G(εr)
Figure 7. Equivalent circuit for the open-ended coaxial sensor.
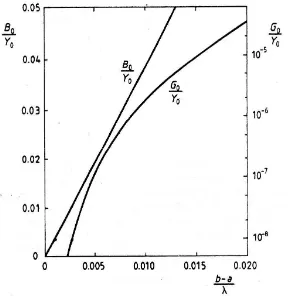
Figure 8. The end susceptance (B0) and conductance (G0) of an
open-ended coaxial line in air. The characteristic admittance of the line isY0 [46].
a, and the radius of outer conductor,b, as well as permittivity of the dielectric filling the line. Cf,C0 andG0 in free space can be obtained
through [47]. The total end capacitanceCT (CT =Cf+C0for the case
in air) andCf can be obtained numerically [48] or simply measured [49].
Besides that, it can also be determined approximately through quasi-static analysis [50, 51]. The total capacitance,CT (=B0
ω ), and radiation
conductance, G0, in air can be predicted using Figure 8 [52]. Cf and
G0 can be neglected at first approximation [46]. When the sensor is
contacted with the sample, the permittivity of the sample changes the end capacitance and it gives the load admittance as
Y =G+jB (1)
whereG andB are conductance and susceptance, respectively. Then, the reflection coefficient is given by
Γ =−Z0+ 1/[jωC0(ε′r−jε′′r)]
Z0+ 1/[jωC0(ε′r−jε′′r)]
(2)
The cross section of coaxial line is illustrated in Figure 9. It is a common two-conductor transmission system and widely used at frequencies below about 5 GHz [53]. It is possible to use up to 20 GHz if specially constructed coaxial lines are used. The dielectric filling used in most microwave applications is Polytetrafluoroethylene (PTFE) or Teflon.
The accuracy of the dielectric probe in reflection measurement of material can be verified by carrying out the error analysis. Some known dielectric material such as propanol, methanol, ethanol and water are used in the verification. These known complex permittivities for known materials are applied in the simulation using FEMLAB. The error analysis has been conducted and tabulated in Table 2 [54]. The percentage of error that is indicated in Table 2 show less than 4%, which indicates a good dielectric probe used in reflection measurement.
Figure 9. Coordinate system and dimensions for a coaxial line [55].
Table 2. Error analysis upon the performance of dielectric probe in reflection measurement.
Known material
Using measured εr obtained from commercial HP probe
in Finite Element Method (FEM) simulations
Using calculatedεr
obtained from literatures in FEM simulation
¯ ¯ ¯
ΓMeasured−ΓFEM
ΓMeasured
¯ ¯
¯×100%
¯ ¯ ¯
ΓMeasured−ΓFEM
ΓMeasured
¯ ¯
¯×100%
Propanol ∼1.7% ∼2.9%
Ethanol ∼1.4% ∼3.7%
Methanol ∼2.2% ∼2.8%
5. DEFINING THE DIELECTRIC PROPERTIES
Dielectric properties measurement is an important factor in defining the physical and chemical properties that are related to storage and loss energy in respect to different kinds of materials. The dielectric constant is equivalent to relative permittivity (εr), or the absolute permittivity (ε) is relative to the permittivity of free space (ε0) [56–65]. The
dielectric constant of a material also affects the velocity of microwave signals when it moves through the material. A high dielectric constant makes the microwave signal travel more slowly. In other words, the velocity will decrease [66] because a higher dielectric constant means a denser material. The dielectric constant value depends on what material is applied to the design application. Every material has a unique set of electrical characteristics that are dependent on the electromagnetic properties of many dielectric and magnetic materials. There are many mechanisms which can change the dielectric properties of a material.
The real part of the permittivity, ε′, termed dielectric constant,
determines the amount of electrostatic energy stored per unit volume in a material. The imaginary component of the permittivity,ε′′, is called
loss factor and governed by the lag in polarization upon application of the field and the energy dissipation in association with charge polarization. This energy loss appears as an attenuation of the applied field and is usually measured relative to the dielectric constant in terms of the loss tangent, tanδ. In terms of an electric circuit, tanδrepresents the resistive part of the impedance and is directly proportional to the electrical conductivity. Loss tangent refers to the dissipation of power or energy from incident waves. A very important element in microwave absorption, the loss tangent, transforms incoming microwave energy into heat. The overall losses based on dissipation usually involve the influence of permittivity and conductivity of the materials [67–75]. The formula on loss tangent, tanδ is shown as
tanδ = εr
′′
ε′
r
(3)
where ε′
r = real part component of permittivity and ε′′r = imaginary
component of permittivity.
The most commonly used theoretical model for calculating the complex permittivity is the dielectric mixture model. The dielectric mixture is described in terms of the fractional volume and permittivity of each constituent. Here, the Lichtenecker’s dielectric mixture model is proposed [76].
lnε∗ =v
The symbol used in the Lichtenecker’s dielectric mixture model applies to two component mixtures, which represent the complex permittivity of the mixture. ε1 is the permittivity of medium 1, and ε2 is the
permittivity of medium 2. The v1 and v2 are the fractional volume of
the respective components, wherev1+v2 = 1 is the mixture of rubber
dust and rice husk.
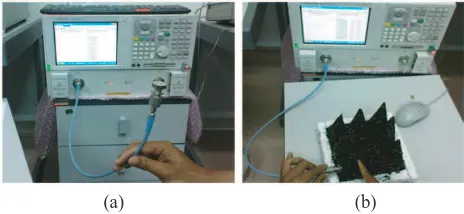
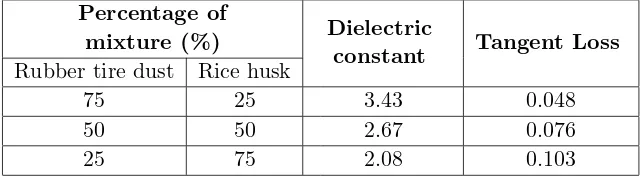
At microwave frequencies, different measurement techniques can be used, including the free space measurement technique, the resonant cavity technique, the transmission line technique, and the dielectric probe technique [77]. This work uses the Agilent dielectric probe technique with Agilent Technologies 85070 measurement software to define the dielectric constant and tangent loss. The 85070E has a frequency range of 200 MHz to 20 GHz. This dielectric probe features a hermetic glass-to-metal seal, which makes it resistant to corrosive or abrasive chemicals [78]. Figure 10(a) shows the configuration of the Agilent dielectric probe. First, the dielectric probe is connected to the network analyzer using a coaxial cable. Figure 10(b) shows how the dielectric constant was defined. Dielectric constant for the 50% rubber tire dust−50% rice husk mixture is measured by using the PNA
network analyzer from Agilent Technologies with the probe attached. Next will be the 25% rubber tire dust −75% rice husk mixture, and
last the 75% rubber tire dust−25% rice husk mixture.
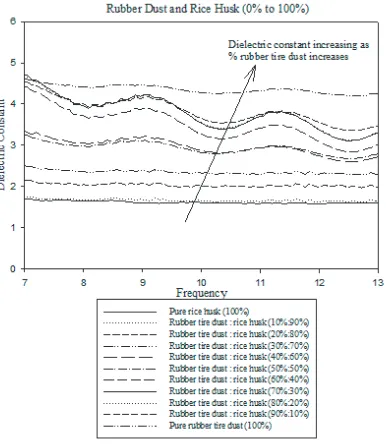
The dielectric constant and tangent loss for three different compositions of mixture of rice husks and rubber tire dust are as shown in Table 3 and Figure 11. Figure 12 shows the variation of dielectric constant with frequency for different percentage of mixture rubber tire dust and rice husk. It can be observed that the dielectric constant increases with the percentage of rubber tire dust in the mixture. The
(a) (b)
Figure 10. (a) Calibrating the probe using a network analyzer with Agilent Technologies 85070 measurement software. (b) Defining the dielectric constant (real part, ε′
r and imaginary part, ε′′r) of the
Table 3. Dielectric properties for different ratios of rubber tire dust and rice husk.
Percentage of
mixture (%) Dielectric
constant Tangent Loss Rubber tire dust Rice husk
75 25 3.43 0.048
50 50 2.67 0.076
25 75 2.08 0.103
The variation of Dielectric Constant for Different Composition of Rubber Tire Dust-Rice Husk Mixture
Frequency, GHz
7 8 9 1 0 1 1 1 2
Di
elect
ri
c cons
tant
1.5 2.0 2.5 3.0 3.5 4.0
75% Rubber Tire Dust, 25% Rice Husk 50% Rubber Tire Dust, 50% Rice Husk 25% Rubber Tire Dust, 75% Rice Husk
Figure 11. The dielectric constant, εr of different ratios of rubber
tire dust and rice husk for the pyramidal microwave absorber.
Figure 12. The dielectric constant of different percentage mixture of rubber tire dust and rice husk (0% to 100%).
Frequency, GHz
7 8 9 1 0 1 1 1 2
Ta
ng
en
t
lo
ss
0. 02 0. 04 0. 06 0. 08 0. 10 0. 12 0. 14 0. 16 0. 18
75% Rubber Tire Dust, 25% Rice Husk, 50% Rubber Tire Dust, 50% Rice Husk 25% Rubber Tire Dust, 75% Rice Husk
Figure 13. The calculated tangent loss, tanδ, using Lichtenecker’s dielectric mixture model for different ratios of rubber tire dust and rice husk for the pyramidal microwave absorber.
6. MEASUREMENT OF REFLECTION LOSS
Frequency, GHz
7 8 9 10 11 12 13
Ta
ng
ent
lo
ss
0. 00 0. 05 0. 10 0. 15 0. 20
pure rubber tire dust pure rice husk
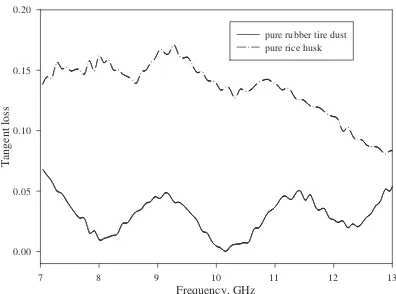
Figure 14. The measured tangent loss, tanδ, for pure rubber dust and rice husk.
from 7–13 GHz at increments of 0.25 GHz. The requirement for a good microwave absorber performance is that it has reflection loss results better than−10 dB, which indicates that the efficiency of the absorbing
performance is 90 percent. In general, the absorber reflection loss required to achieve a specific chamber performance varies with the size and shape of the shielded enclosure.
Radar Cross Section is defined as the area that can be perfectly reflected back when an electromagnetic wave is transmitted from its source to its target position. Radar is a method of determining the presence, location, velocity, and other characteristics of a target through the use of equipment that operates at microwave frequencies by radar and is reflected from the target/object back to the radar [79]. The equipment used was an AgilentE8362B PNA network Analyzer; two 10 m coaxial cables, a pair of horn antennas for transmitting and receiving, reference metal (reference RCS target), and a tripod for holding the horn antennas and reference metal [80]. The angle between the horn antennas and the pyramidal microwave absorber was 60◦. The
distance between horn antennas and pyramidal microwave absorber was 1 meter. Figure 15 shows the RCS measurement setup.
For the measurement, nine pieces of pyramidal microwave absorbers are located at the reference metal with area of 15 cm2. Six
Network
analyzer
Spectrum
analyzer
Reference metal Pyramidal
microwave absorber Antennas
Coaxial
cables
Figure 15. Reflection loss measurement setup using the Radar Cross Section (RCS) technique.
Figure 16. Six points on the pyramidal microwave absorber (PointA
to Point F).
Table 4. Location of the ten points for the RCS method.
Point Name Point Location
A Highest peak
B Between two peaks
C Among four peaks
D Between the highest and lowest peak points
E The side of the absorber
F Random point
7. RESULTS AND DISCUSSION
Reflection Loss of Different Point Location for fabricated Rubber Tire Dust-Rice Husk (75:25) Pyramidal Microwave Absorber
Frequency, GHz
7 8 9 10 11 12 13
Re
fl
ec
tion Lo
ss
,
dB
-100 -80 -60 -40 -20 0
Point A Point B Point C Point D Point E Point F
Figure 17. Reflection loss of different point locations for fabricated rubber tire dust-rice husk (75 : 25) pyramidal microwave absorber.
Reflection Loss of Different Point Location for fabricated Rubber Tire Dust-Rice Husk (50:50) Pyramidal Microwave Absorber
Frequency, GHz
7 8 9 10 11 12 13
Re
flection Loss, dB
-100 -80 -60 -40 -20 0
Point A Point B Point C Point D Point E Point F
Figure 18. Reflection loss of different point locations for the fabricated rubber tire dust-rice husk (50 : 50).
reflection loss of different point locations for fabricated rubber tire dust-rice husk pyramidal microwave absorber. The reflection loss values in increments of 0.25 GHz for the frequencies from 7.0 to 13.0 GHz are obtained.
Figure 17 and Table 5 show the measurement results of the reflection losses of the fabricated rubber tire dust-rice husk (75 : 25) pyramidal microwave absorber at different location points. The reflection loss results obtained are in the range of−19.0 dB to−35.0 dB
pyramidal microwave absorber
Reflection Loss of Different Point Location for fabricated Rubber Tire Dust-Rice Husk (25:75) Pyramidal Microwave Absorber
Frequency, GHz
7 8 9 10 11 12 13
Re
flection Loss
,
dB
-100 -80 -60 -40 -20 0
Point A Point B Point C Point D Point E Point F
Figure 19. Reflection loss of different point locations for the fabricated rubber tire dust-rice husk (25 : 75) pyramidal microwave absorber.
Table 5. Reflection loss of dielectric point locations for fabricated rubber tire dust-rice husk (75 : 25) pyramidal microwave absorber.
Frequency (GHz)
Reflection Loss of Different Point Locations (dB)
A B C D E F
7 −27.74 −22.37 −21.13 −26.53 −20.37 −23.28
8 −29.07 −24.74 −23.08 −31.89 −21.64 −28.65
9 −34.89 −25.13 −24.71 −28.91 −19.13 −30.18
10 −34.70 −27.67 −27.67 −33.57 −20.65 −33.61
11 −34.64 −28.54 −27.18 −30.54 −20.63 −31.94
12 −34.35 −28.42 −28.01 −28.07 −18.66 −30.17
13 −32.16 −31.23 −29.79 −28.14 −19.05 −28.37
Average
(7 to 13) −32.51 −26.87 −25.94 −29.66 −20.02 −29.48
dust-rice husks pyramidal microwave absorbers, the highest average reflection loss result is achieved at PointAwith−32.51 dB, while point E shows the lowest reflection loss result with −20.02 dB. Figure 18
Table 6. Reflection loss of dielectric point locations for the fabricated rubber tire dust-rice husk (50 : 50) pyramidal microwave absorber.
Frequency (GHz)
Reflection Loss of Different Point Locations
A B C D E F
7 −14.43 −19.37 −19.84 −26.22 −22.26 −18.96
8 −18.67 −29.44 −26.36 −30.46 −25.22 −27.13
9 −19.38 −23.48 −23.94 −30.28 −28.02 −21.24
10 −24.27 −34.09 −30.28 −32.79 −31.56 −27.29
11 −30.29 −33.51 −32.00 −41.56 −37.80 −34.59
12 −23.11 −31.03 −32.67 −30.99 −25.50 −26.12
13 −24.06 −26.96 −29.64 −30.28 −28.57 −27.25
Average
(7 to 13) −22.03 −28.29 −27.82 −31.80 −28.42 −26.08
Table 7. Reflection loss of dielectric point locations for the fabricated rubber tire dust-rice husk (25 : 75) pyramidal microwave absorber.
Frequency (GHz)
Reflection Loss of Different Point Location
A B C D E F
7 −21.54 −16.01 −15.07 −19.25 −13.74 −15.04
8 −19.87 −16.51 −15.84 −20.29 −15.03 −17.82
9 −22.60 −18.91 −13.88 −20.94 −13.86 −18.16
10 −22.84 −19.29 −20.30 −25.63 −14.78 −22.98
11 −23.33 −14.10 −19.35 −23.74 −16.47 −14.72
12 −20.79 −14.82 −17.26 −19.36 −14.48 −16.06
13 −19.80 −19.29 −19.79 −21.02 −13.07 −19.35
Average
(7 to 13) −21.54 −16.99 −17.36 −21.46 −14.49 −17.74
frequencies from 7.0 to 13.0 GHz. For the fabricated rubber tire dust-rice husks pyramidal microwave absorbers, the best average reflection loss result is achieved at PointDwith−31.82 dB, while pointAshows
the worst reflection loss result with−22.03 dB.
Table 8. Average reflection loss of different ratios of the fabricated rubber tire dust-rice husk pyramidal microwave absorber.
Frequency (GHz)
Average Reflection Loss with Different Ratios of Rubber
Tire Dust: Rice Husks
75:25 50:50 25:75
7 −23.57 −20.18 −16.78
8 −26.51 −26.21 −17.56
9 −27.16 −24.39 −18.06
10 −29.65 −30.07 −20.98
11 −28.91 −34.96 −18.62
12 −27.95 −28.27 −17.13
13 −28.12 −27.79 −18.72
7 to 13 −27.41 −27.40 −18.27
−26.0 dB for the frequencies from 7.0 to 13.0 GHz. For the fabricated
rubber tire dust-rice husks pyramidal microwave absorbers, the best average reflection loss result is achieved at Point A with −21.54 dB,
while Point E shows the worst reflection loss result with−14.49 dB.
Figure 20 and Table 8 show the average measurement results of the reflection losses of the fabricated pyramidal microwave absorber at different rubber tire dust-rice husk ratios. The 75 : 25 ratio of rubber tire dust to rice husks shows the best reflection loss result, while the 50 : 50 ratio reflection loss result is only 0.01 dB. These two percentage results are considered acceptable and are better than that of the 25 : 75 ratio of rubber tire dust to rice husks, which have the worst performance at−18.27 dB for the average result.
Average Reflection Loss of Different Percentage for Rubber Tire Dust-Rice Husk Pyramidal Microwave Absorber (Fabrication)
Frequency, GHz
7 8 9 10 11 12 13
Reflectio
n
Lo
ss
,
dB
-100 -80 -60 -40 -20 0
75% Rubber Tire Dust, 25% Rice Husk 50% Rubber Tire Dust, 50% Rice Husk 25% Rubber Tire Dust, 75% Rice Husk
Figure 20. Average reflection loss of different ratios of the fabricated rubber tire dust-rice husk pyramidal microwave absorber.
(a)
(b)
Teflon
thickness
= 0.1cm to
5cm
Rice husk base thickness = 2cm Pyramidal part height = 13cm
Source signal, 30cm from the
tips of absorber Copper
thickness
= 0.1cm to
5cm
Rice husk base thickness = 2cm
Rice husk base thickness = 2cm
Source signal, 30cm from the
tips of absorber
Figure 21. (a) CST MWS simulation with (a) copper base and (b) Teflon base, respectively.
setup as shown in Figures 21(a) and (b) for copper and Teflon base, respectively. The source is placed apart from absorber’s tip and their interval is fixed at 30 cm for both cases. The source is a brownish rectangular plane as shown in Figure 21. It was designed in accordance with the shape of the aperture rectangular horn antennas as shown in Figure 15. In addition, rice husk base is fixed at 2 cm for both cases. The simulation was conducted within the frequency range from 0.01 GHz to 20 GHz. In addition, the thickness of copper and Teflon base vary from 0.1 cm to 5 cm. the simulated results are as shown in Figure 22 and Figure 23.
It can be noticed that the thickness is not a significant factor in determining the reflection loss, since the thickness of copper and Teflon base in Figures 21(a) and (b), respectively do not take effect upon the reflection loss. It shows that the trendline of reflection loss with frequency shows no difference for all the thickness of base as which listed in figure. It can be explained further by comparing Figure 22 with Figure 23. The range of reflection loss appear the same from 0.01 GHz to 20 GHz for different thickness of material as base. The variation of base thickness for different material also account for the similar range of reflection loss as shown in Figure 22 and Figure 23. It attributes to the heavy absorbency of the rubber dust-rice husk absorber which account for the trivial reflected signal against the base. High tangent loss in Figure 13 illustrates the greatness of absorbency of the rubber tire dust-rice husk mixture in dissipating the penetrated signal before it interacts with the base.
Reflection Loss of Rice Husk Pyramidal Microwave Absorber with Different Thickness of Teflon Base
Frequency, GHz
0 5 10 15 20
Re
flection Loss, dB
-100 -80 -60 -40 -20 0
no te flon 0. 1c m 0. 5c m 1c m 1. 5c m 2c m 2. 5c m 3c m 3. 5c m 4c m 4. 5c m 5c m
Reflection Loss of Rice Husk Pyramidal Microwave Absorber with Different Thickness of Copper Base
Frequency (GHz)
0 5 10 15 20
R
ef
le
ct
io
n
Lo
ss
(d
B
)
-120 -100 -80 -60 -40 -20 0
Figure 23. The response of simulated reflection loss varies with frequency toward different thickness of Copper base.
8. CONCLUSION
From the reflection loss performance in the measurement segment using the radar cross section method, the rubber tire dust has the potential to be used as an alternative material in designing the pyramidal microwave absorber. The reflectivity or refection loss results obtained for the rubber tire dust-rice husks pyramidal microwave absorbers are significantly better than 10 dB (i.e., the threshold dB for the characteristics of microwave absorbers). The reflection loss results obtained from the fabricated rubber tire-rice husks pyramidal microwave absorbers are also reasonable.
Using recycled materials, such as rubber tires and rice husks, can reduce landfill waste, help to maintain the environment and community’s good health, and significantly reduce the cost of the production of the microwave absorber compared to using the existing expensive material, polyurethane and polystyrene.
REFERENCES
1. United States Environmental Protection Agency, “Municipal solid waste in the United States: 2007 facts and figures,” EPA530-R-08-010, November 2008.
3. Jang, J.-W., T.-S. Yoo, J.-H. Oh, and I. Iwasaki, “Discarded tire recycling practices in the United States, Japan and Korea,”
Resources, Conservation and Recycling, Vol. 22, 1–14, 1998.
4. Joseph, P. S., “An assessment of environmental toxicity and potential contamination from artificial turf using shredded or crumb rubber,” Turfgrass Producers International, East Dundee, Illinois, United States of America, 2006.
5. El-Gammal, A., A. K. Abdel-Gawad, Y. El-Sherbini, and A. Shalaby, “Compressive strength of concrete utilizing waste tire rubber,”Journal of Emerging Trends in Engineering and Applied
Sciences, Vol. 1, No. 1, 96–99, 2010.
6. Aiello, M. A. and F. Leuzzi, “Waste tyre rubberized concrete: Properties at fresh and hardened state,” Journal of Waste
Management, Vol. 30, 1696–1704, 2010.
7. Siddique, R. and T. R. Naik, “Properties of concrete containing scrap-tire rubber: An overview,”Journal of Waste Management, Vol. 24, 563–569, 2004.
8. Eldin, N. N. and A. B. Senouci, “Rubber-tire particles as concrete aggregate,”Journal of Material in Civil Engineering, Vol. 5, No. 4, 478–496, 1993.
9. TNRCC, “The many uses of crumb rubber,” Texas Natural Resource Conservation Commission, Waste Tire Recycling Program, Office of Permitting, 1999.
10. Paul, J., Encyclopedia of Polymer Science and Engineering, Vol. 14, 787–802, 1985.
11. Stutzman, W. L. and G. A. Thiele,Antenna Theory and Design, John Wiley & Sons, New Jersey, United States of America, 1998. 12. Simcik, P.,Anechoic Chamber — Condition in Use, Version 1.03,
University of Adelaide, Australia, September 28, 2009.
13. Bronzoek Ltd., “Rice husk ash market study,” Bronzoek Ltd, United Kingdom, Surrey, United Kingdom, 2003, http://www.berr.gov.uk/files/file15138.pdf.
14. Yusof, I. M., N. A. Farid, and Z. A. Zainal, “Characterisation of rice husk for cyclone gasifier,”Journal of Applied Sciences, Vol. 8, No. 4, 622–628, 2008.
15. Ahiduzzaman, M. and A. K. M. S. Islam, “Environmental impact of rice husk briquette fuel use in Bangladesh: A case study of Mymensingh,”1st International Conference on the Developments
in Renewable Energy Technology (ICDRET), 1–4, 2009.
and drying shrinkage,” Australian Journal of Basic and Applied
Sciences, Vol. 3, No. 3, 1616–1622, 2009.
17. Nornikman, H., F. Malek, P. J. Soh, A. A. H. Azremi, F. H. Wee, and A. Hasnain, “Parametric studies of pyramidal microwave absorber using rice husk,”Progress In Electromagnetics Research, Vol. 104, 145–166, 2010.
18. Chung, B.-K. and H.-T. Chuah, “Design and construction of a multipurpose wideband anechoic chamber,” IEEE Antennas and
Propagation Magazine, Vol. 45, No. 6, 41–47, 2004.
19. Pues, H., Y. Arien, and F. Demming-Jansen, “Numerical evaluation of absorber reflectivity in an artificial waveguide,”20th
International Zurich Symposium on Electromagnetic Compability,
144–149, 2009.
20. Cumming Microwave Corporation, “Technical data for C-RAM FAC: High performance convoluted absorber,” 1–2, Avon, Massachusetts, United States of America, 1997.
21. TDK RF Solution Inc., “Absorber for microwave and millimeter wave test chamber,” 9–10, Uniondale, New York, United States of America, 2008.
22. Nornikman, H., M. F. B. A. Malek, M. Ahmed, F. H. Wee, P. J. Soh, A. A. H. Azremi, S. A. Ghani, A. Hasnain, and M. N. Taib, “Setup and results of pyramidal microwave absorbers using rice husks,”Progress In Electromagnetics Research, Vol. 111, 141–161, 2011.
23. Nornikman, H., P. J. Soh, and A. A. H. Azremi, “Performance simulation of pyramidal and wedge microwave absorbers,” 3rd
Asian Modelling Symposium (AMS 2009), 649–654, Bandung,
Indonesia, 2009.
24. Nornikman, H., P. J. Soh, A. A. H. Azremi, F. H. Wee, and M. F. Malek, “Investigation of agricultural waste as an alternative material for microwave absorber,” PIERS Online, Vol. 5, No. 6, 506–510, 2009.
25. Wee, F. H., P. J. Soh, A. H. M. Suhaizal, H. Nornikman, and A. A. M. Ezanuddin, “Free space Measurement technique on di-electric properties of agricultural residues at microwave frequen-cies,” International Microwave and Optoelectronics Conference
(IMOC 2009),182–187, Belem, Brazil, 2009.
26. Nornikman, H., F. Malek, P. J. Soh, A. A. H. Azremi, F. Wee, and A. Hasnain, “Measurement of pyramidal microwave absorbers using RCS methods,” The 3rd International Conference on
Intelligent & Advanced Systems (ICIAS 2010), 1–5, Universiti
27. Hasnain, A., B. M. Hafiz, S. Roslan, M. I. Imran, A. A. Takyud-din, A. Rusnani, and O. M. Khusairi, “Development of an eco-nomic and effective microwave absorber,”2007 Asia-Pacific
Con-ference on Applied Electromagnetics (APACE 2007), 1–5, 2007.
28. Holloway, C. L. and E. F. Kuester, “A low-frequency model for wedge or pyramidal absorber arrays II: Computed and measured results,” IEEE Transactions on Electromagnetic Compatibility, Vol. 36, No. 4, 300–306, 1994.
29. Razavi, S. M. J., M. Khalaj-Amirhosseini, and A. Cheldavi, “Minimum usage of ferrite tiles in anechoic chambers,” Progress
In Electromagnetics Research B, Vol. 19, 367–383, 2010.
30. Li, M., H.-L. Yang, X.-W. Hou, Y. Tian, and D.-Y. Hou, “Perfect metamaterial absorber with dual bands,” Progress In
Electromagnetics Research, Vol. 108, 37–49, 2010.
31. Wang, J., S. Qu, Z. Fu, H. Ma, Y. Yang, X. Wu, Z. Xu, and M. Hao, “Three-dimensional metamaterial microwave absorbers composed of coplanar magnetic and electric resonators,”Progress
In Electromagnetics Research Letters, Vol. 7, 15–24, 2009.
32. Razavi, S. M. J. and M. Khalaj-Amirhosseini, “Optimization an anechoic chamber with ray-tracing and genetic algorithms,”
Progress In Electromagnetics Research B, Vol. 9, 53–68, 2008.
33. Kajehpour, A. and S. A. Mirtaheri, “Analysis of pyramidal EM wave absorber by FDTD method and comparing with capacitance and homogenization method,” Progress In Electromagnetic
Research Letters, Vol. 3, 123–131, 2008
34. Razavi, S. M. J., M. Khalaj-Amirhosseini, and A. Cheldavi, “Minimum usage of ferrite tiles in anechoic chambers,” Progress
In Electromagnetics Research B, Vol. 19, 367–383, 2010.
35. Li, M., H.-L. Yang, X.-W. Hou, Y. Tian, and D.-Y. Hou, “Perfect metamaterial absorber with dual bands,” Progress In
Electromagnetics Research, Vol. 108, 37–49, 2010.
36. Wang, J., S. Qu, Z. Fu, H. Ma, Y. Yang, X. Wu, Z. Xu, and M. Hao, “Three-dimensional metamaterial microwave absorbers composed of coplanar magnetic and electric resonators,”Progress
In Electromagnetics Research Letters, Vol. 7, 15–24, 2009.
37. Razavi, S. M. J. and M. Khalaj-Amirhosseini, “Optimization an anechoic chamber with ray-tracing and genetic algorithms,”
Progress In Electromagnetics Research B, Vol. 9, 53–68, 2008.
Letters, Vol. 9, 119–127, 2009.
39. Khajehpour, A. and S. A. Mirtaheri, “Analysis of pyramid EM wave absorber by FDTD method and comparing with capacitance and homogenization methods,” Progress In Electromagnetics
Research Letters, Vol. 3, 123–131, 2008.
40. Huang, R., Z.-W. Li, L. B. Kong, L. Liu, and S. Matitsine, “Analysis and design of an ultra-thin metamaterial absorber,”
Progress In Electromagnetics Research B, Vol. 14, 407–429, 2009.
41. Chamaani, S., S. A. Mirtaheri, M. Teshnehlab, M. A. Shoorehdeli, and V. Seydi, “Modifed multi-objective particle swarm optimiza-tion for electromagnetic absorber design,”Progress In
Electromag-netics Research, Vol. 79, 353–366, 2008.
42. Ramprecht, J., M. Norgren, and D. Sjoberg, “Scattering from a thin magnetic layer with a periodic lateral magnetization: Appli-cation to electromagnetic absorbers,”Progress In
Electromagnet-ics Research, Vol. 83, 199–224, 2008.
43. Latrach, L., N. D. Sboui, A. Gharsallah, A. Gharbi, and H. Baudrand, “A design and modelling of microwave active screen using a combination of the rectangular and periodic waveguides modes,” Journal of Electromagnetic Waves and Applications, Vol. 23, No. 11–12, 1639–1648, 2009.
44. Kadiroglu, F. and U. C. Hasar, “A highly accurate microwave method for permittivity determination using corrected scattering parameter measurements,”Journal of Electromagnetic Waves and
Applications, Vol. 24, No. 16, 2179–2189, 2010.
45. Wu, G., X. G. Zhang, and B. Liu, “A hybrid method for predicting the shielding effectiveness of rectangular metallic enclosures with thickness apertures,” Journal of Electromagnetic Waves and
Applications, Vol. 24, No. 8–9, 1157–1169, 2010.
46. Stuchly, M. A. and S. S. Stuchly, “Coaxial line reflection methods for measuring dielectric properties of biological substances at radio and microwave frequencies — A review,” IEEE Trans. Instrum.
Meas., Vol. 30, 228–229, 1980.
47. Marcuvitz, N., Waveguide Handbook, 428, McGraw-Hill, New York, 1951.
48. Gajda, G. B. and S. S. Stuchly, “Numerical analysis of open-ended coaxial lines,” IEEE Trans. & Microwave Theory Tech., Vol. 31, 380–384, 1983.
IEEE Trans. & Microwave Theory Tech., Vol. 30, No. 1, 87–92, 1982.
50. Anderson, J. M., G. B. Gajda, and S. S. Stuchly, “Analysis of an open-ended coaxial line sensor in layer dielectric,” IEEE Trans.
Instrum. Meas., Vol. 35, 13–18, 1986.
51. Misra, D., “A quasi-static analysis of open-ended coaxial lines,”
IEEE Trans. &Microwave Theory Tech., Vol. 35, 925–928, 1987.
52. Stuchly, M. A., M. M. Brady, S. S. Stuchly, and G. Gadja, “Equivalent circuit of an open-ended coaxial line in a lossy material,”IEEE Trans. Instrum. Meas., Vol. 31, 116–119, 1982. 53. Bryant, J. H., “Coaxial transmission lines, related two-conductor
transmission lines, connector, and components: A.U.S. historical perspective,” IEEE Trans. & Microwave Theory Tech., Vol. 32, No. 9, 970–983, 1984.
54. You, K. Y. and Z. Abbas, Open-ended Coaxial Sensor Handbook:
Formulations, Microwave Measurements and Applications, LAP
Lambert Academic Publishing, 2010.
55. Inan, U. S. and A. S. Inan, Electromagnetics Waves, 07458, Prentice-Hall, Inc., Upper Saddle River, NJ, 2000.
56. Weisstein, E., Eric Weisstein’s World of Science, http://scienceworld.wolfram.com/physics/, 2008.
57. Lim, K.-S., J.-Y. Koay, V. C. Koo, and H.-T. Ewe, “High angular resolution measurements of the monostatic backscattering coefficient of rice fields,” Journal of Electromagnetic Waves and
Applications, Vol. 23, No. 1, 1–10, 2009.
58. Barroso, J. J. and A. L. de Paula, “Retrieval of permittivity and permeability of homogeneous materials from scattering parameters,”Journal of Electromagnetic Waves and Applications, Vol. 24, No. 11–12, 1563–1574, 2010.
59. Jin, H., S. R. Dong, and D. Wang, “Measurement of dielectric constant of thin film materials at microwave frequencies,”Journal
of Electromagnetic Waves and Applications, Vol. 23, No. 5–6, 809–
817, 2009.
60. Zhang, H., S. Y. Tan, and H. S. Tan, “Experimental investigation on flanged parallel-plate dielectric waveguide probe for detection of conductive nclusions in lossy dielectric medium,” Journal of
Electromagnetic Waves and Applications, Vol. 24, No. 5–6, 681–
693, 2010.
Vol. 110, 453–467, 2010.
62. Hasar, U. C., O. Simsek, M. K. Zateroglu, and A. E. Ekinci, “A microwave method for unique and non-ambiguous permittivity determination of liquid materials from measured uncalibrated scattering parameters,” Progress In Electromagnetics Research, Vol. 95, 73–85, 2009.
63. Hasar, U. C., “A new microwave method based on transmission scattering parameter measurements for simultaneous broadband and stable permittivity and permeability determination,”Progress
In Electromagnetics Research, Vol. 93, 161–176, 2009.
64. Hasar, U. C. and O. Simsek, “On the application of microwave calibration-independent measurements for noninvasive thickness evaluation of medium- or low-loss solid materials,” Progress In
Electromagnetics Research, Vol. 91, 377–392, 2009.
65. Chang, H.-W., Y.-H. Wu, S.-M. Lu, W.-C. Cheng, and M.-H. Sheng, “Field analysis of dielectric waveguide devices based on coupled transverse-mode integral equation-numerical investigation,” Progress In Electromagnetics Research, Vol. 97, 159–176, 2009.
66. Lesurf, J., “Warp factor ε!” University of St. An-drews, http://www.st-andrews.ac.uk/∼www pa/Scots Guide/
info/comp/passive/capacit/dielec/di const/dicon.html, 2006. 67. Neelakanta. P. S. and J. C. Park, “Microwave absorption by
conductor loaded dielectric,” IEEE Transactions on Microwave
Theory and Technique,Vol. 43, No. 6, 1381–1383, 1995.
68. Li, E., Z.-P. Nie, G. Guo, Q. Zhang, Z. Li, and F. He, “Broadband measurements of dielectric properties of low-loss materials at high temperatures using circular cavity method,” Progress In
Electromagnetics Research, Vol. 92, 103–120, 2009.
69. Hasar, U. C. and O. Simsek, “An accurate complex permittivity method for thin dielectric materials,”Progress In
Electromagnet-ics Research, Vol. 91, 123–138, 2009.
70. Hasar, U. C., “Permittivity determination of fresh cement-based materials by an open-ended waveguide probe using amplitude-only measurements,” Progress In Electromagnetics Research, Vol. 97, 27–43, 2009.
71. Hasar, U. C., “Permittivity measurement of thin dielectric materials from reflection-only measurements using one-port vector network analyzers,”Progress In Electromagnetics Research, Vol. 95, 365–380, 2009.
broadband absorbers using central force optimization,” Progress
In Electromagnetics Research B, Vol. 26, 101–113, 2010.
73. Remillard, S. K., A. Hardaway, B. Mork, J. Gilliland, and J. Gibbs, “Using a re-entrant microwave resonator to measure and model the dielectric breakdown electric field of gases,”Progress In
Electromagnetics Research B, Vol. 15, 175–195, 2009.
74. Helhel, S., B. Colak, and S¸. ¨Ozen, “Measurement of dielectric constant of thin leaves by moisture content at 4 mm band,”
Progress In Electromagnetics Research Letters, Vol. 7, 183–191,
2009.
75. Chou, Y.-H., M.-J. Jeng, Y.-H. Lee, and Y.-G. Jan, “Measurement of RF PCB dielectric properties and losses,” Progress In
Electromagnetics Research Letters, Vol. 4, 139–148, 2008.
76. Simpkin, R., “Derivation of lichtenecker’s logarithmic mixture formula from Maxwell’s equations,” IEEE Trans. on MTT, Vol. 58, No. 3, 545–550, Mar. 2010.
77. Agilent Technologies Inc., “Agilent basics of measuring the dielectric properties of materials,” 1–32, Santa Clara, California, United States of America.
78. Agilent Techonlogies Inc., “Agilent 85070E, dielectric Probe Kit, 200 MHz to 50 GHz,” 1–12, Santa Clara, California, United States of America, 2008.
79. Gupta, M. and W. W. L. Eugene, Microwaves and Metals, John Wiley & Sons, New Jersey, United States of America, 2007. 80. Fischer, B. and I. Lahaie, “Recent microwave absorber
wall-reflectivity measurement methods,” IEEE Antennas and
![Figure 9. Coordinate system and dimensions for a coaxial line [55].](https://thumb-ap.123doks.com/thumbv2/123dok/584862.69595/9.454.67.392.435.579/figure-coordinate-system-and-dimensions-for-coaxial-line.webp)