DEVELOPMENT OF SMART METER SYSTEM FOR LOW
VOLTAGE RESIDENTIAL PREMISES IN MALAYSIA
Muhd Khairi bin Abdul Arif
Bachelor of Electrical Engineering (Industrial Power)
i
“I hereby declare that I have read through this report entitle ‘Development of Smart Meter
System for Low Voltage Residential Premises in Malaysia’ and found that it has comply the
partial fulfillment for awarding the degree of Bachelor of Electrical Engineering (Industrial Power)”
Signature : ...
Supervisor’s Name : Dr. Abdul Rahim bin Abdullah
ii
DEVELOPMENT OF SMART METER SYSTEM FOR LOW VOLTAGE
RESIDENTIAL PREMISES IN MALAYSIA
MUHD KHAIRI BIN ABDUL ARIF
A report submitted in partial fulfillment of the requirements for the degree of
Bachelor of Electrical Engineering (Industrial Power)
Faculty of Electrical Engineering
UNIVERSITI TEKNIKAL MALAYSIA MELAKA
iii
“I declare that this report entitle ‘Development of Smart Meter System for Low Votlage
Residential Premises in Malaysia’ is the result of my own research except as cited in the
references. The report has not been accepted for any degree and is not concurrently submitted in candidature of any other degree.”
Signature : ...
Name : Muhd Khairi bin Abdul Arif
iv
v
ACKNOWLEDGEMENT
In preparing this report, I was in contact with many people, researchers, academicians and practitioners. They have contributed towards my understanding and thought. In particular, I wish to express my sincere appreciation to my main project supervisor, Dr. Abdul Rahim bin Abdullah, for encouragement and guidance. I am also very thankful to my co-supervisors En. Mohamad Faizal bin Baharom for his guidance,
advice and motivation. Without their continued support and interest, this project would not have been same as presented here.
vi
ABSTRACT
Increasing energy demand encourages the utilities such as Tenaga Nasional Berhad (TNB) to improve the process of energy management and measuring energy consumption for billing purpose. The conventional meter reading is done manually whereby the utilities send human operator to every premise to take energy measurement. This requires huge number of labor work and long working hour to achieve a complete area measurement data collection. This process is not very effective when the meter is inaccessible. It is also constrained by bad weather condition. As energy demand rises due to the growing of population and industrial development, the process requires more human operators and longer working hours to complete. The problems are also arises during the event of disconnecting supply by utilities due to default bill payments since it is done manually. In order to improve overall efficiency in energy measurement process, a smart meter system is developed. The smart meter system acts as conventional energy meter but with additional features such as the system enables the utilities to retrieve the meter energy measurement data remotely via Global System for Mobile Communication (GSM). The smart meter system also allows the utilities to disconnect and reconnect supply to each and
every energy meter in certain area remotely in order to save manpower consumption. The system also allows consumer to monitor their consumption by displaying voltage, current,
vii
ABSTRAK
Peningkatan permintaan terhadap tenaga elektrik telah menggalakkan syarikat
pembekal tenaga elektrik seperti Tenaga Nasional Berhad (TNB) mencari alternatif bagi meningkatkan tahap kecekapan proses pengurusan tenaga dan proses pengukuran penggunaan tenaga bagi kegunaan pengeluaran bil. Proses bacaan meter tenaga dari sistem meter konvensional dilakukan secara manual di mana TNB perlu menghantar pembaca meter ke setiap premis melakukan proses tersebut. Keadaan ini menggunakan ramai tenaga kerja dan juga masa yang lama untuk mengambil bacaan meter di sesebuah kawasan. Proses ini juga terdedah kepada ralat terutama bagi situasi di mana meter tersebut terletak di kawasan ceruk dan di pedalaman. Proses ini juga terpengaruh oleh faktor cuaca seperti keadaan cuaca hujan. Peningkatan terhadap permintaan tenaga elektrik yang seiring dengan perkembangan populasi penduduk dan pembangunan industri telah menyebabkan proses bacaan meter memerlukan lebih banyak tenaga kerja dan tempoh masa yang lebih panjang. Masalah yang sama juga timbul semasa proses pemotongan bekalan bil – bil tergunggak oleh TNB kerana proses ini juga dilakukan secara manual. Bagi meningkatkan kecekapan keseluruhan, sebuah sistem meter pintar dibangunkan. Sistem meter pintar ini membolehkan pihak pembekal tenaga elektrik mendapatkan bacaan meter secara automatik dengan menggunakan alat kawalan jauh yang dikawal oleh Global System for Mobile
Communication (GSM). Sistem pintar ini juga membolehkan TNB untuk memutuskan dan
menyambungkan semula bekalan kepada setiap meter di kawasan tertentu secara jarak jauh bagi menjimatkan tenaga kerja dan masa. Sistem meter pintar ini juga membolehkan
pengguna memantau penggunaan tenaga yang telah mereka gunakan iaitu dengan memaparkan nilai voltan, arus, dan tenaga yang digunakan. Selain itu, sistem ini menggunakan Arduino Uno sebagai unit kawalan untuk mengawal sesentuh dalam proses pemotongan dan penyambungan semula bekalan. Sistem ini juga boleh memaparkan bacaan elektrik seperti voltan, arus dan penggunaan tenaga dengan menggunakan Liquid
Crystal Display (LCD). Sistem ini sangat sesuai digunakan kerana GSM digunakan secara
viii
TABLE OF CONTENTS
CHAPTER TITLE PAGE
ABSTRACT ... vi
ABSTRAK ... vii
LIST OF FIGURES ... ix
LIST OF TABLES ... xi
INTRODUCTION ... 1
1.1 ELECTRICAL ENERGY MEASUREMENT ... 1
1.2 PROBLEM STATEMENTS ... 2
1.3 OBJECTIVES OF PROJECT ... 4
1.4 SCOPES OF PROJECT ... 5
LITERATURE REVIEW ... 6
2.1 THEORY AND BASIC PRINCIPLES ... 6
2.2 REVIEW OF PREVIOUS RELATED WORKS ... 8
RESEARCH METHODOLOGY ... 14
3.1 RESEARCH WORK FLOW ... 14
3.2 DESIGN AND DEVELOPMENT PHASE ... 16
3.3 PERFORMANCE TESTING ... 25
RESULTS AND DISCUSSIONS ... 27
4.1 OPERATION OF SMART METER SYSTEM ... 27
4.2 CURRENT MEASUREMENT EXPERIMENT ... 35
4.3 POWER MEASURING EXPERIMENT ... 37
4.4 VOLTAGE MEASUREMENT EXPERIMENT ... 39
4.5 TIME RESPONSE EXPERIMENT ... 41
CONCLUSION AND RECOMMENDATION ... 47
REFERENCES ... 48
APPENDICES ... 50 1
2
3
4
ix
LIST OF FIGURES
FIGURE TITLE PAGE
Figure 3.1: Flowchart of the work plan. ... 15
Figure 3.2: Schematic diagram of smart meter system. ... 16
Figure 3.3: Flowchart of the smart meter system. ... 18
Figure 3.4: Flowchart of the smart meter system (continue). ... 19
Figure 3.5: Operating flow diagram of the smart meter system. ... 20
Figure 3.6: GSM system device. ... 21
Figure 3.7: Hall-effect linear current sensor. ... 22
Figure 3.8: Arduino Uno with variety of input and output pins... 24
Figure 4.1: Smart Meter System. ... 27
Figure 4.2: Smart Meter System with 100W light bulb. ... 28
Figure 4.3: LCD display of Smart Meter System. ... 28
Figure 4.4: SMS command sent by consumer. ... 29
Figure 4.5: SMS replied by Smart Meter System to consumer... 29
Figure 4.6: The display of LCD before and after utilities sends SMS command. ... 30
Figure 4.7: SMS command sent by utilities. ... 30
Figure 4.8: SMS replied by Smart Meter System to utilities. ... 30
Figure 4.9: SMS command sent by utilities for disconnection of supply. ... 32
Figure 4.10: Smart Meter System disconnected the supply to consumer ... 32
Figure 4.11: System warns the consumer that supply is already disconnected. ... 32
Figure 4.12: System confirmed that the supply is already disconnected. ... 33
Figure 4.13: SMS command sent by utilities for reconnection of supply. ... 33
Figure 4.14: System reconnected the supply to consumer. ... 33
Figure 4.15: System continued to accumulate the energy used by consumer. ... 34
Figure 4.16: Current measurement comparison. ... 35
Figure 4.17: Current Error Percentage. ... 36
Figure 4.18: Power measurement comparison ... 37
x
Figure 4.20: Voltage measurement comparison. ... 39
Figure 4.21: Voltage Error Percentage. ... 40
Figure 4.22: i-ENVEX 2014 certification of participation. ... 44
Figure 4.23: Silver medal award. ... 45
xi
LIST OF TABLES
TABLE TITLE PAGE
1
CHAPTER 1
1 INTRODUCTION
1.1ELECTRICAL ENERGY MEASUREMENT
Measurement is defined as the set of operations having the objective of determining the value of a quantity [1]. Usually measurements of a quantity are done using a certain device or system. In electrical power system, electrical energy is measured by the electric energy meter in order to determine the quantity of electrical energy that has been used by the consumers. Energy that has been measured is then used by the utilities for billing purpose. Measuring process is one of the elements that play an important role in the electrical power system.
Electrical energy meter uses the kilowatt hour (kWh) as it is the measurement of electrical energy. It is equals to the amount of energy used by a load of one kilowatt over a
2
1.2PROBLEM STATEMENTS
Until today, conventional electromechanical energy meters are still being used. Those metering system is most likely utilities friendly but not very user friendly. The electric meter shows the accumulated energy measurement from the first time of its operation. So the meter’s measurement needs to be processed by a special device made by utilities in order to know how much energy being used when the bill is forwarded to consumer. The consumers have no idea on how much consumption are made during the whole month. They only know how much they have used at the end of the month without
knowing other details such as time they consumed the most. Since they cannot monitor the consumption, it is difficult for them to control the consumption without knowing exactly how much consumption is made at certain time. So there is a great lack of real-time and evidence of demonstrative reading [3].
Utilities have tried to encourage consumers to utilize electrical wisely to avoid wastage by imposing tariffs rate that increase according to how much electricity consumed in one month. In Malaysia the tariffs rate that increased after consumers use more than 200kWh of energy in each month [4]. With the conventional metering systems this is hard to achieve since the information regarding the consumption is given in an unfamiliar form. The conventional meter displays numbers that represent entire energy consumption from the beginning of operation of the meter and this number keeps increasing whenever there is energy used by consumers. In order to get how much energy has been used in a month, operators will need to do some calculation from the number displays by the meter. So, consumers never know how much consumption has been made through in real time until the bills come to them at the end of the month.
The billing process also has become an issue to the utilities which the collection of data is still through site visit or manual reading, so still there are dependencies of
3
customer – utility relation. In the case of disconnection or reconnection supply also has the same issue whereby the process of disconnection or reconnection must be done manually. So this kind of practice is a manpower consuming and energy consuming with high cost and low efficiency [6].
As the electric demand is increasing as a result of population and industrial development, utilities need to provide more manpower and the consumers also need to be aware of their energy consumption in order to reduce waste [7]. Smart meter system helps increase awareness to consumers on how much electricity is consumed by giving information about the current electric consumption while the system contribute in
4
1.3OBJECTIVES OF PROJECT
The objectives of this project are:
1. To develop a smart meter system that measure and display standard electrical measurement such as voltage, current, and energy.
2. To design a smart meter system that can send energy consumption data to utilities remotely via GSM.
3. To build a smart meter system with automatic disconnection and reconnection of electric
5
1.4SCOPES OF PROJECT
The scopes of this project are:
1. To measure standard electrical measurement such as voltage, current and energy consumption of a single phase system of residential premises.
The voltage and current of the power line to residential premises are measured and the energy consumption is calculated by the system using microcontroller. The value of single phase voltage is up to 240V with tolerance of +10% and -6% while the value of current used in the project ranging from 0 to 50A.
2. To utilize the GSM as the wireless communication structure for the system and
Arduino as the control unit of the smart meter system.
GSM is used for sending energy consumption data to utilities and receiving command from utilities to disconnect or reconnect power lines. Arduino used as a controlling unit, to operate LCD, GSM and contactor.
3. To display energy consumption through LCD.
6
CHAPTER 2
2 LITERATURE REVIEW
2.1THEORY AND BASIC PRINCIPLES
It is important to increase consumers’ awareness on managing electrical energy consumption effectively. The increasing tariffs rate depending on how much consumption in a month is imposed by the utilities in order to encourage consumer to use electrical energy wisely and prevent electrical wastage. Smart meter system helps in delivering the information of consumption to the consumer as to give ability to estimate bills from the collected information and thus manage their energy consumptions to reduce their electric bills [8].
The smart meter system involves two way communications between the meter itself and both utilities and consumer. The system basically permits both parties to get energy consumption data from the meter through some kind of communication system. The communication system comprises of two types; wireless and wired communication network. Wired communication network apply the Power Line Carrier and Telephone Line Network while wireless communication network utilizes GSM, Bluetooth and ZigBee as the medium [9]. The measurement of current and voltage of residence system are made
and calculated by the microcontroller to produce the value of power and energy that has been used. The values are displayed on display device. The values also can be sent to the utilities for billing purpose or to the consumers themselves as for energy remote monitoring.
7
8
2.2REVIEW OF PREVIOUS RELATED WORKS
A lot of studies have been conducted by many researchers and the designed concepts are all more or less the same to each other in terms of metering system operation. Most of them using current and voltage transducer to measure data of voltage and current parameters and the data received are then be calculated to produce the power consumption. A development of current transducer and voltage transducer has been done by Y. Huayun et. al [10]. They proposed the application of adaptive optical current transducers and adaptive optical voltage transducers in digital meter. Adaptive optical current transducers are based on Faraday magneto-optic effect principle which has great measurement linearity
and able to measure not only alternating current but also capable of measuring direct current. The Faraday magneto-optic effect principle that has been applied by the optical
current transducer will never encounter frequency band problem while it has great harmonic measurement accuracy. The adaptive optical voltage transducer is based on Pockels effects. Both optical current and voltage transducer are made if optical sensor head and secondary converter. The secondary converter provides the optical source for optical sensor and receives the analog optical signal. Then the second converter collects the voltage or current signal and realizes the synchronization according to received synchronization signal of master clock.
Another way to obtain the power consumption from existing power meter is by impulse counting system. P. Prudhi, et. al. has proposed the smart meter architecture [11]. The research was done at India so they focused on how to provide advance but low cost smart meter system and still conserving existing meter. Their research uses additional conversion module for detecting pulses from digital meter or detecting rotating disc on electromechanical meter. From that, they calculated how much energy consumed and provide the data to the utilities. The implementation of electric impulse counting can easily lead to the loss of counting impulses, or lead to multi-counting impulses due to the shaking impulse during switching event of digital data. So these can lead to wrong counting and influence the precision of automatic reading.
The other type of acquiring the meter’s measurement data is by capturing the image of the meter itself. S. Dongmei and co-workers have proposed the automatic meter reading
9
image processing, intelligent recognition, image segmentation and character recognition to identify the measurement data. The system composition consists of three levels such as reading terminal at bottom level, area concentrators and main computer for control at the middle and at the top level is the main computer of electrical administrative department which governs by utilities. This automatic reading system was proposed because its ability to contribute to real time with high efficiency and small errors in recognition which highly overcome the shortage of impulse counting.
Smart meter also involve providing two way communications between consumer and utilities. ZigBee wireless communication network is used for communication network
for smart meter system. Shang-Wen Luan et. al. has mentioned that ZigBee communication network have advantages of low cost and low power consumption [13]. The smart meter
with ZigBee based consists of two parts; the ZigBee based power meter and the end processing system. At the power meter, voltage and Current waveform are sampled by a data acquisition module and then converted to digital signal via ADC module of Microchip dsPIC30F microcontroller series. The voltage and current measured is calculated by microcontroller to obtain power consumption data and be sent to end processing system via ZigBee device. The end processing system contains ZigBee coordinator and software that designed to establish a power consumption and outage event database as well as to offer the inquiries of power consumption data. Each ZigBee power based system is acts as a node that need to communicate with the ZigBee coordinator of end processing system. The connected power meter to ZigBee coordinator will allow the end system to send command to receive power consumption data from each power meter. The ZigBee wireless communication networks are limited to small area network for a few kilometers square.
Petri Oksa et. al. has present their research on consideration of automatic meter reading system using PLC [14]. It is stated that PLC is a convenient networking functions without additional cables. This type of communication system has an advantage where by the networking and digitalization of existing facilities can be organized and managed at low cost. The power lines are actually used to supply electrical energy to various types of electrical appliances and devices. The lines are specially designed with low levels of
10
speed is a bit slow which it was reduced nearly 50% in this research. PLC also limited to small area network since the larger system of PLC can reduce transfer speed over 65% [14]. These measures are considered as a major loss to data transmission which the reduction in data transmission speed will contribute to data loss or data corruption.
Furthermore, GSM also used to be the communication structure for the smart meter system. This system is presented by Anmar Arif et. al. and it is on the implementing the application of GSM to transmit energy consumption data to the utility [15]. The system contains of a digital energy meters that measures the consumption of electrical energy and provides other additional information as it provide an easy way both consumer and utilities
to monitor the consumption. The measured energy consumption is sent to the utilities, which can store the data and notify the consumer thorugh Short Messaging System (SMS)
or through the internet.
K. Ashna et. al. through their research has brought GSM based automatic energy meter reading system with instant billing [16]. They have proposed system that replaces traditional meter reading methods and enables remote access of existing energy meter by the utilities. Also they can monitor the meter readings regularly without the person visiting each house. The utilities will collect the data of energy consumption from each premise through their billing point stations. GSM has many advantages since its widespread use throughout the world and the use of Subscriber Identity Module (SIM) cards to send SMS messages. The wide area can be useful since large area consist of many smart meter can send data to one end processing center to collect all data.
11
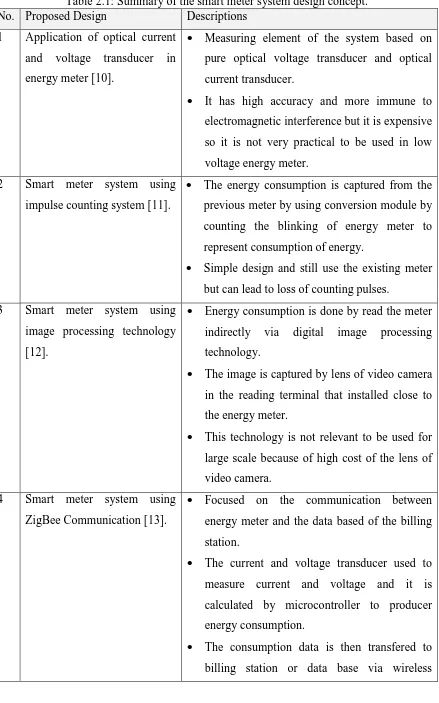
Table 2.1: Summary of the smart meter system design concept. No. Proposed Design Descriptions
1 Application of optical current and voltage transducer in energy meter [10].
Measuring element of the system based on pure optical voltage transducer and optical
current transducer.
It has high accuracy and more immune to electromagnetic interference but it is expensive so it is not very practical to be used in low voltage energy meter.
2 Smart meter system using impulse counting system [11].
The energy consumption is captured from the previous meter by using conversion module by counting the blinking of energy meter to represent consumption of energy.
Simple design and still use the existing meter but can lead to loss of counting pulses.
3 Smart meter system using image processing technology [12].
Energy consumption is done by read the meter indirectly via digital image processing technology.
The image is captured by lens of video camera in the reading terminal that installed close to the energy meter.
This technology is not relevant to be used for large scale because of high cost of the lens of video camera.
4 Smart meter system using ZigBee Communication [13].
Focused on the communication between energy meter and the data based of the billing station.
The current and voltage transducer used to measure current and voltage and it is calculated by microcontroller to producer energy consumption.
12
network of ZigBee.
ZigBee communication has a stable communication structure but it covers a limited range of networks so it might need a type of repeater to send data over a long distance.
5 Smart meter system using power line communication system [14].
Focused on the communication network between uitilities and consumer through power line communication system.
Not very suitable since the consumption data is in high frequency form which not very suitable for power line cable that operate at 50 to 60 Hz of frequency.
6 Smart meter system using the combination of GSM and ZigBee communication system [15].
Uses GSM and ZigBee as communication network.
ZigBee used to provide small area communication network between energy meters. So there is a need of one station to
collect data from the meter. The data is sent to utilities using GSM because GSM provide wide area communication network.
This uses high cost of installation because of the combination of two different communication systems.
7 Smart meter system using GSM communication system [16].
Based on the utilization of GSM as communication network.