Modeling of TiN Coating Thickness Using RSM Approach
Abdul Syukor Mohamad Jaya
1,2,a, Siti Zaiton Mohd Hashim
2,b,
Habibollah Haron
2,c,
Muhd. Razali Muhamad
3,d, Abd Samad Hasan Basari
1,e,
Md. Nizam Abd. Rahman
3,f1 Centre of Advanced Computing Tech., Universiti Teknikal Malaysia Melaka, Hang Tuah Jaya,
76100 Durian Tunggal, Melaka, Malaysia
2 Soft Computing Research Group (SCRG), Faculty of Computing, Universiti Teknologi Malaysia,
81300 UTM, Skudai, Johor, Malaysia
3 Faculty of Manufacturing Eng., Universiti Teknikal Malaysia Melaka, Hang Tuah Jaya,
76100 Durian Tunggal, Melaka, Malaysia
a[email protected], b[email protected], c[email protected], d[email protected],
e[email protected], f[email protected]
Keywords: TiN, thickness, modeling, sputtering, PVD, RSM
Abstract. In this paper, modeling of Titanium Nitrite (TiN) coating thickness using Response Surface Method (RSM) is implemented. Insert cutting tools were coated with TiN using Physical Vapor Deposition (PVD) sputtering process. N2 pressure, Argon pressure and turntable speed were
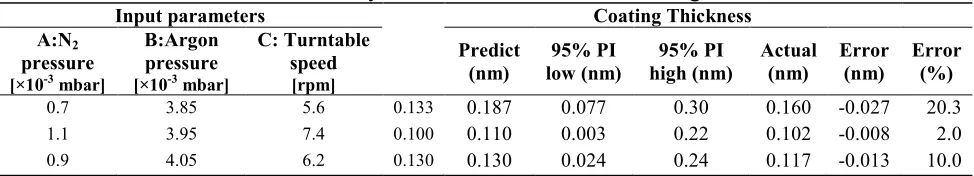
selected as process variables while the coating thickness as output response. The coating thickness as an important coating characteristic was measured using surface profilometer equipment. Analysis of variance (ANOVA) was used to determine the significant factors influencing TiN coating thickness. Then, a polynomial linear model represented the process variables and coating thickness was developed. The result indicated that the actual validation data fell within the 90% prediction interval (PI) and the percentage of the residual errors were low. Findings from this study suggested that Argon pressure, N2 pressure and turntable speed influenced the TiN coating thickness.
Introduction
During a machining process, high temperature on the cutting tool tip could exceed 800oC. This
condition reduces cutting tool performance and increases cutting tool wear. Therefore, a cutting tool with high resistance to wear is very important to deal with the condition. This performance could be improved by applying thin film coating on the cutting tool. The thin film could enhance the surface properties while maintaining its bulks properties. It was proven that the coated tool has forty times better in tool wear resistance compared to the uncoated tool [1].
Two main techniques in depositing coating on cutting tool are physical vapor deposition (PVD) and chemical vapor deposition (CVD). The main different between the both processes is the vapour source. In the PVD coating process, the sputtered particle from harder material embedded on the cutting tool in presence of reactive gas. In PVD coating process, many factors are reported have significant influence to coating characteristics especially coating thickness [2, 3]. Determination of sufficient thickness in coating is very important to avoid substrate penetration during machining process. A coating thickness has been reported influenced the other coating characteristics. It has reported that higher coating thickness increased the grain size and the roughness of the coating [4]. Some of the studies shown that N2 pressure, Argon pressure and turntable speed could have
significant effect on the deposited coating and surface morphology [5-7].
Experiment
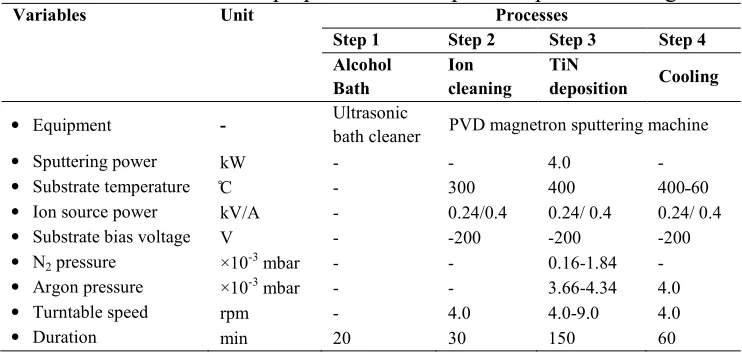
Material and Method. The experiment was run in unbalanced PVD magnetron sputtering system made by VACTEC Korean model VTC PVD 1000. The coating chamber was fixed with a vertical titanium (Ti) target. The surface of tungsten carbide inserts was cleaned with alcohol bath in an ultrasonic cleaner for 20 minutes. The tungsten carbide inserts were loaded in the rotating substrate holder inside the coating chamber. To produce the electron in the coating chamber for sputtering purpose, an inert gas called Argon was used. The tungsten carbide inserts were coated with the Ti in presence of nitrogen gas. Details of the process is indicated in Table 1.
Table 1. Substrate preparation and deposition process setting Variables Unit Processes
Step 1 Step 2 Step 3 Step 4 Alcohol
Bath Ion cleaning TiN deposition Cooling
• Equipment - Ultrasonic bath cleaner PVD magnetron sputtering machine
• Sputtering power kW - - 4.0 -
• Substrate temperature ̊C - 300 400 400˗60
• Ion source power kV/A - 0.24/0.4 0.24/ 0.4 0.24/ 0.4
• Substrate bias voltage V - -200 -200 -200
• N2 pressure ×10-3 mbar - - 0.16-1.84 -
• Argon pressure ×10-3 mbar - - 3.66-4.34 4.0
• Turntable speed rpm - 4.0 4.0-9.0 4.0
• Duration min 20 30 150 60
Experimental design. In this study, the experimental matrix was based on RSM centre cubic design, using Design Expert version 8.0 software. It was designed based on 8 factorial points, 6 axial points and 3 central points. In the matrix, the extreme points (operating window) as the +/- Alpha value was designed. Based on the defined extreme point values, the software then dispensed the high and low settings for the factorial points. This is to ensure the characterization could be performed by covering the widest range of operating window.
Surface Profiler. Surface profilometer KLA Tencor model was used to measure the TiN coating thickness. The measurement were taken in three times on three different point. Average of the points was taken as thickness value.
Response Surface Method (RSM). RSM is a collection of mathematical and statistical techniques to model and analyze problems in which responses are influenced by several input variables [10]. The relationship between the input parameters and output responses is defined using regression analysis in form of polynomial equation. In this work, the regression coefficients such as the coefficients of the model variables including the intercept or constant terms were calculated. The model was tested for statistical significance using the analysis of variance approach (ANOVA). The tests for significance of the regression model, significance of individual model coefficient, and lack of fit were calculated.
Result and Discussion
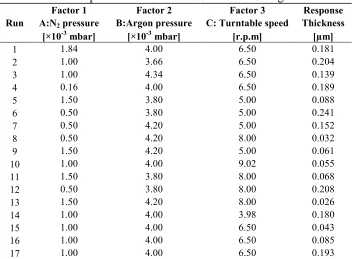
Seventeen experimental runs including output response data are indicated in Table 2. In this study, the analysis of variance (ANOVA) is used to determine the significant factors influencing the TiN coating thickness and the present of interactions affecting the characteristic. As shown in Table 3, the ANOVA analysis indicates that the Argon pressure, N2 pressure and turntable speed are the
significant influencing factors of the TiN coating thickness. From the ANOVA analysis, a linear polynomial equation model for TiN coating thickness is generated as shown in Eq. 1.
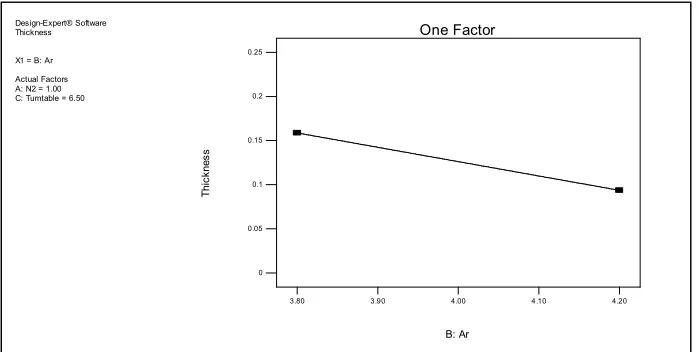
Argon pressure. As shown in Fig. 1, as Argon pressure increases from 3.80×10⁻³ mbar to 4.20×10⁻³
deposition in the process decreases due to increase of the atoms collision after the mean free path in the coating chamber reduced with the present of many Argon atoms.
N2 pressure. As N2 pressure increases from 0.5×10⁻³ mbar to 1.5×10⁻³ mbar, the coating thickness
decreases from 0.156 µm to 0.097 µm. This behavior is showed in Fig. 2. Huang et. al [11] in his study explained that the increased in N2 flow rate resulted in decrease of TiN coating thickness. This
behavior happen when the increase of N2 gas atom in coating chamber decreases the mean free path in
chamber and disturbs the deposition process. By that, the coating thickness become thinner.
Turntable speed. As shown in Fig. 3, the coating thickness decreases from 0.157 µm to 0.096 µm as turntable speed increases from 5.0 rpm to 8.0 rpm, respectively. Chang et al. [12] in study on the microstructure and performances of TiAlN/CrN multi-layer coatings has reported that the thickness of thin films and bi-layer of the TiAlN/CrN coatings decreased when the substrate holder rotation speed increased from 1.5 rpm to 12.0 rpm. By moving faster, the number of sputtered atom that deposited on a the substrate surface also reduced.
Table 2. Experimental run and result of TiN coating thickness
Run A:NFactor 1 2 pressure B:Argon pressure C: Turntable speed Thickness Factor 2 Factor 3 Response
[×10-3 mbar] [×10-3 mbar] [r.p.m] [µm]
1 1.84 4.00 6.50 0.181
2 1.00 3.66 6.50 0.204
3 1.00 4.34 6.50 0.139
4 0.16 4.00 6.50 0.189
5 1.50 3.80 5.00 0.088
6 0.50 3.80 5.00 0.241
7 0.50 4.20 5.00 0.152
8 0.50 4.20 8.00 0.032
9 1.50 4.20 5.00 0.061
10 1.00 4.00 9.02 0.055
11 1.50 3.80 8.00 0.068
12 0.50 3.80 8.00 0.208
13 1.50 4.20 8.00 0.026
14 1.00 4.00 3.98 0.180
15 1.00 4.00 6.50 0.043
16 1.00 4.00 6.50 0.085
17 1.00 4.00 6.50 0.193
Table 3. ANOVA analysis for TiN coating thickness
Source Sum of
Squares df Mean Square F Value p-value Prob > F
Model 0.0392 3 0.0131 3.90 0.0346 significant A-N2 0.0119 1 0.0119 3.56 0.0817
B-Ar 0.0144 1 0.0144 4.31 0.0583 C-Turntable 0.0128 1 0.0128 3.82 0.0725 Residual 0.0435 13 0.0033
Lack of Fit 0.0317 11 0.0029 0.49 0.8252 not significant Pure Error 0.0118 2 0.0059
Cor Total 0.0827 16
Coating Thickness = + 0.96823 - 0.059109pN2 - 0.16259pAr - 0.020406ωTT (1)
Figure 1.Behaviour of TiN coating thickness in response of Argon pressure
Figure 2. Behaviour of TiN coating thickness in response of N2 pressure
Figure 3. Behaviour of TiN coating thickness in response of turntable speed
−
Table 4. Summary of validation run for TiN coating thickness
Input parameters Coating Thickness
TiN coatings were deposited using PVD magnetron sputtering process at different levels of N2 gas
pressure, Argon gas pressure and turntable speed. In this study, the modelling works were done based on RSM technique. The findings of this study have indicated that Argon pressure, N2 pressure and
turntable speed were the significant parameters that influence the deposited TiN coating thickness. Increase in Argon pressure from 3.80×10⁻³ mbar to 4.20×10⁻³ mbar resulted in decrease of the coating
thickness. The increase of N2 pressure from 0.5×10⁻³ mbar to 1.5×10⁻³ mbar also resulted in decrease
of the TiN coating thickness. Then, as increases of turntable speed from 5.0 rpm to 8.0 rpm resulted in decreases of coating thickness from 0.157 µm to 0.096 µm. Finally, the linear polynomial model was validated and showed accurate result in predicting coating thickness with less residual error.
Acknowledgements
The authors would like to thank UTeM and UTM for data and financial support.
References
[1] K. Tuffy, G. Byrne, D. Dowling, Journal of Materials Processing Technology 155-156 (2004) 1861-1866.
[2] M. Farooq, Z.H. Lee, Journal of the Korean Society 40 (2002) 511-515.
[3] L.G. Gonzalez, M.G.G. Romo, J.H. Torres, F.J.E. Beltran, Brazilian Journal of Chemical Engineering 24 (2007) 249-257.
[4] Y. Shi, S. Long, L. Fang, F. Pan, H. Liao, Applied Surface Science 255 (2009) 6515-6524. [5] K. Chakrabarti, J.J. Jeong, S.K. Hwang, Y.C. Yoo, C.M. Lee, Thin Solid Films 406 (2002)
159-163. Experimentation, Productivity Press, Portland, OR, 2000.
[10] D.C. Montgomery, Design and Analysis of Experiments, John Wiley and Sons, New Jersey, 2005.