EXERGY ANALYSIS OF MEMBRANE UTILIZATION FOR
SOLUTION SEPARATION IN LiBr-H
2O ABSORBTION
REFRIGERATION SYSTEM
BAYU RUDIYANTO
THE GRADUATE SCHOOL
BOGOR AGRICUTLURAL UNIVERSITY (IPB) BOGOR
STATEMENT OF RESEARCH ORIGINALITY
Hereby, I state that the dissertation entitled “Exergy Analysis in Membrane Utilization for Solution Separation in LiBr-H2O Absorbtion Refrigeration System”
is my own work, which has never previously been published in any form and any universities. All of incorporated originated from other published as well as unpublished papers are stated clearly in the text as well as in the reference.
Bogor, November 2013
Bayu Rudiyanto
SUMMARY
BAYU RUDIYANTO. Exergy Analysis in Membrane Utilization for Solution Separation in LiBr-H2O Absorbtion Refrigeration System. Supervised by
ARMANSYAH H TAMBUNAN, TSAIR-WANG CHUNG, LEOPOLD O NELWAN and AEP SAEPUL UYUN.
Absorbtion refrigeration system provides prominent advantages in tems of environmental impact and energy consumption. Absorbtion refrigeration system uses natural refrigerant, such as water, which gives no harm to the environment. In terms of energy consumption, it requires heat to regenerate refrigerant from its absorber and provide the refrigeration effect. This form of energy is preferred since heat can be supplied from various sources, including waste heat and renewable energy, and thermodynamically categorized as low quality energy. However, effectiveness of refrigerant regeneration could only be obtained if the temperature is high enough. In this study, the heat utilization in the regeneration process will be eliminated by introducing membranes for separating the refrigerant from the absorber. Specifically, the objectives of this research are to :1) to study the absorbtion mechanism of water vapor by LiBr-H2O solution in a controlled condition, 2) to study the regeneration process of LiBr-H2O using reverse osmosis (RO) membrane and vacuum membrane distillation (VMD) when applied in LiBr-H2O absorbtion refrigeration system, 3) to perform the energy and
exergy analysis in LiBr-H2O absorbtion refrigeration system using RO membrane.
The membrane was used as a tool to separate the refrigerant from absorbent which performs as regeneration process in conventional absorbtion system. As separation component, RO membrane employs pressure to oppose the osmotic pressure and pass certain component through the pores. While, VMD employs vacuum pressure and thermal, so that the substance to be transported through the membrane is in form of vapor. The result shows that absorbtion rate of water vapor by LiBr-H2O solution was influenced by solution concentration,
irreversibity.On the other hand, exergy analysis on VMD shows that higher concentration and temperature will increased irreversibility.
RINGKASAN
BAYU RUDIYANTO. Kajian Exergy Pemanfaatan Membran untuk Pemisahan Larutan pada Sistem Pendingin Absorpsi. Dibimbing oleh ARMANSYAH H. TAMBUNAN, TSAIR-WANG CHUNG, LEOPOLD O. NELWAN dan AEP SAEPUL UYUN.
Sistem pendinginan absorpsi merupakan sistem pendingin yang ramah lingkungan dan menguntungkan dari segi konsumsi energi. Sistem pendingin absorpsi ini menggunakan refrigerant alami, seperti air, yang tidak berbahaya terhadap lingkungan. Dalam hal konsumsi energi, proses pemisahan refrigeran dari absorber membutuhkan energi panas. Bentuk energi panas lebih disukai karena energi panas biasanya merupakan limbah dari proses konversi energi, sehingga di dalam termodinamika panas dikategorikan sebagai energi kualitas rendah, dan dapat diambil dari berbagai sumber, termasuk energi terbarukan. Meskipun demikian, proses regenerasi dapat berlangsung dengan efektip jika suhu digenerator cukup tinggi. Dalam studi ini, pemanfaatan panas untuk proses regenerasi akan dihilangkan dan digantikan dengan teknologi membran.Secara khusus, tujuan penelitianini adalah (1) Mempelajari proses penyerapan uap air oleh larutan LiBr-H2O pada kondisi terkontrol(2) Mempelajari karakteristik
proses pemisahan refrigerant dari larutan LiBr-H2O menggunakan membran
reverse osmosis(RO) dan membrane vakum distilasi (VMD) pada proses regenerasi serta aplikasi pada sistem pendingin absorpsi. (3) melakukan kajian energi dan eksergi pada sistem pendingin absorpsi dengan menggunakan membran RO dan VMD.
Dalam melakukan proses pemisahan, membran RO memerlukan tekanan untuk melawan tekanan osmotik dan melewatkan komponen tertentu suatu larutan melalui pori-porinya. Sementara itu, VMD menggunakan tekanan vakum dan panas, sehingga hanya uap air yang dipindahkan melalui membran. Hasil penelitian pada proses penyerapan LiBr-H2O didapatkan bahwa laju penyerapan
absorbat oleh absorban dipengaruhi oleh konsentrasi larutan, suhu ruang, kelembaban dan tekanan. Laju penyerapan tertinggi dihasilkan pada kondisi suhu 40°C, RH 70% dan konsentrasi larutan 60% yaitu 0.031 gram/menit.Model pendugaan telah dikembangkan untuk menentukan parameter proses absorpsi menggantikan penggunaan diagram P-T-X.Penyerapan uap air tertinggi di absorber pada proses pemisahan larutan LiBr-H2O menggunakan membran RO
terjadi pada konsentrasi awal 30%, yang merupakan konsentrasi tertinggi pada penelitian ini. Peningkatan tekanan operasi pada proses pemisahan LiBr-H2O
akan meningkatkan fluks permeate tetapi akan menurunkan nilai rejeksi. Akan tetapi, permeate hasil pemisahan menggunakan membran RO masih mengandung garam LiBr sebesar 7(w/w %) -9(w/w %), dimana akan berpengaruh pada temperatur pendinginan dan kapasitas pendinginan. Optimisasi proses regenerasi menggunakan VMD dengan response surface methodology (RSM) menunjukkan bahwa permeate fluks tertinggi yaitu 0.93 kg.m-2.s-1didapatkan pada konsentrasi awal 47.5%, temperatur 80°C dan laju alir 1.9 L.min-1. COP sistem
peningkatan tekanan akan meningkatkan irreversibilitas. Sedangkan analisis exergy pada proses pemisahan dengan VMD menunjukkan bahwa peningkatan konsentrasi dan temperatur akan meningkatkan irreversibilitas.
Kata kunci: refrigerasi, absorpsi, reverse osmosis, vacuum membrane distillation,
Copyright 2013 by IPB
All rights reserved
No part or this entire dissertation may be excerpted without inclusion or mentioning the sources. Excerption only for research and education use, writing for scientific papers, reporting, critical writing or reviewing of a problem. Excerption doesn’t inflict a financial loss in the proper interest of IPB.
EXERGY ANALYSIS OF MEMBRANE UTILIZATION
FOR SOLUTION SEPARATION IN LiBr-H
2O
ABSORPTION REFRIGERATION SYSTEM
THE GRADUATE SCHOOL
BOGOR AGRICUTLURAL UNIVERSITY (IPB) BOGOR
2013
The external assessor for close examination are :
Dr.Ir. Irzaman, M.Sc Dr.Ir.Lilik Pujiantoro, M.Sc
The external assessor for open examination are :
Title of Dissertation : Exergy Analysis of Membrane Utilization for Solution Separation in LiBr-H2O Absorbtion Refrigeration
System
Name : Bayu Rudiyanto
Student Number : F164090061
Approved by, Advisory Committee
Prof.Dr.Ir.Armansyah H.Tambunan Chairman
Prof.Dr.Tsair-Wang Chung Member
Dr.Leopold O.Nelwan, S.TP Member
Dr.Aep Saepul Uyun, S.TP,M.Sc Member
Acknowledged by,
Chairman ofAgriculturalEngineeringSciences Graduate Study Program
Dr.Ir.Wawan Hermawan, MS
Dean of Graduate School
Dr.Ir.Dahrul Syah, M.Sc, Agr
NIM : Fi64090061
Approved by,
Ad visory Committee
Prof.Dr.Ir.Armansyah H.Tambunan Chairman
セゥイMw@
Dr.Leopol O.Nelwan, S.TPMember Member
Acknowledged by,
Head of Study Program in
Agricultural Engineering Sciences
PREFACE
Gratitude for His glory and greatness, author prays to Allah SWT for His grace and bless that let author to finish this draft dissertation.
For the completion of this draft dissertation author would like to express my most profound gratitude to Prof.Dr.Ir.Armansyah H.Tambunan as the chairman of the advisory commitee and all members of advisory commitee; Prof. Tsair-Wang Chung, PhD, Dr. Leopold O. Nelwan, S.TP, M.Si and Dr.Aep Saepul Uyun, S.TP, M.Sc for all valuable assistance, support and their tireless and patient counsel. The author also say many thanks to Dr.Ir. Irzaman, M.Si and Dr.Ir. Lilik Pujantoro, M.Agr over his willingness as the external assesor for close examination, and Dr.Ir. Y. Aris Purwanto, M.Agr and Dr.Ir. Lamhot P. Manalu, M.Si as the external assesor for open examination. Thanks the author gave to Rector of Bogor Agricultural University (IPB), the Dean of the Graduate School of IPB, the Chairman of Agricultural Engineering Graduate School Program, and all the lecturer and staff over all the facilities and assistance in studies and his research. The author also say thanks to the director of Politeknik Negeri Jember (POLIJE), the Chairman of Agricultural Engineering Departement of Politeknik Negeri Jember (POLIJE), and all lecturer of his friends in Agricultural Engineering Departement of Politeknik Negeri Jember (POLIJE).
Then, all of his (author) friends in Heat and Mass Transfer of Laboratory (Teti E. Nababan, Johanes FF Sipangkar, Dr. Kiman Siregar, Rosmeika, Agus Susanto Ginting, Christian Solani, Angga Defrian, Gani, Ajen, Wahyudin, M.Sc, Agustino Aritonang, Monalysa Harianca, Tiara Etika, Amalia, Deny F. Situmorang and Ismi Idris), Agricultural Engineering Science Study Program (2009, 2010, 2011), and the Graduate School of Bogor Agricultural University (IPB).
Finally, the authorwould like to dedicate this research work to his family, his wife (Indah Yuli Astuti), his daughter (Kartika Aulia Tsabitah, Sita Hanania Dzakyah), specially for his mother (Hj. Siti Sumarsih) and his father (H.M. Sunarno), his brothers (Gunawan Riyanto, SP and Dr. Bambang Piluharto) for their love, continous encouragement and constant support in his life. The end of the author hope my explain in what has been a writer of dissertations this could be beneficial for writer and in need of them.
Bogor, November 2013
TABLE OF CONTENT
LIST OF TABLE vi
LIST OF FIGURE vii
LIST APPENDIX viii
1 INTRODUCTION 1
Background 1
Problem Formulation 3
Research Objectives 3
Novelty 3
Sistematical Framework of the Research 4
Research Scope 5
Research Benefit 5
2 A STUDY ON THE WATER VAPOR ABSORBTION RATE BY LiBr SOLUTION AS ABSORBENT IN ABSORBTION REFRIGERATION
SYSTEM 7
Introduction 7
Literature Review 9
Method 11
Result and Discussion 13
Conclusion 26
3 REGENERATION PROCESS BY REVERSE OSMOSIS (RO) AND
VACUUM MEMBRANE DISTILLATION (VMD) 27
Introduction 27
Literature Review 28
Method 33
Result and Discussion 37
Conclusion 47
4 EXERGY ANALYSIS ON LiBr-H2O ABSORBTION REFRIGERATION
SYSTEM BASED USING MEMBRANE FOR REGENERATION
PROCESS 49
Introduction 49
Literature Review 49
Method 57
Result and Discussion 58
Conclusion 66
5 GENERAL DISCUSSION 67
6 CONCLUSION AND SUGESSTION 71
Conclusion 71
Suggestion 71
Acknowledgment 71
REFERENCE 72
LIST OF TABLE
Table2-1. Research procedure at temperature 40°C and 45°C 13 Table 2-2. The effect of relative humidity onwater vapor absorbtion 15 Table 2-3 The effect of water vapor pressure on absorbtion rate at 40oC 16 Table 2-4. The effect of water vapor pressure on absorbtion rate at 45oC 16 Table 2-5. Linear equation of each LiBr concentration
at T=40oC and RH=70% 17
Table 2-6. Linear equation of LiBr concentration
at T=45⁰C and RH=70% 19
Table 2-7. Equilibrium concentration at temperature 40oC 21 Table 2-8. Equilibrium concentration at temperature 45oC 21 Table 2-9. The result of Qecalculation and Qe Model BET at 40oC 21
Table 2-10. The result of Qecalculation and Qe Model BET at 45oC 21
Table 2-11. The result of Qecalculation and Qe Model Langmuir at 40oC 23
Table 2-12. The result of Qecalculation and Qe Model Langmuir at 45oC 23
Table 2-13. The result of Qecalculation and Qe Model Freundlich at 40oC 24
Table 2-14. The result of Qecalculation and Qe Model Freundlich at 45oC 24
Table 2-15. Percentage error at temperature 40oC 26 Table 2-16. Percentage error at temperature 45oC 26 Table 3-1. Summary of membrane distillation configuration 31 Table 3-2. Specification material constructions of membrane module 35 Table 3-3. Part number and technical specification of membrane module 35 Table 3-4. Coded and actual designed variables used
for experimental design 37
Table 3-5. Pressure difference in absorber and evaporator 41 Table 3-6. Box-Behnken design and experimental VMD 43 Table 3-7. Analysis of variance (ANOVA) of the RSM model
corresponding to the response: performance index (Y) 44 Table 3-8. Parameter estimates and t-test results 45 Table 4.1. Equation constant by Kim and infante Ferreira 56 Table 4.2. Net balance of energy flow rate in absorbtion refrigeration
system using RO membran at concentration 20% 59 Table 4.3. The energy required for LiBr-H2O separation process using
vacuum membrane distillation (VMD) 60
Table 4.4. Exergy in absorbtion refrigeration system using membrane
at concentration 20% and P=440 kPa 61
Table 4.5. Exergy in absorbtion refrigeration system using membrane
at concentration 20% and P=460 kPa 62
Table 4.6. Exergy in absorbtion refrigeration system using membrane
at concentration 20% and P=520 kPa 62
Table 4.7. Irreversibility in absorbtion refrigeration system using membrane
at concentration 20% 62
Table 4.8. Exergy efficiency in absorbtion refrigeration system using membrane
at concentration 20% 62
Table 4.9. Exergy in absorbtion refrigeration system using VMD
Table 4.10. Exergy in absorbtion refrigeration system using VMD
(Experiment 2: C=50%; T=60°C; flow rate=1.9 g/s 64 Table 4.11. Exergy in absorbtion refrigeration system using VMD
(Experiment 3: C=50%; T=80°C; flow rate=1.9 g/s 64 Table 4.12. Exergy in absorbtion refrigeration system using VMD
(Experiment 4: C=47.5%; T=60°C; flow rate=1.1 g/s 65 Table 4.13. Exergy in absorbtion refrigeration system using VMD
(Experiment 5: C=45%; T=70°C; flow rate=1.9 g/s 65 Table 4.14. Exergy in absorbtion refrigeration system using VMD
(Experiment 6: C=45%; T=60°C; flow rate=1.5 g/s 65 Table 4.15. Exergy in absorbtion refrigeration system using VMD
(Experiment 2: C=50; T=70°C; flow rate=1.1 g/s 66 Table 5.1.Concentration change during separation process using
RO membrane 68
LIST OF FIGURE
Figure 1.1 Sistematical framework of the research 4
Figure 2.1 Absorbtion process 9
Figure 2.2 A continous absorbtions refrigeration cycle 10 Figure 2-3. Functional scheme and climate chamber room 13 Figure 2-4. Water vapor absorbtion at each LiBr solution concentration 14 Figure 2-5. The effect of relative humidity to water vapor absorbtion 15 Figure 2-6. The effect of water vapor pressure toabsorbtion rate
at 40°C and 45°C 16
Figure 2.7 Graph of concentration decrease on LiBr-H2O solution
toward time at temperature 40°C and RH 70% 17 Figure 2-8. Relationship between gradient and concentration at T=40oC 18 Figure 2.9 Graph of concentration decrease on LiBr-H2O solution
toward time at temperature 45°C and RH 70% 19 Figure 2-10. Relationship between gradient and concentrationat T=45oC 20 Figure 2-11. Comparison between QeCalculation and Qe Model BET at 40oC 22
Figure 2-12. Comparison between QeCalculation and Qe Model BET at 45oC 22
Figure 2-13. Interaction between QeCalculation and Qe Model Langmuir at 40oC 23
Figure 2-14. Interaction between QeCalculation and Qe Model Langmuir at 45oC 24
Figure 2-15. Interaction between Qecalculation and Qe Model Freundlich at 40oC 25
Figure 2-16. Interaction between Qecalculation and Qe Model Freundlich at 45oC 25
Figure 3-1. Schematic of reverse osmosis mechanism 29 Figure 3-2. Vapour-liquid surface at each pore of membrane distillation 30 Figure 3-3. Absorbtion refrigeration system using RO membrane 34
Figure 3-4. Experimental VMD set-up 36
Figure 3-5. PVDF hollow fiber membrane module used in this research 36 Figure 3-6. Relationship among operation pressure,
permeateconcentration (%) and mass flux (gr.s-1.m-2) 38 Figure 3-7. Relationship among operation pressure, rejection factor (R)
and mass flux (gr.s-1.m-2) 38
at concentration 30% 39 Figure 3.9. Evaporator temperature during absorbtion process at
concentration 25% 40
Figure 3.10. Evaporator temperature during absorbtion process
at concentration 20%. 40
Figure 3.11. Mass solution changes at C=30% 41
Figure 3-12. Mass solution changes at C=25% 42
Figure 3-13.Mass solution changes at C=20% 42
Figure 3-14. Comparison between the experimental and predicted
VMD performance index (Y) determined by the RSM model 44 Figure 3-15. Prediction profiler of experiment result 45 Figure 3-16. Response surface plot and contour profiler showing
the VMD performance index (Y) as a function of Temperature (°C) and Concentration (%)
for flow rate: 1.5 (L.min-1) 46
Figure 3-17. Response surface plot and contour profile showing the VMD performance index (Y) as a function of flow rate (L.min-1) and Concentration (%)
for temperature: 70 (°C) 46
Figure 3-18. Response surface plot and contour profile showing the VMD performance index (Y) as a function of flow rate (L.min-1) and temperature (°C)
for concentration: 47.5 (%) 47
Figure 4-1. System, surrondings and boundary 50
Figure 4-2. A process from state 1 to state 2 51
Figure 4-3.Thermodynamic cycle with two processes 51
Figure 4-4. Solubility of pure LiBr-H2O 55
Figure 4-5. Entropy of lithium-water solution as a function
of the concentration for different temperature 57 Figure 4-6.Flow diagram of absorbtion refrigeration system
using RO membrane 58
LIST OF APPENDIX
Appendix 1.Calculation of the surface area of the membrane 78 Appendix 2. Calculation of flux at concentration 30% 79 Appendix 3. Exergy in absorbtion refrigeration system using RO membrane
at concentration 20 (w/w %) 80
Appendix 4. Exergy in absorbtion refrigeration system using RO membrane
at concentration 25 (w/w %) 81
Appendix 5. Exergy in absorbtion refrigeration system using RO membrane
at concentration 30 (w/w %) 82
Appendix 6. Exergy in absorbtion refrigeration system using VMD at
concentration 30 (w/w %) 83
Appendix 7. Irreversibility and exergy efficiency in absorbtion refrigeration
1
INTRODUCTION
Background
Recent developments of refrigeration are primarily driven by environmental problems especially the depletion of the ozone layer and global warming. Ozone depletion reduces the ability of ozone layer to protect the earth from ultraviolet radiation. Chlorofluorocarbon(CFC, HCFC), which is used as refrigerant in refrigeration system is considered as substances that caused depletion of ozone layer (ozone depleting substances, ODS). International community addressed this issue in Montreal Protocol on Substances that Deplete the Ozone Layerwhich had been approved in 1987, and ratified by Indonesia in 1992. This protocol declares that international community agrees to stop the utilization of CFC and HCFC as refrigerant. During its development on CFC and HCFC substitution, hydrofluorocarbon (HFC) was believed as free chlorine substance and had similar performance with those two substances. However, nowadays, it reveals that HFC is also believed as a greenhouse gas which causes global warming. Its utilization upon this substance should be decreased as declared in Kyoto Protocol on Climate Change (Sihaloho and Tambunan, 2000). Furthermore, the other major problemis energy crisis marked by the increasing of world oil prices due to the decreasing of reserved fossil fuels especially petroleum fuel.
Considering to the long term effects on refrigerant (freon) utilization and energy crisis, it is necessary to assess new alternatives refrigeration technology which environmentally sound, lower energy consumption, lower cost and easily produced. Absorbtion refrigeration system is reconsidered as a potential alternative that complies with those requirements. Absorbtion refrigeration system was developed in 1850s by Ferdinand Care and became the primary cooling system at that time before the invention of vapor compression refrigeration machine in 1880.
This absorbtion refrigeration system is environmentally friendly as it uses safe refrigerant substance. This refrigeration system uses two different substances i.e. absorbent and refrigerant. LiBr-H2O and NH3-H2O are widely used as
refrigerant-absorber pair in absorbtion refrigeration system.
Absorbtion refrigeration system uses heat energy to operate instead of mechanical energy in the vapor compression system. Thermodynamically, heat is considered as low-grade energy since it is normally generated as the by product of any energy conversion. Heat can also be obtained from solar, biomass, agricultural and animal husbandry waste, and industrial waste heat.
The use of heat in refrigeration cycle is for regeneration process to separate the refrigerant from the absorbent. Separated refrigerant in vapor state will enter condenser for condensation process to produce liquid refrigerant. The liquid refrigerant in evaporator experiences evaporation process by absorbing heat from the environment which produces cooling effect and the generated water vapor is then absorbed by high concentration of LiBr-H2O in absorber. Regeneration
process in generator requires heat at temperature higher than 85oC (Ma, et al, 1998). Vargas et al. (2009) stated that regeneration process using LiBr-H2O in a
80oC will produce un-effective process and low COP (Coeficient of Performance). Furthermore, Sumathy et al. (2002) stated that regeneration process using two-stage absorbtion refrigeration system with heater as the heat source operating at 70°C-85°C has COP as low as 0.39. Meanwhile, according to Gu et al. (2006), regeneration process using LiBr-H2O solution in solar collector which operates at
80-93oC has COP value at 0.725. Moreover, the large contact area required to separate water vapor from LiBr-H2O solution will end in large bulky generator.
Based on the problems, an alternative process such as membrane technology is employed to overcome the utilization of high temperature for refrigerant and absorbent separation.
Application of Membrane technology in absorbtion refrigeration system has been previously reported by several researchers although still focus on the membrane performance. Riffat and Su(1998) used centrifuge reverse osmosis (RO) membrane in a refrigeration system to reduce the utilization of high pressure pump. The research found that rate higher than 10.000 rpm at r=50 mm was required in order to obtain 64% of solution concentration. The disadvantage of this system was the uses of high velocity which corresponds to the increasing of mechanical energy used in the system. Another research was conducted by Wang et al. (2009) who used membrane distillation technology based on PVDF-hollow fiber module for LiBr-H2O separation. In this research, several parameters i.e.
feed flux, temperature in lumen side and vacuum pressure in shell lumen were observed. It was found that the increase of feed temperature and feed flux will increase the water vapor permeation flux. Ahmed and Peter (2009) conducted an experiment to analyze the effect of membrane characteristic towards the absorbtion process in absorber. A good absorbtion performance was obtained from membrane characteristic which has high permeability upon water vapor, uses high pressure hydrophobic membrane to avoid membrane pore wetness, and no water vapor capillary condensation to avoid membrane pore block. Mean while the problem associates with low value of COP in absorbtion refrigeration system should analyze the effectiveness of energy utilization and exergy analysis.
Problem Formulation
Based on the aforementioned back ground situations, it can be drawn that LiBr-H2O separation is a complex problem as its separation process influenced by
the flux parameters.The problems associated with the utilization of membranes for regeneration of refrigerant from its absorber in an absorbtion refrigeration system can be formulated in question tenses, as follows.
1. What is the effect of separation condition using membrane on the characteristic of produced refrigerant? On what conditions does the use of membrane will give the best rejection factor?
2. How is the effect of the use of refrigerant produced from separation process using RO membrane tothe performance of absorbtion refrigeration machine? 3. How does the exergy analysis method explain (a) the efficiency of each process
involved in absorbtion refrigeration system which uses membrane as separation technique, and (b) the quality of energy loss during the entire process in absorbtion refrigeration system?
Research Objectives
The general objective of this research is to analyse the energy and exergy aspect of membrane utilization for regeneration process in a LiBr-H2O absorbtion
refrigeration system. The specific objectives of this research are as follow:
1. To study the absorbtion mechanism of water vapor by LiBr-H2O solution in a controlled condition.
2. To study the regeneration process of LiBr-H2O using reverse osmosis (RO) membrane and vacuum membrane distillation (VMD) when applied in LiBr-H2O absorbtion refrigeration system
3. To perform the energy and exergy analysis in LiBr-H2O absorbtion
refrigeration system using RO membrane and VMD. Novelty
According to the several literatures mentioned, the research of “Exergy Analysis of Membrane Utilization for Solution Separation in LiBr-H2O
Absorbtion Refrigeration System” proposed novelty as follows:
1. This research was conducted to: (a) determine the influence of concentration, temperature and water vapor pressure toward the water vapor absorbtion rate by aqueous lithium bromide solution, and (b) determine the equilibrium concentration of aqueous lithium bromide solution. These studies have not been conducted before.
2. The application of membrane technology in LBARS has not been studied. 3. The exergy analysis on the application of membrane technology for separation
process in LBARS has not been studied.
Thus, the research of “Exergy Analysis of Membrane Utilization for Solution Separation in LiBr-H2O Absorbtion Refrigeration System” had novelty
Sistematical Framework of the Research
This research is focused on the utilization of membrane separation processes for LiBr- H2O solution, water vapor absorbtion by LiBr-H2O solution, as well as
conducting studies on energy and exergy analysis utilization of membrane for separation of absorbtion refrigeration system. Utilization of membrane for separation processes of the LiBr-H2O using two types of membrane that is
Reverse Osmosis (RO) Membrane and Vacuum Membrane Distillation (VMD). This research is carried out through several stages. The main scope of this study is to test the absorbtion of water vapor by LiBr-H2O solution in the absorber, the
permeate flux did against the characteristics and value of rejection to the use of RO membrane and VMD, conduct performance test the RO membrane utilization on absorbtion cooling system, as well as conducting studies on energy and exergy on absorbtion cooling system.
This research includes three parts. The first part of this research is to study and examine the process of absorbtion of water vapor by LiBr-H2O solution in the
absorber. Studying the effects of concentration, temperature and water vapor pressure to water vapor absorbtion by LiBr-H2O solution, to determine
equilibrium concentration of LiBr-H2O solution, to study sorption isotherm model
applicable to the LiBr-H2O absoption mechanism.
The third part of this study was to combine the results of the first and second parts of the research by conducting analyses of energy and exergy as well as conducting an analysis of the process of absorbtion of water vapor by LiBr-H2O
solution in the absorber based on separation process using a membrane. The discussion thoroughly against all the things done in the first part until the latter is expected to provide recommendations for the development of absorbtion refrigeration system (Figure 1.1).
Figure 1.1 Sistematical framework of the research
Membrane
Evaporator
Absorber
Absorber
Reverse Osmosis Membrane Vacuum Membrane Distillation
Water Vapor Absorption by LiBr-H2O Solution
Research Scope
In order to focus on the research objectives, this study is limited to these aspects:
1. Study and examine the process of absorbtion of water vapor by LiBr-H2O
solution in amodeled absorber. In this study, the effects of concentration, temperature and water vapor pressure to water vapor absorbtion by LiBr-H2O
solution will be examined, and equilibrium concentration of LiBr-H2O solution will be determined by evaluating sorption isotherm model applicable to the LiBr-H2O absoption mechanism.
2. Study the characteristic and performance of RO membrane for separation process in LiBr-H2O absorbtion refrigeration system.This study analyzes the
effect of separation condition such as pressure and concentration on the characteristic of permeateion flux, rejection factor and permeate and retentatee concentration that can be achieved. This study also analyzes the effect of RO membrane as separation device on cooling process performance.
3. Study the characteristic and optimization condition of Vacuum Membrane Distillation (VMD) for separation process in LiBr-H2O absorbtion
refrigeration system.This study analyzes the effect of separation condition i.e. temperature, concentration and flow rate on the characteristic of permeateion flux, rejection factor and permeate and retentatee concentration that can be achieved. This study also identifies the optimum condition of temperature, concentration and flow rate towards the achievable permeateion flux for absorbtion refrigeration system application.
4. Perform the energy and exergy analysis on membrane utilization for separation process in LiBr-H2O absorbtion refrigeration system.This study
analyzes (a) the thermodynamic model, (b) energy and exergy analysis to determine the exergy efficiency of RO membrane utilization for separation process in LiBr-H2O absorbtion refrigeration system. This study is also used
to determine the energy loss during the entire process in absorbtion refrigeration system.
Research Benefits
The study of “exergy analysis of membrane utilization for solution separation in LiBr-H2O absorbtion refrigeration system” was expected to generate
several advantages as follows:
1. The application of membrane in LBARS differs from the commonLBARS which uses heat energy for the separation process. The application of membrane technology resulted from this research could reduce the consumption of heat energy and the utilization of large contact area required for water vapor separation from aqueous solution occurred in generator.
2. The utilization of membrane for separation process was expected to produce pure refrigerant.
2 WATER VAPOR ABSORBTION BY LiBr-H
2O SOLUTION
Introduction
Recent developments of refrigeration are primarily driven by environmental problems especially the depletion of the ozone layer and global warming. Ozone depletion reduces the ability of ozone layer to protect the earth from ultraviolet radiation. This problem has been caused by utilization ofchlorofluorocarbon(CFC, HCFC) as refrigerant in refrigeration system. International community addresses this issue in Montreal Protocol on Substances that Deplete the Ozone Layer which had been approved in 1987. Indonesia then ratified this protocol in 1992. This protocol declares that international community agrees to stop the utilization of CFC and HCFC as refrigerant substances. During its development on CFC and HCFC substitution,hydrofluorocarbon (HFC) was believed as free chlorine substance and had similar performance with those two substances. However, nowadays, it reveals that HFC is also believed as a greenhouse gas which causes global warming. Its utilization upon this substance should be decreased as declared in Kyoto Protocol on Climate Change (Sihaloho and Tambunan, 2000). Furthermore, the other major problem is energy crisis marked by the rising of world oil prices due to the decreasing of reserved fossil fuels especially petroleum fuel.
Considering to the long term effects of refrigerant (freon) utilization and energy crisis, it is necessary to asses new alternatives refrigeration technology which environmentally more secure; lower cost and easily produced. Absorbtion refrigerationsystemis a potential technology alternative that complies those requirements. Absorbtion refrigerationsystem was developed in 1850s by Ferdinand Care and became the primary cooling system at that time before the invention of vapor compression refrigeration machine in 1880.As a power source, absorbtion refrigeration system uses heat source to operate instead of mechanical compressor.
Absorbtion is a process of absorbing a subtance by a solution. One of the examples is H2O absorbtion process by LiBr-H2O solution which occurs in
absorbtion refrigeration system. LiBr is a solid salt crystal, which will change into liquid by absorbing water vapor. LiBr-H2O solution which is usually used in
absorbtion refrigeration system is an absorbent. If absorber is in lower vapor pressure than evaporator, it will absorb water vapor. Absorbtion process will stop if absorbent could no longer absorb water vapor from the evaporator. In other words, the system is in equilibrium state. In high concentration, LiBr-H2O
solution will absorb water vapor so the cooling process in evaporator will run appropriately. The increase ofabsorbtion rate will improve the performance of cooling process. The rate of water vapor absorbtion during cooling process is affected by various factors such as absorbent concentration, water vapor temperature that leaves evaporator, and absorbent temperature and water vapor pressure that enters into absorber. In other words, water vapor absorbtion rate is a function of concentration, temperature, humidity and water vapor pressure.
absorbtion produces good performance of cooling process which occurs in evaporator. The increasing concentration of absorbent solution will decrease its pressure which leads to increasing water vapor absorbtion rate. This condition occurs when the water vapor pressure is higher than the pressure of absorbent solution. In terms of temperature, the increasing temperature of absorbent solution will affect the pressure of absorbent solution and water vapor.The increased temperature along with the increased of absorbent and water vapor pressure will decrease the water vapor absorbtion rate. Other factor i.e. relative humidity is also one of the parameter affecting the water vapor absorbtion rate. The increases of relative humidity will increase the water vapor amount in the air so the water vapor absorbtion rate becomes higher. The whole interactions mentions that water vapor absorbtion rate performance which occur in absorber should be supported by low temperature and high relative humidity of water vapor which enter into absorber from evaporator. Those conditions of water vapor will decrease its pressure that enters into evaporator. The temperature of absorbent solution will increase during water vapor absorbtion process. This temperature increment occurs due to adiabatic process which eventually will terminate the water vapor absorbtion process (Stoecker and Jerold, 1989). To overcome this unexpected condition, cooling process should be performed through absorbing the produced heat and releasing into the environment.
A correlation between humidity and moisture content at equal temperature is termed as equilibrium moisture sorption isotherm (Bell and Labuza, 2000). Each product has specific equilibrium moisture sorption due to different interaction (including colligative effect, capillary effect and surface interaction) between water and solid component of different water vapor content.
Generally, the term of absorbtion process is referred as absorbtion isotherm which is defined as a curve which shows correlation between the absorbed material concentrations at certain constant temperature. There are a number of models which can be used to determine absorbtion isotherm, among which are: (1) Freundlich model, (2) Langmuir model, and (3) BET (Brunauer, Emmett and Teller) model.
The performance of sorption isotherm model depends on the ability of mathematical and constants in determining sorption isotherm which are needed to provide theoretical argumentation. Constructed model is generally cannot explain all sorption isotherm model but only enable to predict sorption isotherm model on one of three curves. Employing model is very dependent on the objective. For example, simple model and less number of constantan could provide fittest model (Bell and Labuza, 2000).
The objectives of this research are to: (a) study the effect of water vapor concentration, temperature and pressure on its absorbtion rate performance in absorbtion refrigeration system using LiBr-H2O solution, (b) determine the
equilibrium concentration of LiBr-H2O solution, and (c) determine the sorption
LITERATURE REVIEW
Priciple of the Absorbtion Refrigeration Operation
The working fluid in an absorbtion refrigeration system is a binary solution consisting of refrigerant and absorbent. In Figure 2-1(a), two vessels are connected to each other. The left vessel contains liquid refrigerant while the right vessel contains a binary solution of absorbent/refrigerant. The solution in the right vessel will absorb refrigerant vapor from the left vessel causing pressure to reduce. While the refrigerant vapor is being absorbed, the temperature of the remaining refrigerant will reduce as a result of its vaporization. This causes a refrigeration effect to occur inside the left vessel. At the same time, solution inside the right vessel becomes more dilute because of the higher content of refrigerant absorbed. This is called the absorbtion process. Normally, the absorbtion process is an exothermic process, therefore, it must reject heat out to the surrounding in order to maintain its absorbtion capability.
Figure 2.1 (a) Absorbtion process occurs in right vessel causing cooling effect in the other; (b) Refrigerant separation process occurs in the right vessel as a result of additional heat from outside heat source.
Figure 2.2 A continuous absorbtion refrigeration cycle composes of two processes mentioned in the earlier figure.
Freundlich Sorption Isotherm Model
Freundlich sorption isotherm model assumes that monolayer and adsorbent molecules will be constructed on the absorbent surface. However, this model assumes that those active sites on the absorbent surface are heterogenic. Freundlich sorption isotherm model is defined with equation (2.1) and (2.2):
⁄ (2.1)
(2.2)
Where Qe = adsorbent amount bound on the absorbent surface at equilibrium state (gr adsorbent/gr absorbent), Ce = concentration at equilibrium state (gr adsorbent/ml), K, n = Freunlich constant.
Langmuir Sorption Isotherm Model
This model is based on several assumptions, i.e.: (a) absorbtion occurs in monolayer, (b) absorbtion heat doesn’t depend on covering surface, (c) all sites and surfaces are homogen. This model can be theoretically derived based on the assumption that there is an equilibrium state between absorbed molecules and un-absorbed molecules. Langmuir sorption isotherm model can be expressed as in equations (2.3)–(2.5) :
e
KLCe
KLCe (2.3)
e
KLCe
KLCe (2.4)
e KL Ce (2.5)
where Qe = adsorbentamount bound on the absorbentsurface at equilibrium state
(g adsorbent/g adsorbent), Ce = concentration at equilibrium state (g adsorbent/ml),
KL = Langmuir constant, Q0 = maximum adsorbentbinding capacity (g adsorbent/
g absorbent).
BET Sorption Isotherm Model (Brunauer, Emmet dan Teller)
BET model is the improvement of Langmuir model which is an approach on multilayer absorbtion. The concept of this model is based on assumption that each molecule on the first absorbtion layer covers the upper layer. This molecule prefers to have a contact with adsorbent layer than absorbent layer. This condition is due to the difference of equilibrium constants between the first contact layer and absorbent layer. BET sorption isotherm model can be expressed as follows:
e
KCeC
[ -Ce
C ][ (K- )CeC ]
(2.6) Ce
C e[ -Ce
C ]
(K- )Ce
C K (2.7)
Ce C
e[ -CeC ] [ K (K- )
K
Ce
C] (2.8)
where Qe= adsorbent amount bound on the absorbent surfaceat equilibrium state
(gadsorbent/g absorbent), Q0 = maximum adsorbentbinding capacity (g adsorbent/
gabsorbent), K = absorbtion equilibrium constant, Ce = liquid
adsorbentconcentration at equilibrium state (gadsorbent/ml).
METHOD
This research was conducted by Nababan(2011), using a climate chamber by utilizing the heated air through heater (Figure 2.3). Heated air which came into drying chamber is controlled at certain temperature and relative humidity (RH) in order to obtain required condition. Humidifier was used to control the humidity. Wet hot air was forced into the climate chamber using blower. Incoming rate of air into the chamber was controlled using flow controller. In order to maintain temperature and moisture not higher than the set point, dehumidifier which works on cooling and condensing process was used to discharge heat and water vapor. Two units of independent control subsystem i.e. temperature and humidity controler were implemented to obtain and maintain chamber in set point area. This research used LiBr-H2O concentration at 45%, 50%, 55% and 60%.
Water vapor absorbtion by LiBr-H2O solution was measured at different
-
(2.9) Whereas:
LP : water vapor absorbtion rate (g/minute) MGt : salt weight after absorbtion process (g)
MGa : salt weight before absorbtion process (g)
t : absorbtion time (minute)
In absorber, required temperature was at 30°C-45°C, while in this research, temperature was set at 40°C and 45°C. Water vapor condition in chamber was controlled through setting up humidity and temperature in drying chamber acquisitioned with climate chamber. Temperature sensor using C-C thermocouple connected with Chino Recorder was set at absorbent solution to record temperature change during absorbtion process.
The equilibrium concentration of LiBr-H2O solution was determined using
the gradient at each concentration of 45%, 50%, 55% and 60%. Each gradient was then fitted into linear equation following this equation (2.10):
(2.10)
Where m is gradient magnitude, x is equilibrium concentration, a and b are variable produced from the linear curve.
The determination of equilibrium concentration can also employ P-T-X diagram (pressure-temperature-concentration). This diagram is used by fitting the magnitude of air pressure and temperature of solution. The crossing point between those two parameters is referred as equilibrium concentration of saturated LiBr solution. The amount of bound adsorbent at equilibrium state (Qe) was determined using this following equation:
-(2.11) Where,
Qe : adsorbent amount bound at equilibrium state (g adsorbent/g absorbent) Ce : equilibrium concentration (g/ml)
C0 : initial concentration (g/ml)
m : absorbent amount (g) V : tested solution volume (ml)
The calculation amount on bound adsorbent (QeCalculation) was then compared
with BET, Langmuir and Freundlich model result (QeModel). Moreover, error
generated from Qecalculation and Qemodel were also calculated so it can be obtained the most appropriate sorption isotherm model which was defined from the smallest error. The following equation was used to calculate the percentage error:
| -
Microprocessor
Controller Humidifier
Airflow Regulator
Heating Unit Electrical
Fan
PC
Climate Chamber room
[image:33.595.103.502.70.810.2]Scale
Figure 2.3 Functional scheme and climate chamber room Table 2.1 Research procedure at temperature 40°C and 45°C.
Concentration (%)
RH (%) 45 50 55 60
60 √
70 √ √ √ √
80 √
RESULT AND DISCUSSION
The Effect of Concentration to Water Vapor Absorbtion Rate
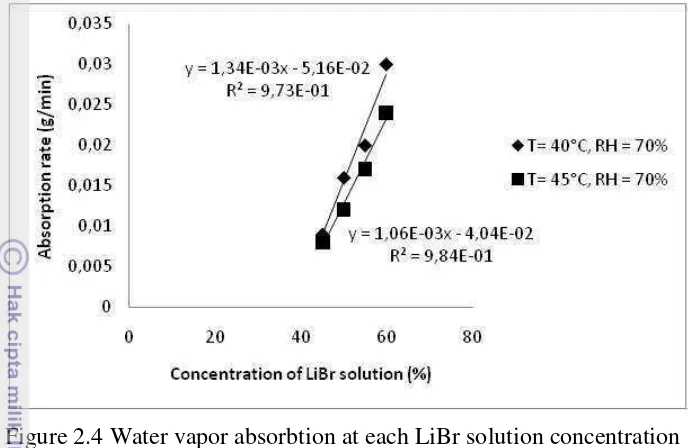
[image:33.595.112.486.87.293.2]Figure 2.4 Water vapor absorbtion at each LiBr solution concentration Another facts gained from previous figure is that treatment under constant concentration and humidity with different temperature (40°C and 45°C) shows increased water vapor absorbtion rate at lower temperature. This condition occurred at each concentration. In term of temperature, lower absorbtion rate occurred at higher temperature.
The coefficient of determination of the linear equation at 40°C and 45°C shown in Figure 2.3 were 0.972 and 0.983, respectively. The gradient magnitude was 0.00134 for 40°C and 0.00106 for 45°C. The gradient magnitude shows that higher absorbtion rate was occurred at increased absorbent concentration.
The Effect of Relative Humidity and Pressure to Water Vapor Absorbtion Rate
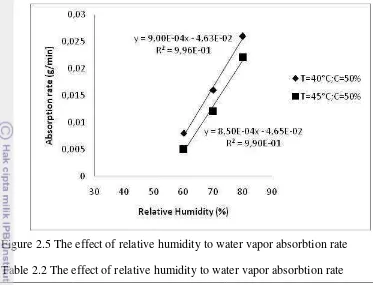
Figure 2.5 The effect of relative humidity to water vapor absorbtion rate Table 2.2 The effect of relative humidity to water vapor absorbtion rate
RH Treatment (%)
Absorbtion rate (g/minute) Absorbtion rate (g/minute)
T= 40°C, C=50% T= 45°C, C=50%
80 0.026 0.022
70 0.016 0.012
60 0.008 0.005
Equation which was employed to calculate water vapor/absorbent pressure at humidity treatment is shown below:
u
a u (2.13)
Whereas: Pu = water vapor pressure (mmHg), Pa = atmospheric pressure (mmHg),
x = humidity ratio (kg/kg dry air), x = value derived from psychometric chart based on the temperature and humidity data.
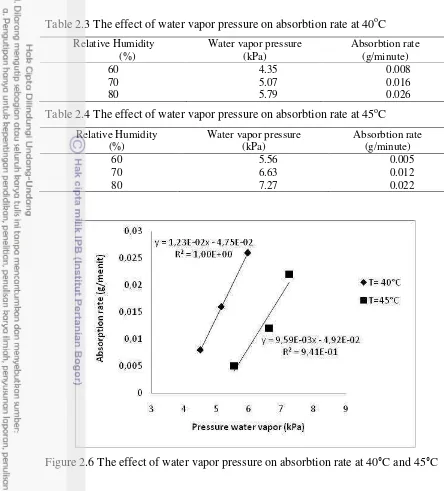
Table 2.3 The effect of water vapor pressure on absorbtion rate at 40oC
Relative Humidity (%)
Water vapor pressure (kPa)
Absorbtion rate (g/minute)
60 4.35 0.008
70 5.07 0.016
80 5.79 0.026
Table 2.4 The effect of water vapor pressure on absorbtion rate at 45oC
Relative Humidity (%)
Water vapor pressure (kPa)
Absorbtion rate (g/minute)
60 5.56 0.005
70 6.63 0.012
80 7.27 0.022
Figure 2.6 The effect of water vapor pressure on absorbtion rate at 40°C and 45°C Equilibrium Concentration at Constant Temperature and Humidity
Temperature 40oC and Humidity 70%
Figure 2.7 Graph of concentration decrease on LiBr-H2O solution toward time at
temperature 40°C and RH=70%
Table 2.5 Linear equation of each LiBr concentration at T=40oC and RH=70%
Gradient value of linear equation was obtained by plotting each previous equation onto x-y curve with x as gradient and y as LiBr solution concentration. The value was then used for determining Ce number at constant temperature and
humidity. Figure 2.8 shows relationship between gradient and concentration at T=40oC and RH=70%.
0 10 20 30 40 50 60 70
0 500 1000 1500 2000 2500
Co
ncent
ra
tio
n L
iB
r
(%)
Time (min)
Concentration 60%
Concentration 55%
Concentration 50%
Concentration 45%
Initial Conc. LiBr (w/w %) Average of Conc. (w/w %) Linear equation R2 Slope
60 56 y=-2.08E-02x+6.04E+01 0.997 -0.021
55 52 y=-1.07E-02x+5.61E+01 0.885 -0.011
50 48 y=-7.62E-03x+5.44E+01 0.993 -0.008
Figure 2.8 Relationship between gradient and concentration at T=40oC Linear equation derived from the curve is y=-631.5x +43.50 with R2=0.939. It could express a condition when x (gradient) was 0 then the concentration was 43.50%. R2 value which closed to 1 showed that the gradient was linearly changed with the decreased of concentration. While equilibrium concentration (Ce) number
expressed that water absorbtion stops at concentration 43.50%.
Gradient equation at 40oC was defined as a function of equilibrium concentration with m=a+bx, whereas x is equilibrium concentration, m is gradient which valued at zero, while a and b is derived from linear equation y=-631.5x +43.50 (Figure 2-7) which determined as a function of concentration.
f(Ce)=43.50-631.5.m ; m=0
f(Ce)=43.50-631.5(0)
Figure 2.9 Graph of decrease concentration on LiBr-H2O solution toward time at
temperature 45°C and RH=70%
Table 2.6 Linear equation of LiBr concentration at T=45⁰C and RH=70%
Table 2.6 presents gradient value of each solution concentration at temperature 45°C and RH 70%. This gradient value was then fitted onto gradient and concentration curve as shown in Figure 2.10.
0 10 20 30 40 50 60 70
0 500 1000 1500 2000 2500
Co
ncent
ra
tio
n L
iB
r
(%)
Time (min)
Concentration 60%
Concentration 55%
Concentration 50%
Concentration 45%
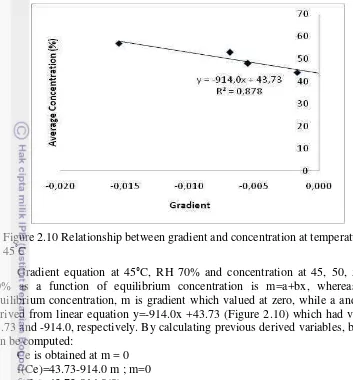
Figure 2.10 Relationship between gradient and concentration at temperature 45°C
Gradient equation at 45°C, RH 70% and concentration at 45, 50, 55 and 60% as a function of equilibrium concentration is m=a+bx, whereas x is equilibrium concentration, m is gradient which valued at zero, while a and b are derived from linear equation y=-914.0x +43.73 (Figure 2.10) which had value at 43.73 and -914.0, respectively. By calculating previous derived variables, bellows can be computed:
Ce is obtained at m = 0 f(Ce)=43.73-914.0 m ; m=0 f(Ce)=43.73-914.0(0)
Ce= 43.73% (equilibrium concentration at T=40°C and RH=70%)
The result showed that equilibrium concentration obtained at 45°C and RH=70% was 43.73% which meant that the absorbtion process stopped when the concentration at 43.73%. This method was one of the methods in determining Ce, in which the widely used method is P-T-X diagram.
Determination of Equilibrium Concentration of LiBr-H2O Absorbent
Solution at Constant Temperature with Different RH
Equilibrium concentration (Ce) is determined as a condition in which no changes in concentration. In other words, it can be said that the system has reached constant state. In this regards, equilibrium concentration was also calculated at each temperature and humidity treatments. These treatments were objected to calculate the amount of adsorbent which trapped on absorbent surface when the solution obtains equilibrium concentration (Qe). Equilibrium concentration was conducted when the measurement didn’t reach the equilibrium concentration.
P-T-X diagram. Saturated concentration of LiBr solution was obtained from the cross point between water vapor pressure and solution temperature. The result of equilibrium concentration obtained from each temperature and humidity treatments are shown as follows:
Table 2.7 Equilibrium concentration at temperature 40°C
RH Co Tsolution Pwater vapor Ce
60 0.5 40.13 4.35 0.37
70 0.5 41.21 5.07 0.34
80 0.5 41.21 5.79 0.29
Table 2.8Equilibrium concentration at temperature 45°C
RH Co Tsolution Pwater vapor Ce
60 0.5 44.40 5.56 0.375
70 0.5 45.90 6.63 0.360
80 0.5 46.61 7.27 0.345
Sorption Isotherm Model
Calculation of sorption isotherm model was objected to determine the amount of adsorbent trapped at absorbent surface at equilibrium state. The result of adsorbentamount trapped on absorbent surface at equilibrium state (Qe) of each model was compared with Qe calculation obtained from observation data.
BET (Brunauer, Emmett and Teller) Isotherm Model
The result of Qe obtained from calculation and BET model at temperature 40°C and 45°C is shown below:
Table 2.9 The result of Qe calculation and Qe Model BET at 40°C
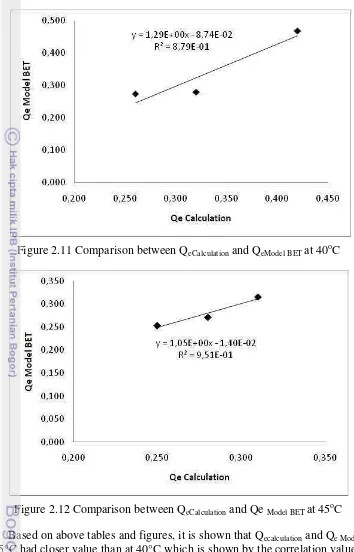
Figure 2.11 Comparison between QeCalculation and QeModel BET at 40oC
Figure 2.12 Comparison between QeCalculation and Qe Model BET at 45oC
Based on above tables and figures, it is shown that Qecalculation and Qe Model BET
at 45°C had closer value than at 40°C which is shown by the correlation value and determinant coefficient.The correlation between Qecalculation and QeModel BET
Langmuir Sorption Isotherm Model
[image:43.595.105.513.148.713.2]The result of Qe obtained from calculation and Langmuir model at temperature 40°C and 45°C is shown below.
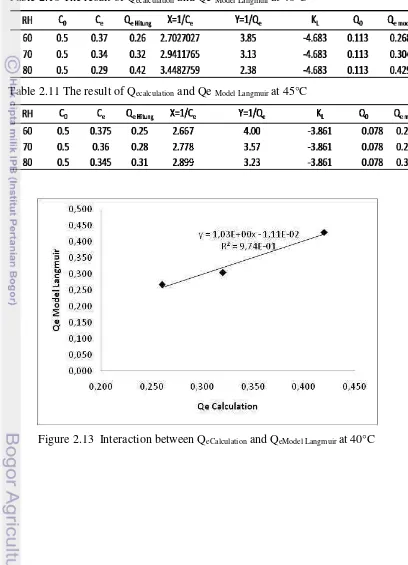
Table 2.10 The result of Qecalculation and Qe Model Langmuir at 40°C
Table 2.11 The result of Qecalculation and Qe Model Langmuir at 45°C
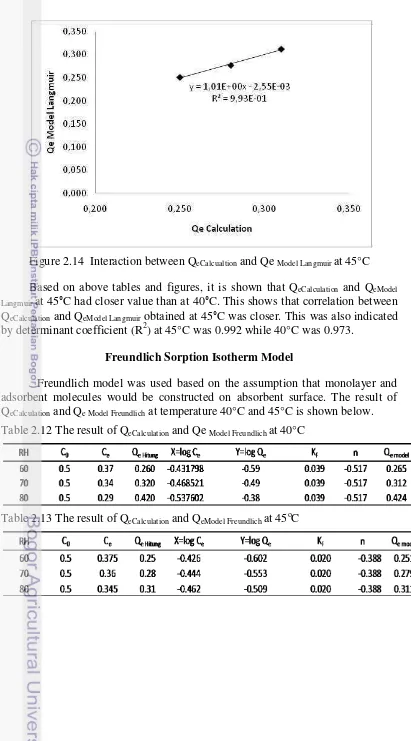
Figure 2.14 Interaction between QeCalcualtion and Qe Model Langmuir at 45°C
Based on above tables and figures, it is shown that QeCalculation and QeModel Langmuir at 45°C had closer value than at 40°C. This shows that correlation between
QeCalculation and QeModel Langmuir obtained at 45°C was closer. This was also indicated
by determinant coefficient (R2) at 45°C was 0.992 while 40°C was 0.973. Freundlich Sorption Isotherm Model
Freundlich model was used based on the assumption that monolayer and adsorbent molecules would be constructed on absorbent surface. The result of QeCalculation and Qe Model Freundlich at temperature 40°C and 45°C is shown below.
Table 2.12 The result of QeCalculation and Qe Model Freundlich at 40°C
Figure 2.15 Interaction between QeCalculation and Qe Model Freundlich at 40oC
Figure 2.16 Interaction between QeCalculation and Qe Model Freundlich at 45oC
Based on above tables and figures, it is shown that Qecalculation and QeModel Langmuir at 45°C had closer correlation value than 40°C. This was indicated by
determinant coefficient (R2) at 45°C was 0.998 while at 40°C was 0.992.
The results obtained from Qe calculation and Qe Model (BET, Langmuir and Freundlich) showed that treatment under 45°C had correlation value higher than 40°C which was indicated by R2 value. This value expressed close correlation between x-axis (Qe Calculation) and y-axis (Qe Model Freundlich). Moreover,
(BET, Langmuir and Freundlich) at 45°C can predict the Qe with acceptable accuracy.
Calculation of Qe on three models (BET, Langmuir and Freundlich) found
that QeCalculation and QeModel Freundlich had the closest correlation. The accuracy
performance of each model was measured using error value. Model which had lower percentage error meant that model had better accuracy performance. Percentage error value of each model at 40°C and 45°C is shown in table below. Table 2.14 Percentage error at temperature 40°C
Table 2.15 Percentage error at temperature 45°C
Table 2.14 and 2.15 shows percentage error as a comparison between Qe calculation and Qe model at temperature 40°C and 45°C. Based on the result above,
it could be shown that in predicting Qe, BET sorption isotherm model had the highest percentage error than Langmuir and Freundlich. While, Freundlich model was the lowest one. So, it could be concluded that Freundlich model had the highest accuracy performance.
Conclusion
1. Absorbtion rate by absorbentwas influenced by solution concentration, temperature, humidity and pressure.
2. The highest absorbtion rate was 0.031 g/minute which was occurred at temperature 40°C, RH 70% and solution concentration 60%.
3. Research found the difference value of equilibrium concentration (Ce) which was obtained from calculation and P-T-X diagram. It might be occurred due to inconsistency treatment which caused by interruption on the equipment.
4. Qe obtained from calculation and model was slightly different. The fittest model based on the percentage error was Freundlich model.
Relative
Humidity Model BET Model Langmuir Model Freundlich
(%) (%) (%) (%)
60 5.602 2.921 1.755
70 12.416 4.929 2.627
80 10.523 2.182 0.928
Percentage error
Relative
Humidity Model BET Model Langmuir Model Freundlich
(%) (%) (%) (%)
60 1.116 0.570 0.278
70 2.896 0.992 0.530
80 1.878 0.651 0.263
3 REGENERATION PROCESS BY REVERSE OSMOSIS
(RO) AND VACUUM MEMBRANE DISTILLATION (VMD)
Introduction
It is known that lithium bromide absorbtion refrigeration system (LBARS) differs from the more prevalent compression chillers in that its cooling performance is driven by heat energy, rather than by mechanical energy. Although the Coefficient of Performance (COP) in absorbtion refrigeration system is much lower than that in compression chillers (Vargas et al., 2009), LBARS tends to have higher energy-saving performance since it can utilize or callback waste heat. With energy shortage and price booming of fossil fuel, low grade energy such as solar energy, geothermal energy and low temperature waste heat energy has become popular in the application of LBARS. However, not all regenerative energy can be used as generator heater because the temperature of most regenerative energy is relatively lower than 85°C (Ma et al., 1998). Traditional single-effect LBARS can’t operate effectively when driven by heat resource below 80°C because of low COP (Vargas et al., 2009), and aqueous lithium bromide solution must be heated to its boiling point so that water vapor can vaporize from the solution and be transported continually. Many different methods have been presented to improve COP of the absorbtion refrigeration system. Gu et al. (2006, 2008) proposed a solar pump-free lithium bromide absorbtion chiller system with a second generator, whose temperature scope was from 80 to 93°C. The average COP of the system was 0.725. Wu et al. (2007) improved the absorbtion refrigeration system by adding a vapor compressor between the generator and the condenser. The vapor compressor could reduce the vapor pressure in generator when the driving heater temperature was too low, and the COP of the system could be adjusted from 0.65 to 0.75 according to the generator temperature. However, the vapor compressor seemed too complicated due to the larger specific volume of water vapor. Ma et al. (1998) and Sumathy et al. (2002) introduced a twostage lithium bromide absorbtion refrigeration system which could apply low temperature heater from 70°C to 85°C. However, the COP was only 0.39 and the system seemed more complicated and the initial cost would increase one third. Moreover, the large contact area needed to separate water vapor from aqueous lithium bromide solution makes traditional generator too bulky and heavy to be fitted into small scale device (Kim et al., 2008). Therefore, from the viewpoint of low grade thermal energy application and facility miniaturization, traditional generator in LBARS seems deficient to some extent.
fiber module for LiBr-H2O separation. In this research, several parameters i.e.
feed flux, temperature in lumen side and vacuum pressure in shell lumen were observed. It was found that the increasing of feed temperature and feed flux will increase the water vapor permeateion flux. Ahmed and Peter(2009) conducted an experiment to analyze the effect of membrane characteristic towards the absorbtion process in absorber. A good absorbtion performance was obtained from membrane characteristic which has high permeability upon water vapor, uses high pressure hydrophobic membrane to avoid membrane pore wetness, and no water vapor capillary condensation to avoid membrane pore block. While the problem associates with low value of COP in absorbtion refrigeration system should analyze the effectiveness of energy utilization and exergy analysis.
The objective of this research is to study the separation characteristic of LiBr-H2O solution using reverse osmosis (RO) membrane, study the characteristic
of separation products during refrigeration process, study was to determine the important parameters in the process of separation-aqueous LiBr and optimal parameter VMD application on absorbtion refrigeration system
LITERATURE REVIEW
Reverse Osmosis Membrane
One of membrane type can be used as a regenerator is the reverse osmosis membrane. A reverse osmosis membrane acts as a barrier to flow, allowing selective passage of a particular species (solvent) while other species (solutes) are retained partially or completely. Solute separation and permeate water (solvent) flux characteristics of membrane depend on the membrane material selection, the preparation procedure, and the structure of membrane barrier layer. Primary separation of solutes occurs at thin film (skin) barrier layer. Two situations may arise depending on the extent of solvent membrane affinity i.e. solvent preferential and solute preferential sorption.
Osmosis is natural phenomenon in which water passes through a semipermeable (no solute flow) membrane from higher solute concentration region until reaches equilibrium at the both sides, solvent (water) chemical potential is restored. At equilibrium the pressure difference between the two sides of the membrane is equal to the osmotic pressure difference. To reverse the flow of water, a pressure difference which greater than the osmotic pressure difference is applied, as a result, separation of water from solution becomes possible. This phenomenon is termed as reverse osmosis or hyper filtration.
Reverse osmosis processes are classified into three types: high pressure RO (5.6 to 10.5 MPa, such a seawater desalination), low pressure RO (1.4 to 4.2 MPa, such brackish water desalination) and nano filtration or “loose RO” ( 3 to 4 MPa, such a partial demineralization or 0 to 20 % NaCl rejection). High and low pressure RO is typically used for very high rejection of inorganics (95 to 99.9% NaCl rejection) and for moderate to high rejection of low molecular weight organics, respectively. Organics rejection depends on membrane polymer types and structures and membrane/solute interactions.
feed flow rate and concentrations of dissolved solutes, types of solutes, trans membrane pressure (Δp), temperature (T), pH and concentration of suspended solids (if any). Any membrane process produces two streams i.e. the permeate (portion of the feed passing through membrane) and the retentatee or concentrate (portion of the feed not passing through membrane). A schematic of RO process is shown in Figure 3-1.
Low Pressure Permeate Side Membrane
Feed RetentateOr Consentrate
High Pressure Side
Solute Consentration :c’ror c’c
Flow rate : Qr or Qc Δp-Δπ = net or effective transmembrane pressure
difference
Δp = transmembrane pressure difference
c’b = bulk solute consentration
c’w=c’wall=solute consentration at membrane surface
Jw=water flux (m/s, cm/s, kg/m2 s, kmol/m2s, gal/ft2 day) C” = permeate solute consentration
Js = solute flux (kmol/m2s, kmol/cm2 s)
Qp = permeate flow rate
Figure 3.1 Schematic of reverse osmosis mechanism
Vacuum membrane distillation (VMD)
Table 3-1. Summary of membrane distillation configuration
Membrane Configuration System configuration System description Application
Direct contact membrane distillation (DCMD)
An aquaeous solution colder than the feed is in direct contact with permeates side of the membrane. Drawback is heat lost by conduction.
Desalination, concentration of aqueous solution in food industries, acids
manufacturing
Air Gap membrane distillation (AGMD)
A stagnant air gas introduced between the membrane and condensation surface. The stagnant air is to reduce heat loss.
Desalination, removing
volatile compounds from aqueous soltion
Sweeping gas membrane distillation (SGMD)
A cold inert gas sweeps the permeate side and carry the vapour molecules to condensate it outside membrane module. The moving gas enhance mass transfer coefficient. Need large condenser
Removing volatile
compounds from aqueous soltion
Vacuum membrane
distillation (VMD)
Vacuum is applied in the permeate side by mean of vacuum pump. Heat loss by conduction is negligible
Separation of aqueous
volatile solution
Both NF and VMD experiment had been conducted on many applications. For desalination purposes, NF usually placed as pretreatment (AM Hassan et al, 2000) for SWRO (sea water reverse osmosis) while VMD is used to reconcentrate SWRO output (Mericq, Laborie, and Cabassud, 2010). VMD coupling gave higher recovery (89%) than NF (70% and 80%). For treatment of dyed water, Bruggen et al. (2001) used NF while Criscuoli et al. (2008) use VMD. NF need pretreatment for its feed since NF flux was depending on the ion concentration of the dye. VMD in other hand do not need pretreatment and the flux was depending on the process condition. Both dye used in the experiment was almost similar in molecular weight, but MD process was depending a little on the molecular weight. Vacuum membrane distillation process condition
Heat and mass transfer that happen in VMD process give consideration about the effect of process condition. The performance of VMD mainly focused on its. Temperature and concentration polarization effect resulted flux. Some process conditions that should be regarded are:
1. Feed Temperature
Heat transfer across the boundary layers is often the rate limiting step for mass transfer in MD, because such a large quantity of heat must be supplied to the surface of the membrane to vaporize the liquid (Lawson and Lloyd, 1997.). The temperature polarization effect thus needs to be reduced. Al-Asheh et.al (2006) found that when the feed temperature increased, the temperature polarization effect will decreased. In another research, Banat et al. (2003) found that increasing the feed bulk temperature results in an exponential increase in the pure water flux, but the mass flux decreases.
2.