The Sustainable Web Portal for Observation Data
Naiyana Sahavechaphan, Jedsada Phengsuwan, Nattapon Harnsamut Sornthep Vannarat, Asanee Kawtrakul Large-scale Simulation Research Laboratory
National Electronics and Computer Technology Center Pathumthani 12120 Thailand
ABSTRACT
In the agricultural domain, observation data has been recognized as an essential resource that drives an efficient decision-making and problem-solving. The application of observation data can be in different shapes depending on consumers. To promote the utilization of observation data to any consumers, this paper thus proposes the conceptual Web Portal for observation data, namely Environment Informatorium or Informatorium. In particular, Informatorium aims at providing a one-stop service that balances the significance of both information providers and consumers. Specifically, it encourages providers to register their services that provide the observation data and are locally deployed at their sites. It also accommodates consumers to query for the desirable observation data across geographically distributed repositories with ease. In addition, it allows consumers to interactively play with different pieces of observation data in a user-oriented manner by integrating or visualizing them altogether.
Keywords : Observation data; Web Portal; Data Access, Data Integration; Data Visualization
Introduction
In the agricultural domain, observation data has been recognized as an essential resource that drives an efficient decision-making and problem-solving. Observation data can be different in term of observation types, geographical locations and time intervals, and is collected by self-organization1, other organizations or both. Depending on information consumers (or simply consumers), the application of observation data can be done in different shapes ranging from simple to complex manners. For example, farmers simply use observation data in the past, present and future along with their instinct knowledge to conduct their activities. Administrators extensively evaluate the correlation of all potential data to make a good advice and plan. Researchers feed the relevant observation data into their scientific models to predict the specified circumstance and hence to guide the desirable directions.
Basically, there is a need for observation data across geographically distributed repositories. Moreover, the integration of different pieces of observation data as well as the visualization of observation data via table, graph and map
1 Self-organization refers to an organization that collects the observation data to serve their decision-making and problem-solving.
must be achieved to support an efficient utilization of information and hence to come up with better actions. Recognizing that these needs are significant, many Web portals have thus been developed. Climate-G [1] and ThaiSDI [3] are service registries. As per a given query, they return links of potential services or repositories that provide the desirable observation data. Here, consumers need to directly connect to each individual repository for acquiring the data and then to manage such data by themselves or hiring experts. HAII [4] federates all potential observation data related to water from different repositories and enables consumers to interactively view graphs by selecting the desirable time periods. However, it is limited to a domain-specific data and doest not facilitate the discovery for correlation of any observation data.
repositories with ease; and (ii) allows consumers to interactively play with different pieces of observation data on-demand. In particular, consumers can select one or more observation data of choice, and then perform the data integration or visualization in a user-oriented manner. Last but not least, Informatorium also takes into account the significance of information providers (or simply providers). It thus allows consumers to realize and acknowledge the potential providers and to accept the agreements issued by providers prior to the data access. Moreover, it collects the history of data access log and returns it to providers based upon the request. Essentially, our Informatorium makes contributions to both providers and consumers, making the Informatorium itself to be “sustainable”. The rest of this paper is organized as follows: Section 2 gives an overall architecture of our Informatorium. Section 3 and 4 detail its underlying systems and core components, respectively. Section 5 concludes the paper.
Informatorium Architecture and Concerns
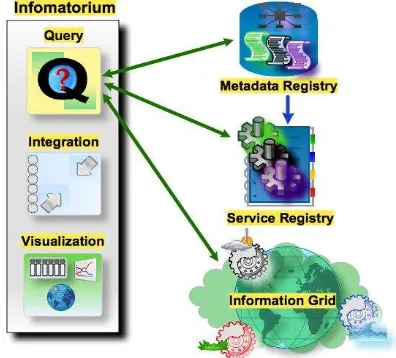
The architecture of Informatorium is given in Figure 2. Essentially, it composes of three core components: Data Query – to retrieve all potential observation data across geographically distributed repositories (or services); Data Integration – to integrate two or more observation data on demand; and Data Visualization – to visualize one or more observation data via table, graph and map in a user-oriented manner. In addition, it needs to interact with the three supporting systems: Metadata Registry – to collect a set of metadata standard that describe observation data; Service Registry – to collect a set of registered services that provide observation data; and Information Grid [5] – to provide the virtualization of geographically distributed repositories.
Figure 2. The Overview Architecture of Informatorium.
To achieve the Informatorium, multidiscipline concerns must be accomplished altogether:
- the standardization of observation data. Here, the metadata standard must be developed to promote the interoperability of observation data both in a single or multiple domain(s). - the transformation of observation data into a
standard format. Here, the observation data described by an in-house metadata should be transformed into a metadata standard of choice.
- the availability of observation data sharing. Here, the publication of observation data should be done in term of services to allow its access at all times.
- the harmonization of conflict among two given metadata standards. Here, the conflict includes structural and semantic mismatch. Essentially, the harmonization of such conflicts accelerates the seamless integration of two or more observation data being described by different metadata standards. - the virtualization of geographically distributed
repositories. Here, this sort of virtual repository efficiently facilitates the one-stop access of any observation data across repositories.
Susporting System
Service registry, metadata registry and information grid altogether enable Informatorium to provide a seamless data access across repositories. Their details are given as following.
A. Service Registry
Today, agricultural and related organizations realize the significance of the observation data publication. They then develop their corresponding services to facilitate the access of their observation data at any time. Essentially, to enable the data interoperability, these services must not only be developed based on standard interfaces (e.g. SOS, WFS and WMS), but also publish observation data with respect to a metadata standard of choice. These services are clearly deployed in a distributed manner at their belonging organizations. To accommodate their access, the service registry must thus be developed. Specifically it (i) facilitate providers to register their profiles along with their services (e.g. SOS, WFS and WMS) and the desirable metadata standard for the observation data; (ii) collect a set of registered services in a centralized registry; and (iii) finds and ranks the potential services as per a given query.
B. Metadata Registry
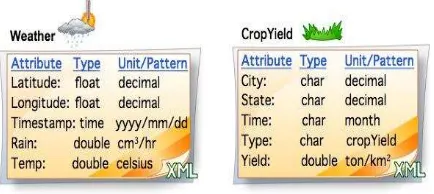
Metadata is data about data. Consider Figure 2 as
an example. Here, “latitude”, “longitude”, “timestamp”, “rain” and “temp” elements altogether define the metadata for weather data, while crop yield
data can be described by five elements “city”, “state”, “time”, “type” and “yield”. Clearly, such metadata
should be standardized and publicly available to providers. This would thus promote providers to publish their observation data based on the same metadata standard and hence to facilitate the data interoperability. Recognizing that XML [4] facilitates the data exchange and interoperability, XML schema has thus been used to define any metadata standard.
Figure 3. Examples of Metadata for Weather and Crop Yield.
Similarly to the service registry, the metadata registry should also be developed to govern standard creators, providers and consumers to realize the availability of metadata standards. Specifically, it (i) facilitates standard creators to register their profiles along with the metadata standards; (ii) collect a set of metadata standards; and (iii) discover the desirable metadata standard as per a query.
C. Information Grid
It is likely that two or more services publishing similar observation data. The access to each individual service can be tedious and time-consuming. There is thus a need for the virtualization of services to enable a single point data access and then to propagate such access to the potential services. This is accomplished by Information Grid or iGrid. Basically, it works side by side with the service registry. Once a provider registers a service into a service registry, the service itself is logically connected to the iGrid. Details of iGrid can be found at [5].
Core Component
The details of data query, data integration and data visualization are given as following.
A. Data Query
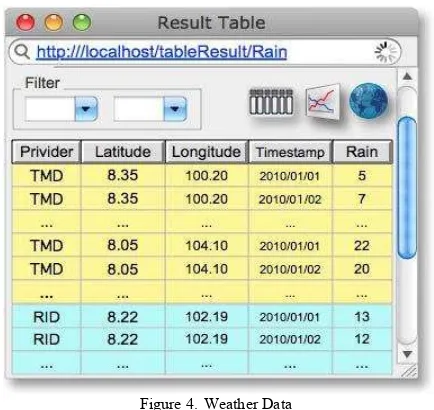
metadata standard, time interval “2010/01/01” to “2010/01/31”, BBOX “(7.38, 99.27, 9.21, 100.16)” and two desirable services provided by “TMP” and “RID”.
Figure 4.Weather Data
Similarly, Figure 4 illustrates the resulting crop yield data according to the CropYield metadata standard, time “January”, state “Nakornsitammarat” and a service “RT”.
Figure 5. CropYield Data
B. Data Integration
It is likely that consumers may want to integrate two or more observation data to evaluate their correlation. Such data can be described by either a single metadata standard or across metadata standards. Basically, the integration of data described by a single or across metadata standards must be done in a vertical or horizontal manner, respectively. The vertical integration can be simply achieved. The horizontal integration, however, requires the linkage or relation configuration of elements defined in two given metadata standards. In particular, the relation configuration must be structurally and semantically defined. The structural relation can be specified via
the corresponding elements, while the semantic relation can be determined based on “is-a” and “is-part-of” perspectives. It should be noted that the metadata service also collects a set of relation configurations of any two given metadata standards.
As an example, Figure 5 depicts the relation configuration of Weather and CropYield metadata standards. Here, the structural relation is defined via the “latitude” and “longitude” elements in the Weather metadata against the “city” and “state” elements in the CropYield metadata. The “latitude” and “longitude” elements in the Weather metadata is part of the “city” and “state” elements in the CropYield depicts the semantic relation.
Figure 6. The Relation Configuration of Weather & CropYield Metadata Standards, and Their Spatial Elements.
Clearly, there is a need for the data integration module. As per a given two data, it (i) discovers the relation configuration based on their corresponding metadata standards from the metadata registry; and (ii) integrates the two data based on the relation configuration. For example, Figure 6 shows the integrated data of Weather data and CropYield data illustrated in Figure 3 and 4 respectively based on the relation configuration in Figure 5.
Figure 7. The Integrated Data of Weather Data & CropYield Data.
C. Data Visualization
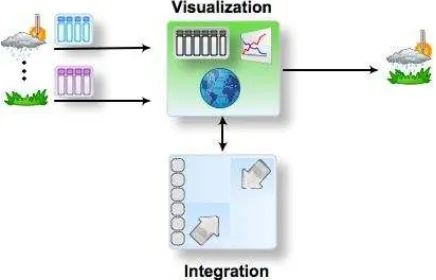
Data should be visualized in an appropriate format (e.g. table, graph and map) to serve an efficient utilization of data. Particularly, both spatial and non-spatial textual data is applicable for table and graph, while the map is suitable for the spatial textual data and map-related image. In addition, the visualization can be applied with one or more observation. The visualization of an individual data can be simply achieved. However, the visualization of two or more observation would rather be complicated and require the harmonization of their corresponding metadata standards. The harmonization is done by the integration module. Figure 7 illustrates the relationship of visualization and integration module.
Figure 8. The Relation of Visualization and Integration Modules.
Figure 9 illustrates the graph visualization of weather data based on there stations (see Figure 4). Here, the x-axis is the date and the y-axis is the amount of rain. Figure 10 illustrates the map visualization of crop yield data along with the weather data.
CONCLUSION
This paper conceptually proposes the Web Portal for observation data, namely Environment Informatorium or Informatorium, to promote the application of observation data to any consumers. In particular, Informatorium aims at providing a one-stop service that balances the significance of both information providers and consumers. Specifically, it encourages providers to register their services for observation data that are locally deployed at their sites. It also accommodates consumers to query for the desirable observation data across geographically distributed repositories with
ease, and to interactively play with different pieces of observation on demand. Currently, Informatorium has been partially developed. Our on-going work would thus be to complete the remaining parts. Future work focuses on public relations to both providers and consumers.
Figure 9. The Graph Visualization of Weather Data.
Figure 10. The Map Visualization of Weather and CropYield Data.
REFERENCES
Climate-G. http://grelc.unile.it:8080/ClimateG-DDC-v1.0/
HAII. http://www.haii.or.th ThaiSDI. http://thaisdi.gistda.or.th/ XML @W3C http://www.w3c.org/xm
Naiyana Sahavechaphan, Kamron Aroonrua, Sornthep Vannarat and Asanee Kawtrakul,