Modeling of SOI-based MRR by Coupled Mode
Theory using Lateral Coupling Configuration
1Hazura H.,
1Menon, P.S,
MIEEE
,
1Burhanuddin Yeop Majlis,
SMIEEE
,
1Hanim A.R,
1Mardiana B.,
2Hasanah, L.,
3
Mulyanti, B.,
4Mahmudin, D.,
4Wiranto, G.,
MIEEE
,
1
Institute of Microengineering and Nanoelectronics (IMEN),
Universiti Kebangsaan Malaysia (UKM), 43600 UKM Bangi, Selangor, Malaysia.
2
Department of Physics Education, Faculty of Mathematics and Natural Sciences Education,
3
Department of Electrical Engineering,
Indonesia University of Education (UPI), Jalan Dr. Setiabudhi 207, Bandung 40154, Indonesia.
4
Research Centre for Electronics and Telecommunications,
Indonesian Institute of Sciences (LIPI), Jl. Sangkuriang, Bandung 40135, Indonesia.
[email protected]
Abstract-We present the modeling of a first order
waveguide-coupled microring resonator (MRR) by coupled mode theory (CMT) using transfer matrix model. The design topology is based on the lateral coupling configuration and single mode propagation which is integrated on a Silicon-on-Insulator (SOI) platform. Performance parameters including Free Spectral Range (FSR) and Quality Factor (Q-factor) are investigated. For verification, we compare these results with the results obtained from the Finite Difference Time Domain (FDTD) commercially available software. We found that both results agree well with each other.
I. INTRODUCTION
Optical waveguide-based devices using evanescent wave are currently applied for a variety of applications. One of the most promising devices is the microring resonator (MRR), which can be employed as a wavelength filter[1], multiplexer[2], sensor[3] and modulator[4].
The device can be modeled by several methods such as Finite Difference Time Domain (FDTD) method [5] and conformal transformation method [6]. Withal, both methods are time consuming. The research on modeling of the optical waveguides structures by Coupled Mode Theory (CMT) has been started in the early 1970’s by researchers such as Yariv [7] and Snyder [8]. CMT provides the interaction description between the circulating waves in the microring and the bus waveguides. The fraction of power exchanged between waveguides is highly dependent on the coupling coefficient, which will determine the microring resonator performance such as Free Spectral Range (FSR) and Quality Factor (Q-Factor).
To date, many studies have been performed to develop the modeling of microring resonators incorporated in the transfer matrix model, which involves complicated calculations and numerous parameter assumptions. We refine each parameter to provide a more understandable model. Based on the model, we studied the effect of major physical characteristic variation on the device performance.
FDTD simulation from RSoft is adopted to validate the accuracy of the analytical model based on the transfer matrix method and CMT.
II. THEORY
A. Device Design
Fig. 1 depicts schematically the MRR-based optical filter under study which comprises of a ring waveguide closely coupled to double straight bus waveguides (Fig. 1(a)) and the cross section of the waveguide structure is shown in Fig. 1(b). The bus waveguides serve as evanescent light input and output couplers, while the ring waveguide acts as the wavelength selective element. R depicts the ring radius, gap is the separation gap between straight and ring waveguide, W is the waveguide width and H is the total waveguide height. The fully etched waveguide structure is considered throughout this study.
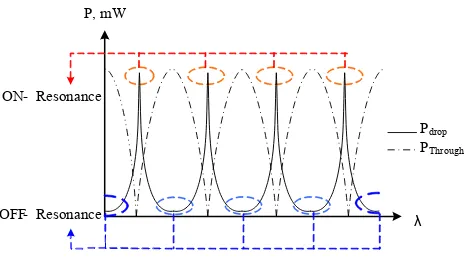
An example of the spectral response of the microring resonator is shown in Fig.2. The microring will be at the ON-resonance state, when the optical path length of a roundtrip is a multiple of the effective wavelength. The light wave will then be transferred to the drop port. On the contrary, if the resonance condition is not complied with, the light wave will be delivered to the through port.
Figure 1. (a) Layout and (b) cross section of the proposed MRR.
422 IEEE-ICSE2012 Proc., 2012, Kuala Lumpur, Malaysia
λ
Figure 2. An example of MRR’s response spectrum.
The substrate cladding is composed of air (n=1.0 at 1.55µm), while the silicon-on-insulator (SOI) platform is chosen for the bus and ring waveguide formation. Lateral coupling is chosen between the bus waveguides and ring waveguides due to fabrication limitation.
B. Coupled Mode Theory and Transfer Matrix Method
One of the most fundamental approaches in the photonic device modeling and design is the coupled mode theory (CMT). This theory describes the expressions for the output transmission in terms of coupling coefficient, effective refractive index, waveguide losses and ring radius. We consider the MRR-based device configuration, comprising of a single ring coupled to a double bus waveguides (please refer to Fig.1). A transfer matrix method (TMM) is integrated with CMT to develop the transfer function of multiple optical waveguides, in our case from input bus waveguide to microring waveguide and then from the microring waveguide to the output or drop port waveguide. The matrix chain form of the TMM eases the signal transmission formulations and is practical to synthesize higher cascaded MRRs.
The basic elements in coupled microring optical waveguides are very similar to directional couplers and delay units. For instance, a single microring coupled to two bus waveguides can be decomposed into an input coupler, a delay unit, and an output coupler, as visualized in Fig. 3.
The transmission of the input and output coupler, P can be calculated by [9]:
(1)
In Eq. (1), is the normalized coupling coefficient of the coupler and t is the transmission coefficient, respectively. The optical phase delay and the waveguide loss, Q is given by:
( ̃ ̃ ) (2)
where R is the ring radius and
~
is the propagation constant which is equal to:Figure 3. Visualization of the couplers and delay unit from microring resonator .
Here, α is the loss per unit length in the microring, o is the free space wavelength and neff is the effective refractive index. The transfer matrix between two bus waveguides is:
Considering only 1 input, c1 will be zero, hence the final transfer functions for the through port |T| and drop port |D| signals are [10]:
R simplified as eq.(7) and eq. (8), respectively.
R
For symmetrical lateral coupling waveguide structures, is analytically computed according to the theory developed in [11]:
2 2
2 -~
= n k
η core o (10)
2 2 2
-~
= nclad ko
γ (11)
It is noted that ko = (2π/ o), ncoreis the refractive index of the core waveguide and nclad is the refractive index of cladding.
The performance of the coupled microring can be evaluated for the FSR and Q-factor. FSR is the frequency separation between two successive resonances and is given by[12]:
eff
g L
n FSR
) (
2 0
(12)
where ng is the group refractive index.
Meanwhile, the Q- factor of the mth resonance is estimated by computing the ratio of the center wavelength to the -3dB bandwidth.
III. RESULTS AND DISCUSSION
The waveguide width, W, the waveguide height, H and the free space wavelength considered in the following cases are 300nm, 550nm and 1550nm, respectively. Fig. 4 depicts the computed effective refractive index, neff of the bus waveguide and the coupling coefficient for TE mode of the microring resonator. The ring radius of 6μm and the gap separation of 100nm is considered in the theoretical calculations. The results show that for a gap of 100nm, the effective refractive index is 2.34 and the coupling coefficient, is 0.861. The effective refractive index obtained from the simulation is 2.36. The deviation between the theoretical calculation for CMT and simulation is therefore less than 0.9%.
Additionally, the coupling coefficient from the simulation is 0.848, which shows only a small discrepancy between both results. We also note that the separation distance between the bus waveguide and the microring waveguide is inversely proportional to the coupling coefficient. It can be concluded that the gap separation plays an important role in optimizing the performance of the microring resonator.
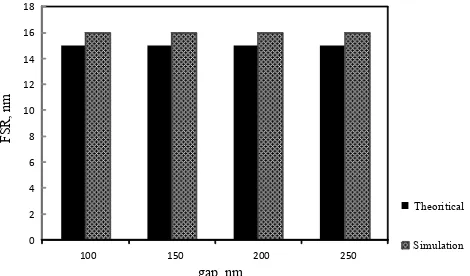
From the CMT analysis, the FSR values were calculated and compared with the rigorous FDTD simulations as shown in Fig. 5. The ring radius values were varied and the FSR was investigated. Results indicate that the FSR is highly dependent on the ring radius. Moreover, it can be noted that the theoretical results agree with the simulation observations. As an example, the highest difference is for R=4μm with FSR of 25nm (simulated) and FSR of 21 nm (theoretical) with 16% deviation and the smallest is 3% difference with R=6μm where FSRsimulated=16nm and FSRtheoretical=15.5nm. The different is possibly due to the discretized nature of the numerically simulated structure. Furthermore, Fig.6 shows that the separation gap has no significant effect on the FSR in which the values remain as we increase the gap size, while the radius is fixed with 6μm.
2.14 2.16 2.18 2.20 2.22 2.24 2.26 2.28 2.30 2.32 2.34 2.36
0.3 0.4 0.5 0.6 0.7 0.8 0.9
100 150 200 250
gap, nm
Coupling c
oe
ffic
ie
nt
,
μ
m
-1
n
eff
Figure 4. Theoretical coupling coefficient and effective refractive index values using CMT.
6 8 10 12 14 16 18 20 22 24 26
4 6 8 10 12 14
Theoritical Simulation
Ring Radius, μm
FS
R
, nm
Figure 5. Theoretical and simulated values of FSR vs ring radius.
0 2 4 6 8 10 12 14 16 18
100 150 200 250
gap, nm
Theoritical
Simulation
F
S
R
, nm
Figure 6. Theoretical and simulated values of FSR vs separation gap.
Fig. 7 plots the influence of gap separation on the Q-factor. It is shown that larger Q-factor is produced at larger separation gaps. The simulations predict a more linear response as compared to the theoretical analysis. This is may be due to human error while observing the data for calculating the theoretical Q-factor value while in simulation, the Q-factor is automatically calculated. The observable Q-factor difference at the separation gap of 0.13μm is 28 which contributes to 2.4% in percentage, while the largest deviation is 5.4%, which can be considered relatively low.
600 800 1000 1200 1400 1600
0.1 0.11 0.12 0.13 0.14 0.15 Theoritical
Simulation
gap, µm
Q
-f
ac
to
r
Figure 7. Q-factor results from theoretical calculations and simulations.
IV. CONCLUSIONS
We have presented the modeling of a lateral configuration microring resonator by Coupled Mode Theory. The influence of the microring parameters such as ring radius and separation gap on the coupling coefficient, FSR and Q-factor have been discussed. In the best case, the Q-Q-factor reaches 1500 and the largest FSR is 16nm. We achieve a good match between the theoretical modeling by CMT and by FDTD simulations, which shows that this method can be reasonably accepted.
ACKNOWLEDGMENT
The authors would like to acknowledge Prof Dr Sahbudin Shaari from IMEN, UKM for his input on Device Modeling. The authors would also like to thank Universiti Teknikal Malaysia Melaka (UTeM) and Malaysian Ministry of Higher Education (MOHE) for the support. This research is supported by funding from Universiti Kebangsaan Malaysia, Industri-2011-015 and GUP-2012-012. UPI and LIPI are
also acknowledged for their contribution via grant no 529/H40.8/TU/2012.
REFERENCES
[1] Hazura Haroon, Mardiana Bidin, Hanim Abdul Razak, Menon P.S, N.
Arsad, “Impact of Coupled Resonator Geometry on Silicon
-on-Insulator Wavelength Filter Characteristics”, IEEE Proc. of Regional Symposium on Micro and Nanoelectronics (RSM 2011), Kota Kinabalu, pp. 380-382, , 2011.
[2] Hazura Haroon, Sahbudin Shaari, P. S. Menon, B. Mardiana, A. R. Hanim, N. Arsad, B. Y. Majlis,W. M. Mukhtar and Huda Abdullah,
“Design and characterization of multiple coupled microring based wavelength demultiplexer in silicon–on–insulator (SOI)”, Journal of Nonlinear Optical Physics & Materials , 2012; 21(1): 1250004-1-8. [3] C.Y Chao, W. Fung, and L.J Guo, “Polymer microring resonators for
biochemical sensing applications”, Optics Express, 2010, vol 18(2), pp.393-400.
[4] S. Shaari, A. R. Hanim, B. Mardiana, H. Hazura and P. S. Menon,
“Modeling and analysis of lateral doping region translation variation on optical modulator performance”, in the 4th Asian Physics Symposium AIP Conference Proceedings, 1325, September 2010, pp. 297–300.
[5] J. V. Hryniewicz, P. P. Absil, B. E. Little, R. A. Wilson, and P. T. Ho,
“Higher order filter response in coupled microring resonators,” IEEE
Photonics Technol. Lett. Vol. 12(3), 2000, pp.320–322.
[6] A. Belarouci, K. B. Hill, Y. Liu, Y. Xiong, T. Chang, and A. E. Craig,
“Design and modeling of waveguide-coupled microring resonator,” J. Lumin, vol (94),2001, pp. 35–38.
[7] Syner, A.W, “Coupled mode theory for optical fiber”, J.Opt. Soc.Am, vol.62, 1972, pp.1267-1277.
[8] Yariv, A., “Coupled-mode theory for guided- wave optics,” IEEE J.Quantum Electron, vol.9, 1973, pp.919-933.
[9] A. Yariv, “Universal relations for coupling of optical power between microresonators and dielectric waveguides,” Electronic Letters, vol. 36, no. 4, 2000, pp. 321-322.
[10] Zen Pheng, “Coupled Multiple Micro-Resonators Design And Active Semiconductor Micro-Resonator Fabrication”, Thesis Dissertation, University Of Southern California, 2007.
[11] B.E. Little, S.T. Chu, H.A Haus, J.Foresi, and J-P. Laine, “Microring
Resonator Channel Dropping Filter”, J.of Lightwave Technol., vol. 15, No. 6, 1997, pp. 998-105.
[12] P. Rabiei, W.H. Steier, Z.Cheng, and L.R Dalton, “Polymer micro -ring filters and modulators,” J. Lightwave Technol., vol, 20, 2002, pp. 1968-1975.
425