9
CHAPTER II
THEORETICAL BACKGROUND AND HYPOTHESIS DEVELOPMENT
2.1. Financial Statements
Financial Statements are a central feature of financial reporting. IAS 1 refers
to financial statements as “a structured representation of the financial position and
financial performance of an entity” and elaborates that the objective of financial
statements is to provide information about an entity’s financial position, its financial
performance, and its cash flow, which is then utilized by a wide spectrum of end
users in making economic decisions. In addition, financial statements also show the
results of management’s stewardship of the resources entrusted to it. A financial
statement should present true and fair picture of the business entity. So, financial
statements are prepared by accountant to give financial information in financial
reporting.
Financial reporting provides information for two broad groups of users, which
are internal users and external users. Internal users are individual or groups inside the
company who has authority to plan, organize, run the business, and make decision
who want to know how the company runs its business from the information provided
in the financial report. There are two commons groups of external users, which are
investors and creditors (Weygandt et al., 2008). In this research, Investors are those
who use the information from financial report to make decision to buy, hold, or sell
stock. If company conducted earnings manipulation through financial statements, it
will impact on misleading of information in investor interest. So, financial statements
should present fairly the financial position, financial performance, and cash flow an
entity as components of financial statements.
2.1.1. Components of Financial Statements
The components of financial statements according International Financial
Reporting standards (IFRS) consist of:
1. A statement of financial position as at the reporting date (end of the reporting
period).
The statement of financial position is a statement that presents an entity’s assets,
liabilities, and equity (net assets) at a given point in time. The statement of financial
position is sometimes described as a “stock” statement because it reflects the balances
of the company’s accounts at a moment in time, as opposed to the other basic
financial statements, which are described as “flow” statements all reflect summarized
results of transactions over a period of time.
The IASB’s framework states that comprehensive income is the change in the
entity’s net assets over the course of the reporting period arising from nonowner
sources. Comprehensive income comprises all components of “profit or loss” and of
“other comprehensive income”.
3. A statement of changes in equity for the reporting period.
Equity (owners’, partners’, or shareholders’) represents the interest of the owners in
the net assets of an entity and shows the cumulative net results of past transactions
and other events affecting the entity since its inception. The statement of changes in
equity reflects the increases and decreases in the net assets of an entity during the
period. In accordance with IAS 1, all changes in equity from transactions with owners
are to be presented separately from non-owner changes in equity.
4. A statement of cash flows for the reporting period.
The purpose of the statement of cash flows is to provide information about the
operating cash receipts and cash payments of an entity during a period, as well as
providing insight into its various investing and financing activities. It is a vitally
important financial statement, because the ultimate concern of investors is the
reporting entity’s ability to generate cash flows which will support payments
(typically but not necessarily in the form of dividends) to the shareholders. More
specifically, the statement of cash flow should help investors and creditors assess
b. The ability to meet obligations and pay dividends
c. Reasons for differences between profit or loss and cash receipts and payments
d. Both cash and noncash aspects of entities’ investing and financing transactions
5. Notes of financial statement.
Information provided in addition to that presented in the financial statements, which
comprise a summary of significant accounting policies and other explanatory
information, including narrative descriptions or disaggregation of items presented in
those statement as well as information about items that do not qualify for recognition
in those statements.
6. A statement of financial position as at the beginning of the earliest comparative
period when the reporting entity applies an accounting policy retrospectively or
makes a retrospective restatement of items in its financial statements, or when it
reclassifies items in its financial statements.
2.1.2. Basic Assumption of Financial Statements
An entity presenting financial statements in accordance with IFRS must
include and explicit and unreserved statement of compliance with all the requirements
of IFRS in the notes. There is two basic assumption accordance IFRS:
When preparing financial statements, management makes an assessment regarding
the entity’s ability to continue in operation for the foreseeable future (as a going
concern). Financial statements should be prepared on a going concern basic unless
management either intends to liquidate the entity or to cease trading, or has no
realistic alternative but to do so. If the result of the assessment cast significant doubt
upon the entity’s ability to continue as a going concern, management is required to
disclose that fact, together with the basis on which it prepared the financial statements
and the reason why the entity is not regarded as a going concern. When the financial
statements are prepared on the going concern basis it is not necessary to disclose the
basis.
b. Accrual Basis of Accounting
Financial statements, excepts for the statement of cash flow, are to be prepared using
the accrual basis of accounting. Under the accrual basis of accounting, an entity
recognizes the elements of financial statements (items such as assets, liabilities,
income, and expenses) when they meet the definition and recognition criteria for
those elements in the framework. Consequently, transactions and events are
recognized when they occur and they are recorded in the accounting records and
presented in the financial statement in the period when they are occurred (and not
when cash is received or paid). For example, revenues are recognized when earned
and expenses are recognized when incurred, without regard to the time of receipt or
2.2. Earnings and Accrual Basis
Indonesian Institute of Accountant (IAI) has its own understanding of Income.
IAI does not translate in terms of profit but in terms of earnings. Income or earnings
is defined as increase in economic benefits during accounting period in form of
revenue or increase in assets or decrease in liabilities that result in equity increase
which not come from capital contribution. Earnings or profit is important information
in financial statement which has various uses in various contexts.
Earnings are the reason corporation exist, and are often the single most
important determinant of stock’s price. Earnings are important to investor because
they give an indication of the company’s expected future dividends and its potential
for growth and capital appreciation. The other important of earnings, earnings as a
basic to determine investment policy and taking a decision, measure performance of
company, evaluation management performance, estimation of ability of a company to
earn long-term earnings, predict future cash flow, and measure investment ratio and
certain company credit.
Earnings measurement based on accrual basis which is different with cash
basis. Accrual basis admits the impact of transactions on financial report in a certain
period when revenues and expenses occurred. Therefore, revenue is recorded when it
manipulation practices, the accountants or parties conducted these activities through
financial statements and commonly those financial statements based on accrual basis.
Although earnings as well as we know as measurement of performance that is
very useful, but the components accrual in them have trouble in valuation. Research
Sloan (1996) shows that investors fail to correct the value of total accruals because
investors overestimate the persistence of the accrual. The study suggests that
abnormal accruals can be obtained through the acquisition of companies with low
accruals and selling companies with high accruals. This phenomenon is then referred
to accrual anomaly. Subrahmanyam (1996) show that how discretion of components
accrual valued by investors. The results of these studies indicate that managers use
discretion over accruals to smooth earnings (earnings management practices) and
provide signal information to investors about the company's future performance, it
shows that the observed rational market pricing.
2.3. Earnings Management and Agency Theory
Scott (2003:369) defines earnings management as ''the choice by a manager of
accounting policies so as to Achieve some specific objectives" which means the
choices made by managers in determining accounting policy to achieve some specific
goal. The concept of earnings management using the approach of agency theory
between the interests of management (agent) and the owner (principal) arising from
each party trying to reach or consider the level of prosperity that pleases".
Agency theory has assumed that each individual is solely motivated by
self-interest, giving rise to a conflict of interest between principal and agent. Principal
parties entered into motivated to improve the life of his contract with the
ever-increasing profitability. Agent is motivated to maximize the fulfillment of economic
and psychological needs, among others, in terms of obtaining an investment, loan, or
contract compensation. Conflict of interest is increasing mainly because the principal
cannot monitor the activities of daily management to ensure that management is
working in accordance with the wishes of the shareholders (owners).
In an agency relationship, the principal does not have enough information
about the agent's performance. Agents have more information about their own
capacity, work environment, and the company as a whole. This has resulted in an
imbalance of information held by the principal and the agent. Imbalance of
information is called the asymmetry of information. The assumption that individuals
act to maximize his own, resulting in agent utilizes its information asymmetry to hide
some information that was not known to the principal. Asymmetry of information and
potential conflicts of interest between principal and agent encourages agents to
provide information that is not true to the principal, especially if the information
relates to the measurement of agent performance. One form of agent action is referred
2.3.1 Motivations of Earnings Management
According Scott (2011), motivations for earnings management is explained as
follows:
1. Bonus Plan Purposes
Profit is often used by company to measure management performance. Commonly,
firms set the targeted profit to be achieved in the certain period, so that the managers
are forced to achieve the target. All other are being equal, managers of the firms with
bonus plans are more likely to choose accounting procedures that shift reported
earnings from future periods to current period. Managers, like everyone else, would
like to have high remuneration. If their remuneration depends on a bonus related to
the reported net income, then they tend to report the net income as high as possible, in
order to get higher current bonus.
2. Covenant Purposes
Earnings management for covenant purposes is predicted by debt covenant
hypothesis of positive accounting theory. Because covenant violation can impose
heavy costs, firm managers are expected to avoid them. They will also try to avoid
being close to violation, because it will constrain their freedom of action in operating
the firm. Therefore, earnings management appears as a device to reduce the
3. Implicit Contracting Purposes
The investigation of earnings management for implicit contracting purposes is done
by Bowen, DuCharme, and shores (1995). It is said that implicit contracting purposes
can be bolstered by high reported profits. This high of reported profits will increase
stakeholders’ confidence that the manager will continue to meet contractual
obligations. Implicit contracting purposes arise from continuing relationship between
the firm and its stakeholders and represent expected behavior based on past business
dealings.
4. Investors Earnings Expectation
Investors’ earnings expectation can be formed through several strategies. For
example, the strategy may be based on earnings for the same period last year on
recent analyst or company forecast. Firms which report earnings more than what is
expected will enjoy a significant increase of share price as investors revise upwards
their probabilities of good future performance. As a result, managers have a strong
incentive to ensure that earnings expectations are met, particularly if they hold
share-related compensation.
5. Companies’ Reputation
To maintain companies’ reputation, the managers have to be able to show to the
investors that companies have a good performance. To do this, at least managers must
financial statement on time without implausible explanation (Barton and Mercer,
2005)
6. Initial Public Offerings
In definition, firms which make initial public offerings do not have an established
market price. This raises question of how to value the shares of such firms. The
assumption that financial accounting information is included in the prospectus is a
useful information source. There is an empirical evidence that the market responds
positively to earnings forecasts as a signal of firm value (Clarkson, Dontoh,
Richardson, and Sefcik, 1992). This raises the possibility that the managers of firms
going public may manage the earnings reported in their prospectuses in order to
receive higher price of theirs shares.
2.4. Earnings Manipulation
Earnings Manipulation is the other side of earnings management. Firms’
management may have a motive to give a misleading picture regarding the true
financial position of a firm. They may attempt to influence reported income in order
to increase their remuneration through accounting-number based bonus schemes, and
to secure their position in the firm. Within this context managers may try to
manipulate the reported earnings towards a particular direction. Earning’s
profits’ manipulation can seriously damage investors’ interests (Paltrow, 2002).
Firm’s managers can influence the reported figures of the firms by the selective
application of particular reporting policies. One of the objectives of the corporate
governance mechanisms is to restrain a possible tendency of the firm’s management
to influence reported accounting figures (Chalevas and Tzovas, 2010).
In other words, Earnings manipulation is possible while carrying out earnings
management if the financial report preparers violate accounting statutes and
guidelines.
2.4.1. Techniques of Earnings Manipulation
According McGregor1, some of the techniques used to manage and
manipulate earnings will be discussed below:
a. "Cookie-jar" Reserves
The accrual of expenses is to reflect the period in which the expense was incurred.
For example, if a firm hires a consultant to perform a particular activity, it should
reflect the expense related to that activity in the period in which it is incurred, not
when the bill is paid or invoice received. In many cases, the accrual of expenses, or
reserves in particular industries such as insurance and banking, are based on
estimates. As such, the estimates have varying degrees of accuracy. During times of
strong earnings, the firm establishes additional expense accruals and subsequently
1The source of these techniques above were taken by researcher in google based on Scott Mcgregor paper with title earnings
reduces the liability to generate earnings when needed in the future - pulling a
"cookie from the jar".
b. Capitalization Practices - Intangible Assets, Software Capitalization, Research and
Development
In 1997, companies were allowed to capitalize the costs of internally developed
software and amortize it over the useful life, generally three to five years.
Capitalization is to represent the development costs. The capitalization process of
companies has the potential for manipulation because these assets are often intangible
and based on judgment. A firm may allocate more expenses to a project that can be
capitalized to reduce current operating expenses.
c. "Big bath" One-Time Charges
Unusual or non-recurring charges have become one-technique used by firms to
escape the maze of over aggressive accounting practices. Many believe and anecdotal
evidence has shown that analysts overlook non-recurring charges because they are not
part of the firm’s ongoing operations or operating income. Typical non-recurring
charges include writing down assets, discontinuance of an operating division or
product line and establishing restructuring reserves.
As discussed previously, firms practicing earnings management deplete the economic
they may seek an event that can be characterized as one-time event and "overload"
the expenses attributable to that event. The one-time charge may be discounted by
analysts as not being part of operating earnings while the stock price does not suffer
the consequences normally associated with missing earnings targets. To provide itself
with more "cookie jar" reserves or mask its past sins, the firm may take other
write-offs or create other accruals not directly tied to the event and attribute those expenses
to the one-time event.
A study by Elliot and Hanna (1996) reported that reports of large, one-time items
increased dramatically between 1975 and 1994. In 1975, less than 5% of companies
reported a large negative write-off compared to 21% in 1994. The authors also
showed that companies that had previously reported similar write-offs were more
likely to do so.
d. Operating Activities
Managers often have the ability to modify the timing of events such that the
accounting system will record those activities in the period that is most advantageous
to management. The activity does not alter the long-term economic value of the
transaction, just the timing and thus, comparability of financial statements. For
example, a company could accelerate its sales and delivery process such that it
records sales in December that normally would have been reported in January. Thus,
the company would ultimately report the same sales and profits; however, it has
inflated its growth in the near term, and reduced profits in the future period.
e. Merger and Acquisition Activities
One type of significant event that may be used to mask other charge-off is mergers
and acquisitions. In most cases, there is some form of restructuring involved creating
the need for a large one-time charge along with other merger-related expenses. The
event provides the acquirer with the opportunity to establish accruals for restructuring
the transaction, possibly attribute more expense than necessary for the transaction.
The company may also identify certain expenses that are revalued on the seller's
balance sheet, increasing goodwill. If the conservative valuations prove to be
excessive, the company is able to reduce its operating expenses in the near term by
reducing its estimate for the liability. The additional goodwill created would be
amortized over a long period of time and not have a significant impact on near term
results.
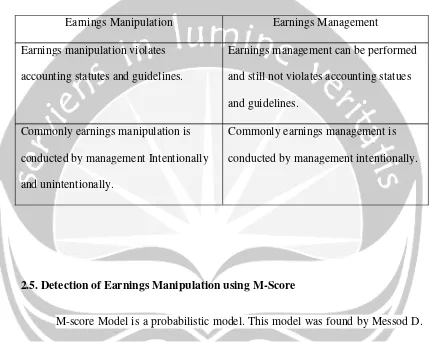
2.4.2 Earnings Manipulation and Earnings management
The differentiation between earnings manipulation and earnings management
Table 1
Earnings Manipulation and Earnings Management
Earnings Manipulation Earnings Management
Earnings manipulation violates
accounting statutes and guidelines.
Earnings management can be performed
and still not violates accounting statues
and guidelines.
Commonly earnings manipulation is
conducted by management Intentionally
and unintentionally.
Commonly earnings management is
conducted by management intentionally.
2.5. Detection of Earnings Manipulation using M-Score
M-score Model is a probabilistic model. This model was found by Messod D.
Beneish in year 1992 in United State of America as the company samples and his
paper was published in year 1999. As the first, Beneish tested using a sample of 74
firms that manipulate earnings. From his research, Beneish found that sample
manipulators typically overstate earnings by recording fictitious, unearned, or
uncertain revenue, recording fictitious inventory, or improperly capitalizing costs.
Therefore, Beneish estimate model for detecting earnings manipulation from year
media search and total sample from his research is 2406 company samples. Based on
his evaluation in year 1992, the model form “profile of a typical earnings
manipulator” as defined by Beneish (1999a) is a company that is (1) growing quickly
(extremely high year-over-year sales growth), (2) experiencing deteriorating
fundamentals (as evidenced by a decline in asset quality, eroding profit margins, and
increasing leverage), and (3) adopting aggressive accounting practices (e.g.,
receivables growing much faster than sales, large income-inflating accruals, and
decreasing depreciation expense). So, M-score to help to uncover companies who are
likely to be manipulating their reported earnings. Companies with a higher score are
more likely to be manipulators. M-score model is a probabilistic model and it will not
detect manipulators with 100% accuracy.
This model features eight accounting-based variables, each of which is so
constructed that higher values are associated with a greater probability of earnings
manipulation. A description of the variables and the rationale for their inclusion are
provided below:
1. Days Sales in Receivables Index (DSRI):
DSRI is the ratio of daily sales in receivables in the first year in where
earnings manipulation was found (in t) of the appropriate size on year t - 1. This
variable is a measure of whether the accounts receivable and revenue are in or out - of
be the result of a change in policy to spur sales credit in the face of increased
competition, but the increase disproportionate relative sales in receivables may also
indicates revenue inflation. Large increase in Daily sales in receivables that will be
associated with the possibility higher incomes and profits those were excessive.
2. Gross Margin Index (GMI)
GMI is the ratio of gross margin in year t - 1 to the gross margin in year t.
GMI is greater than 1; indicate that the margin Gross profit has deteriorated. Lev and
Thiagarajan (1993) showed that the decrease in gross profit margin is a negative
signal about the prospects company. If firms with little prospect more likely to
involved in the manipulation of earnings, there is a positive relationship between
GMI and the possibility of earnings manipulation.
3. Asset Quality Index (AQI)
Quality assets in a given year is the ratio of non-current assets other than
assets fixed property , plant and equipment ( PPE ) to total assets and measures the
proportion of total assets that have benefits in the future potentially uncertain . AQI is
the ratio of asset quality in year t, the relative quality of the assets in year t - 1. AQI is
a measure aggregate of changes in asset risk analysis suggested realization by Siegel
(1991). If AQI is greater than 1 indicates that potentially increasing the company's
involvement in the suspension costs.
SGI is the ratio of sales in year t to sales in year t - 1. Growth does not mean
manipulation, but the growth of the company regarded by professionals as more
likely to commit fraudulent financial statements for the financial position and needs
capital put pressure on managers to achieve earnings targets (National Commission
on Fraudulent Financial Reporting (1987), National Association of Certified Fraud
Examiners (1993)). In addition, concerns about control and reporting tend to be
slower than operating in the high growth period (National Commission Reporting
Financial Fraud (1987), Loebeckke et al. (1989)).
5. Depreciation Index (Depi):
Depi is the ratio of the rate of depreciation in year t - 1 compared with level
corresponding to the level of depreciation of year t. In particular equal to the
depreciation / (depreciation + netPPE). Depi greater than 1 which shows that the rate
at which assets are depreciated has slowed - Increase the likelihood that the company
has revised upward the estimated useful lives of the assets or adopt new methods
increase in revenue
6. General and Administrative Expenses Sales Index (SGAI)
SGAI calculated as the ratio of SGA to sales in year t relative the appropriate
size in year t - 1. Variables used follow Lev and Thiagarajan’s suggestion (1993) that
analysts will interpret the proportional increase in sales as negative signal about the
7. Leverage Index (LVGI)
LVGI is the ratio of total debt to total assets in year t relative the
corresponding ratio in year t - 1. A LVGI greater than 1 showed an increase in
leverage. Variable is included to get debt covenants incentives for earnings
manipulation. With leverage assumption that follow a random walk, LVGI implicit
measure forecast error leverage.
8. Total Accruals to Total Assets (TATA)
Accrual amount is calculated as the change in working capital accounts other
than cash less depreciation. Total or partial accrual thereof has been used in prior
work to assess the extent to which managers make discretionary accounting choices
to change earnings (Jones, 1991).
Earnings Manipulation according to this model is a company that has an M-score
exceeded -1.78.
2.6. Stock Return
In this research, stock return is represented by Abnormal Return. Efficient
capital market is a market that will react quickly to all relevant information. This is
indicated by the change in price stock exceeds normal conditions, giving rise to
abnormal return (Zaqi, 2006). Information held by the investor will be transformed in
Testing information content is meant to see the reaction of an announcement. If the
announcement contains information, the market is expected to be react at the time of
the announcement is received by the market. Market reaction is indicated by the
change in the price of the relevant securities where this reaction can be measured by
abnormal returns (Jogiyanto, 2005). Budiarto and Baridwan (1999), states that the
market reaction as a signal to the existence of a specific event information can affect
the value of companies which reflected changes in the price and trading volume of
the stock happens. The investors can make observations about the information stock
trading volume that occurred. It also can perform observations on trading volume
information associated with price stock. Stocks with high trading volume will
generate a return high stock.
According Jogiyanto (2003 : 109), return is the result was obtained by
investement activities. Return can be Realized return that has been happening and
expected return that has not yet occurred but is expected to happen in the future.
Realized return is a return that has happened. Realized return is calculated based on
historical data. Realized return is important because it is used as one measure of
performance of the company. Historical return is also useful as a basis for
determining the expected return and risk in the future .
According Jogiyanto (2003 : 109), Expected return is the return which is
expected will be earned by investors in the future. Unlike the Realized returns that
Expected return is a return that is used for making investment decisions. Return is
significant compared to historical returns due to an expected return on the investment
made.
While abnormal return is the excess of actual return to normal return. Here,
normal return is the expected return (expected by investors). Therefore, abnormal
return is the difference between the actual return that occurs with the expected return
(Jogiyanto, 2003:434). Abnormal return is the one that commonly used as a
measuring tool to measure market reaction to the information content of an event
conducted by the issuer. An event is said to have contents of information if it will
provide abnormal returns to the market, otherwise an event that have no information
contents will not give abnormal return to the market.
2.7. Previous Research
In this section, will be described previous research as the idea of researcher in
conducting this research. In Beneish, Lee, and Nichols (2013) with title Earnings
Manipulation and Expected Return used Probability of manipulation (M-score model)
to detect earnings manipulation and the impact of conducting earnings manipulation
to stock return. In their paper, they calculated M-score with eight variables, there are:
Days Sales in Receivables Index (DSRI), Gross Margin Index (GMI), Asset Quality
Administrative Expenses Sales Index (SGAI), Leverage Index (LVGI), Total
Accruals to Total Assets (TATA) as the independent variable and stock return as the
dependent variable. The result of their research stated that if higher of M-score will
be lower of stock return.
Again in Roychowdhury (2006), researcher detected manipulation to avoid
losses, he investigated patterns in CFO, discretionary expenses, and production costs
for firm. According researcher, company value reflected by stock price. If company
conducted earnings manipulation, it will impact to decrease of company value.
Decreasing of value here means lower stock price and the impact goes to decreasing
of company stock return.
In Abarbanell J and B.Bushee (1997) with title Fundamental Analysis, Future
Earnings, and Stock Prices discusses about evidence that accounting-based signals
defined to reflect familiar concepts of fundamental analysis can be used to predict
future abnormal return. The signals pertaining to changes in gross margin and selling
expenses also appear to capture information underused by the market about earnings
beyond one year and/or risk. In their paper, we could see those signals will effect to
company stock return
Previously, Beneish (1999) with title Detection Earnings Manipulation
discussed about detection earnings manipulation and the result stated that earnings
variables that will be used therefore in 2013 in Beneish, Lee, and Nichols with title
Earnings manipulation and expected return.
2.8. Hypothesis Development
According Beneish, Lee, and Nichols (2013), they discriminate manipulator
and non-manipulator with used flag and not flagged with cut off -1.78. With Flag
signs as manipulator if the M-score exceeded –1.78 and not flag signs as
non-manipulator if M-score is not exceeded -1.78. Here, in their research, suggest that
flagged companies (those that merely look like manipulator) are associated with
lower returns.
Same result with Roychowdhury (2006), according researcher company value
reflected by stock price. If company conducted earnings manipulation, it will impact
to decrease of company value. Decreasing of value here means lower stock price and
the impact goes to decreasing of company stock return. Again, in Abarbanell and
Bushee (1997), according researcher there is any fundamental signals and future
earnings, clearly we could see those signals will effect to company stock return.
Financial report is one of the important information to investors because it can
be used as a basis for decision making (buy or sell stock) in the capital market. The
financial statements have information content that can reduce the uncertainty or
(2000), financial report publication has impact on market. According to his
observation, there is investors’ reaction towards share ordinary earnings of
publications around the date of publication. Testing for the publication of the
information content of annual earnings report found evidence that this will have an
impact on the earnings announcement to abnormal stock price performance. Its mean
market will react on financial report announcement.
Market reaction can be positive market reaction or negative market reaction.
Market reaction conducted purchase action indicates a positive reaction, as investors
have hopes for the future prospects of the company, the reverse reaction of the market
when conducted stock selling action is a negative reaction, because it considers the
company experienced a decline in earnings in the future so that the investor decides
to sell the stock. In other words, the market reaction reflected by the actions of
investors can be divided into sell stocks; buy stocks, and still holds the stocks. Market
reaction in the form of action to sell and buy shares will impact to stock prices and
the impact will go to stock returns finally.
Again, in Jogiyanto (2008), research study examines the market reaction to
the events because the event has informative contents and market will react to the
events that contain information. An event can be described as a surprise or something
unexpected. The bigger surprise will impact to the bigger market reaction. Market
reaction of an event is proxied by the abnormal return. Abnormal return is zero
events that occur, it will be obtained abnormal returns significantly different from
zero. Sign of abnormal return positive or negative indicates a direction of the market
reaction is due to the good news or worse. Good news events are expected to react
positively by market, and vice versa, the bad news will react negatively by market.
An event or information regarded as good news or news poorly linked to the
economic value it contains. If an event or information contained economic value
increases the value of company, then categorized as good news. If the incident
contain economic value lowers the value of the company, including as bad news.
The result of earnings manipulation will impact to the lower quality of
earnings. Here, the impact of lower quality of earnings will impact to investor will
make a decision to reduce stock demand. Then, the impact of lower stock demand
will go to the lower stock price and decreasing company return as the impact. So, as
the decision maker, investor needs to determine first their decision to invest or not to
the company especially company which conducted earnings manipulation activities.
So, based on the description above, researcher concluded this hypothesis below: