PRICE DISCRIMINATION ANALYSIS OF BUTTER
IN THE GERMAN MARKET
ACHMAD FADILLAH
GRADUATE SCHOOL
BOGOR AGRICULTURAL UNIVERSITY
BOGOR
STATEMENT OF THESIS, SOURCE OF INFORMATION
AND COPYRIGHT*
I hereby declare that thesis titled Price Discrimination Analysis of Butter in the German Market, was independently composed by me under the advisory committee supervision and has not been submitted to any other universities. Source of information derived or quoted from works published and unpublished from other writers have been mentioned in the text and listed in the bibliography at the end of this thesis.
I hereby assign the copyright of my thesis to the Bogor Agricultural University.
Bogor, May 2015
Achmad Fadillah
H451110221
SUMMARY
ACHMAD FADILLAH. Price Discrimination Analysis of Butter in the German Market. Supervised by RITA NURMALINA, AMZUL RIFIN, and STEPHAN VON CRAMON-TAUBADEL.
Germany is the largest producers of butter among other countries in the EU. The trend of butter production in Germany increase steadily during 2010 –
2013. In 2013, butter production in Germany reach to 491 460 tons and German’s
butter production amounted to 25% of the EU butter production. So, Germany has
an advantage in butter production compared with other countries in the EU. The
advantage in butter production and stock availability of butter strongly supports the development of food industry in Germany.
However, there were fluctuations in the average price of butter in Germany during 1999-2010 and it was occurred from year to year. Fluctuation of butter prices can affects business risk, the competition of butter producers, and
economic surplus of consumers in the German butter market.One of the strategies
which can be done by producers and retailers to survive in the competition is establish right price strategy, such implement price discrimination strategy. Price discrimination strategy aims to get consumer surplus, to increase profits, and to face business competition.
The main objective of the study is to analyze butter price discrimination in German market. In detail, objectives of this study are: first, to analyze the necessary conditions (market power, different demand elasticity, and preventing arbitrage) of occurrence in price discrimination of butter products in the German market through structure analysis, second, to analyze demand function of butter products based on types of retail store in Germany, third, to analyze price discrimination of butter products based on regions in Germany, and fourth, to analyze price difference of butter products across types of retail store in Germany.
The result shows that the three necessary conditions (market power, different demand elasticity, and preventing arbitrage) for the occurrence of butter price discrimination in the German retail market are fulfilled. The butter industry in Germany has an HHI value of 1 635 and the four-firm concentration ratio (CR4) index reached 71%, which indicates that the German butter industry has either a moderate level of market concentration and an oligopoly market structure with some dominant firms. The oligopoly butter market structure in Germany is dominated by four producers of butter, are: Irish Dairy Board, Campina, Sachsenmilch, and Arla Foods. Market power in an oligopoly is also greatly influenced by some main producers who also produce private label products.
We also can conclude that on the demand side, butter consumption is not discriminating along the demand curve (price and quantity) across regions in Germany. On the supply side, producers and retailers are not discriminating in regards to butter prices across regions in Germany. The mean price of butter in Germany, throughout different regions, remained relatively similar at a range of between € 5.02/kg - € 5.20/kg between 2005 and 2010.
Based on semi – log model regression, the price of butter sold at a DM store is approximately 27% higher than the same butter sold at a supermarket store. Prices are approximately 8% lower at a discounter, on average, than the same product at a supermarket store, while butter sold at a hypermarket store is approximately 1.75% lower than the same butter sold at a supermarket store, on
average.In other words, there is evidence of butter price difference across types of
retail store in Germany.
One of managerial implications which can be suggested for butter retailers and producers based on the results of this study is implemention of pricing strategy according to different consumers’ demand elasticity to increase their profits in the market. In addition, butter producers and retailers can apply branding strategy through selling various types and brands to different consumers based on different demand elasticity.
Recommendation for further research, are: to analyze the discrimination of price in the retail market, which focus in different products or commodities and different locations (markets, countries, etc.) to further support these research results. Future studies might also examine the characteristics of consumers and consumer perspective in relation to price discrimination in retail stores. And study of the occurrence of the welfare effect with regard to price discrimination could also being an interesting complement to this study.
RINGKASAN
ACHMAD FADILLAH. Analsis Diskriminasi Harga Mentega di Pasar Jerman. Dibimbing oleh RITA NURMALINA, AMZUL RIFIN, dan STEPHAN VON CRAMON-TAUBADEL.
Jerman adalah produsen mentega terbesar diantara negara-negara lain di Uni Eropa. Kecenderungan tren produksi mentega di Jerman terus meningkat selama 2010 - 2013. Pada tahun 2013, produksi mentega di Jerman mencapai 491 460 ton dan produksi mentega Jerman mencapai 25% dari total produksi mentega Uni Eropa. Sehingga, Jerman memiliki keunggulan dalam produksi mentega dibandingkan dengan negara-negara lain di Uni Eropa. Keunggulan dalam produksi mentega dan ketersedian stok mentega sangat mendukung perkembangan industri pangan di Jerman.
Namun, terdapat fluktuasi harga rata-rata mentega di Jerman selama tahun 1999-2010 yang tejadi dari tahun ke tahun. Fluktuasi harga mentega ini dapat mempengaruhi resiko bisnis, kompetisi antar produsen mentega, dan surplus ekonomi dari konsumen pada pasar mentega Jerman. Salah satu strategi yang dapat dilakukan oleh produsen dan pelaku ritel untuk dapat bertahan dalam kompetisi tersebut adalah dengan menerapkan strategi harga yang tepat, seperti menerapkan strategi diskriminasi harga. Strategi diskriminasi harga bertujuan untuk mendapatkan surplus konsumen, untuk meningkatkan keuntungan, dan untuk menghadapi persaingan bisnis.
Tujuan utama dari studi ini adalah untuk menganalisis diskriminasi harga
mentega di pasar Jerman. Secara rinci, tujuan dari studi ini adalah: pertama, untuk
menganalisis kondisi-kondisi yang harus dipenuhi (kekuatan pasar, perbedaan elastisitas permintaan, dan pencegahan arbitrase) agar diskriminasi harga produk mentega di pasar Jerman dapat terjadi melalui analisis struktur, kedua, untuk menganalisis fungsi permintaan produk mentega berdasarkan jenis pasar ritel di
Jerman, ketiga, untuk menganalisis diskriminasi harga produk mentega
berdasarkan wilayah di Jerman, dan keempat, untuk menganalisis diferensiasi
harga produk mentega diantara tipe pasar ritel di Jerman.
Hasil studi menunjukkan bahwa ketiga syarat kondisi terjadinya diskriminasi harga mentega di pasar ritel Jerman semuanya terpenuhi, yaitu: adanya kekuatan pasar, perbedaan dalam elastisitas permintaan, dan pencegahan arbitrase. Industri mentega di Jerman memiliki nilai HHI 1 635 dan indeks rasio
konsentrasi empat perusahaan (CR4) mencapai 71% yang mengindikasikan bahwa
industri mentega Jerman memiliki konsentrasi pasar dengan tingkat moderat dan struktur pasar bersifat oligopoli dengan beberapa perusahaan yang dominan. Struktur pasar oligopoli mentega di Jerman didominasi oleh empat produsen mentega, yaitu: Irish Dairy Board, Campina, Sachsenmilch, dan Arla Foods. Kekuatan pasar dalam oligopoli juga sangat besar dipengaruhi oleh beberapa
produsen utama yang juga memproduksi produk private label.
Kita dapat menyimpulkan bahwa ketiga kurva permintaan (hypermarket,
supermarket, dan discounter) memiliki kemiringan kurva negatif atau berbentuk
menurun ke bawah (penurunan progresif dari kiri atas ke kanan bawah). Kondisi ini sesuai dengan teori permintaan bahwa harga dan kuantitas memiliki hubungan
adalah -3.701, -2.883 di supermarket, dan -5.517 di discounter (nilai terbesar ini
menunjukkan bahwa discounter paling elastis dibandingkan dengan tipe toko ritel
yang lain).
Kita juga dapat menyimpulkan bahwa pada sisi permintaan, konsumsi mentega tidak mengalami diskriminasi sepanjang kurva permintaan (harga dan kuantitas) antar wilayah di Jerman. Pada sisi suplai, produsen dan pelaku ritel tidak melakukan diskriminasi harga mentega berdasarkan wilayah di Jerman. Harga rata-rata mentega di Jerman, diseluruh wilayah yang berbeda, relatif sama
pada rentang harga € 5.02/kg - € 5.20/kg antara 2005 sampai 2010.
Berdasarkan regresi model semi-log, harga mentega yang dijual di toko DM sekitar 27% lebih tinggi dari mentega yang sama yang dijual di supermarket.
Harga mentega di discounter sekitar 8% lebih rendah secara rata-rata
dibandingkan dengan produk yang sama di supermarket, sedangkan mentega yang dijual di hypermarket secara rata-rata lebih rendah sekitar 1.75% dari mentega yang sama yang dijual di supermarket. Dengan kata lain, terdapat bukti adanya diferensiasi harga mentega antar tipe toko ritel di Jerman.
Salah satu implikasi manajerial yang dapat disarankan untuk pelaku ritel dan produsen mentega berdasarkan hasil penelitian ini adalah menerapkan strategi
harga berdasarkan perbedaan elastisitas permintaan konsumen untuk
meningkatkan keuntungan mereka di pasar. Selain itu, produsen dan pelaku ritel
mentega dapat menerapkan strategi branding dengan menjual berbagai tipe dan
merek mentega untuk konsumen yang berbeda berdasarkan perbedaan elastisitas permintaan.
Rekomendasi untuk studi lebih lanjut, adalah: menganalisis diskriminasi harga di pasar ritel, yang berfokus pada produk atau komoditas dan lokasi yang berbeda (pasar, negara, dan lainnya) untuk mendukung hasil penelitian ini. Penelitian selanjutnya dapat juga menguji karakteristik konsumen dan perspektif konsumen terkait dengan diskriminasi harga di pasar ritel. Dan penelitian mengenai adanya pengaruh kesejahteraan yang berkaitan dengan diskriminasi harga juga dapat menjadi komplemen yang menarik untuk penelitian ini.
© All Rights Reserved by Bogor Agricultural University, 2015
Copyright Reserved
It is prohibited to quote part or all of this paper without including or citing the source. Quotations are only for purposes of education, research, scientific writing, preparation of reports, critics, or review an issue; and those are not detrimental to the interest of the Bogor Agricultural University.
PRICE DISCRIMINATION ANALYSIS OF BUTTER
IN THE GERMAN MARKET
ACHMAD FADILLAH
Thesis
as one of requirements to obtain a degree of
Magister Sains in
the Study Program of Agribusiness
GRADUATE SCHOOL
BOGOR AGRICULTURAL UNIVERSITY
BOGOR
Thesis Tittle : Price Discrimination Analysis of Butter in the German Market
Name : Achmad Fadillah
Registration Number : H451110221
Approved
Advisory Committee,
Prof Dr Ir Rita Nurmalina, MS Chairman
Dr Amzul Rifin, SP, MA Member
Prof Dr Stephan von Cramon-Taubadel Member
Agreed
Coordinator of Major Agribusiness
Prof Dr Ir Rita Nurmalina, MS
Dean of Graduate School
Dr Ir Dahrul Syah, MScAgr
ACKNOWLEDGMENT
First of all, praise to Allah the Almighty for all His blessings on all stages of this research process. Having the opportunity to study in Georg-August University Göttingen, Germany gave me one of the most precious experiences in my life. I feel grateful to finally finish my thesis with all the efforts and supports I received from all parties.
I would like to express my deepest appreciation to my 1st supervisor Prof.
Dr. Ir. Rita Nurmalina, MS who was abundantly helpful and offered invaluable assistance, guidance and full support. It also gives me great pleasure in
acknowledging the support and help of Dr. Amzul Rifin, SP, MA, as my 2nd
supervisor. Moreover, my gratitude goes to my supervisors in Georg-August Universität Göttingen, Germany, Prof. Dr. Stephan v. Cramon-Taubadel, for his guidance and his help provide the data.
I would like to thank both Georg-August Universität Göttingen, Germany and Bogor Agricultural University, Indonesia, which played a big role in assisting and giving me the opportunity to partake in the joint degree master program in Sustainable International Agriculture. The program was initiated and advised by Prof. Dr. Stephan v. Cramon-Taubadel and Grete Thinggaard-ter Meulen, M.Sc from Germany and Dr. Ir. Nunung Kusnadi, MS, Dr. Ir. Suharno, M.ADev, Dr. Ir. Andriyono Kilat Adhi, and Prof. Dr. Ir. Rita Nurmalina, MS from Indonesia. My scholarships was provided by the Indonesian Planning and Cooperation of Foreign Affairs (BPKLN) and the Directorate General of Higher Education (DIKTI), Indonesian Ministry of Education, DAAD, the German Federal Foreign Office, and International Office of Georg-August Universität Göttingen.
My deepest gratitude goes to my lovely parents and family who always supported and encouraged me with their dedication during my study. Finally, I am indebted to my many friends and colleagues who supported and gave me invaluable relationships. They consist of all Indonesians in SIA program 2012 (Göttinger Zwölf), SIA program 2011 and 2013, MSA-IPB, Göttingen Indonesian Student Community (PPI Göttingen), KALAM Göttingen, all proofreaders, and all my new international friends in Germany.
Bogor, May 2015
v
CONTENTS
LIST OF TABLES ... vii
LIST OF FIGURES ... vii
LIST OF APPENDICES ... viii
1 INTRODUCTION ... 1
Background ... 1
Problem Statement ... 4
Objectives of the Study ... 5
Benefits of Study ... 6
Scope and Limitation of the Study ... 6
2 LITERATURE REVIEW... 7
The Types of Price Discrimination in Empirical Studies ... 7
The Types of Data that can be Used for Price Discrimination Analysis ... 8
Implementation of Pricing Strategy in Retailing ... 8
Characteristics of Consumers and Pricing Strategy ... 9
Evidence of Price Discrimination in Retailing Based on Empirical Studies . 10 3 THEORETICAL FRAMEWORK ... 12
The Definition of Price Discrimination ... 12
The Types of Price Discrimination ... 13
Relationship Between Price Discrimination and Agricultural Markets ... 15
The Nature of Price Discrimination and Its Result (SCP Analysis) ... 16
Necessary Condition - Structure ... 17
How to Identify Price Discrimination – Conduct ... 18
The Results of Price Discrimination – Performance ... 20
The Concept of Price Difference of Products ... 21
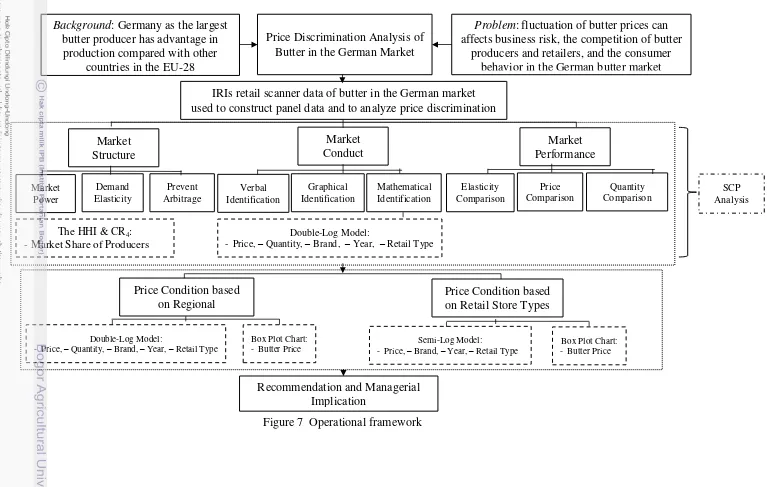
Operational Framework ... 23
4 RESEARCH METHODOLOGY ... 24
The Research Location... 24
Data Types and Sources ... 24
Methods of Analysis ... 26
Descriptive Analysis ... 26
Model of Price Elasticity ... 28
Model of Price Difference ... 28
Model of Price Discrimination... 29
Goodness of Fit Test of Models ... 30
Economic Criteria ... 30
Statistical Criteria... 30
Econometric Criteria ... 31
5 OVERVIEW OF BUTTER MARKET IN GERMANY ... 32
The EU Dairy Market Policy Related to Butter Market ... 32
Development of EU Market Price of Butter ... 34
Butter Exports and Import in Germany ... 34
6 RESULT AND DISCUSSION ... 39
The Necessary Conditions of Occurrence Butter Price Discrimination in the German Retail Market (The Structure Analysis)... 39
Market Power ... 39
Different Price Elasticity of Demand ... 42
Prevent Arbitage ... 44
How Butter Price Discrimination Occurs in The German Retail Market (The Conduct Analysis) ... 45
Verbally ... 45
Graphically ... 48
Mathematically ... 53
The Results of Price Discrimination Related to Price and Demand Quantity of Butter (The Performance Analysis) ... 54
Butter Price and Demand Condition Across German Regions ... 55
Butter Price Condition in the German Retail Market in 2005-2010 ... 57
7 CONCLUSION AND RECOMMENDATION ... 60
Conclusion ... 60
Recommendation ... 60
REFERENCES ... 61
APPENDICES ... 67
vii
LIST OF TABLES
1 The EU dairy products production in 2010-2013 (in 1 000 tons)... 2
2 The EU balance sheet of butter in 2010-2013 (in 1 000 tons) ... 2
3 The EU butter production across country 2010-2013 (in tons) ... 3
4 Summary of butter price data in the German retail market 2005-2010 (in €/kg) ... 5
5 Summary table of some previous empirical studies ... 11
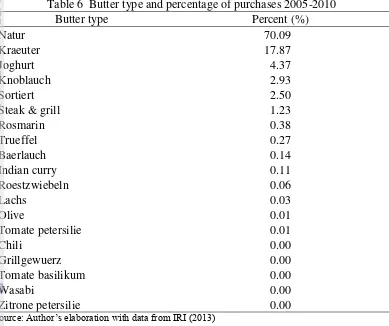
6 Butter type and percentage of purchases 2005-2010 ... 25
7 Levels of competition and the HHI ... 27
8 Levels of competition and the CR4 (in %) ... 27
9 Alternative hypotheses for t-test ... 30
10 Identification framework for autocorrelation ... 31
11 Export import butter ((HS code 0405) in Germany (2009-2013) ... 36
12 The German retail market business types in 2011 ... 37
13 Quantity of sales and market share of top ten butter producers and private label products in Germany 2010 ... 40
14 List of four largest producers of butter in Germany 2010 ... 41
15 Classified quantile group of butter brands by mean price 2010 ... 42
16 Quantile’s representative brand based on mean price 2010 ... 43
17 Butter brands, price, and demand in hypermarket store ... 46
18 Butter brands, price, and demand in supermarket store... 47
19 Butter brands, price, and demand in discounter store ... 47
20 Demand function estimation of butter based on the types of retail store... 53
21 Transaction data of natural butter across German regions 2005-2010 ... 55
22 Regression results of butter demand across regions in Germany 2005-2010 ... 56
23 Summary of butter price by retail store type (per kg) ... 57
24 Price differential regression results with supermarket retail store type and year 2005 as baseline of model ... 59
LIST OF FIGURES 1 Milk production of the largest producers of milk in the world 2000-2012 (in tons)... 1
2 Comparative historical overview of wholesale and retail price of butter in Germany 1999-2010 ... 4
3 Second degree price discrimination ... 13
4 Third degree price discrimination ... 14
5 Graphical presentation of price discrimination... 19
7 Operational framework ... 23
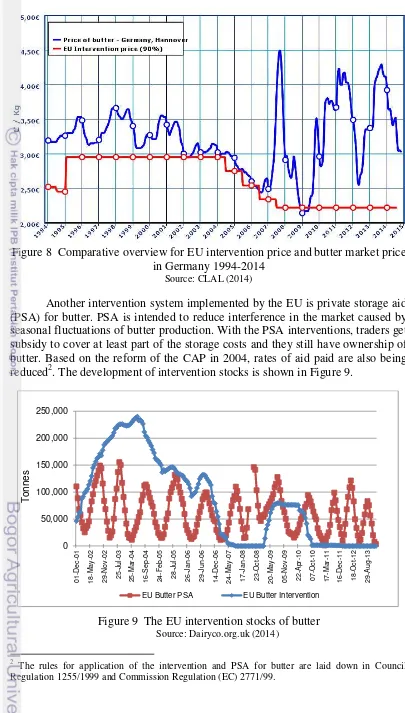
8 Comparative overview for EU intervention price and butter market price in Germany 1994-2014 ... 33
9 The EU intervention stocks of butter ... 33
10 Main butter exporters in 2012 ... 35
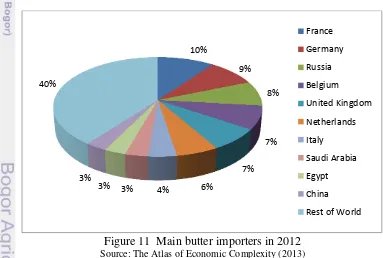
11 Main butter importers in 2012... 35
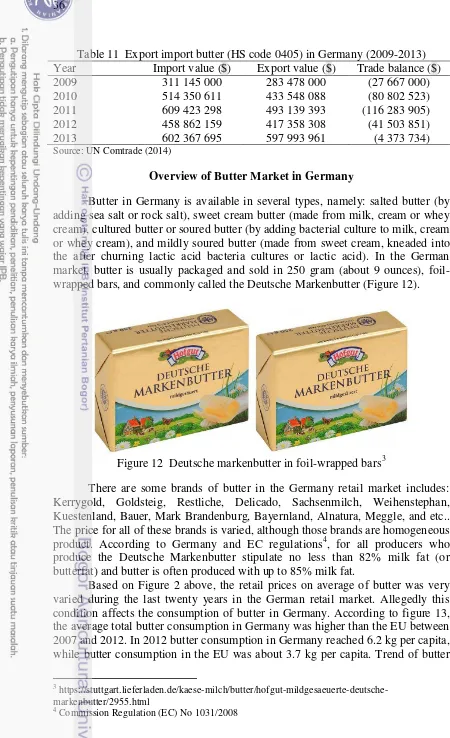
12 Deutsche markenbutter in foil-wrapped bars ... 36
13 Per capita butter consumption trends in Germany ... 37
14 Top five gains of German private label products value share during 2010- 2011 ... 39
15 Quantile group of butter brands 2010 ... 43
16 Demand curve of representative brands ... 44
17 Butter demand schedule graph by individual retail stores ... 49
18 Grouping brands based on different demand curve slopes in hypermarket store ... 50
19 Grouping brands based on different demand curve slopes in supermarket store ... 51
20 Grouping brands based on different demand curve slopes in discounter store ... 52
21 Data distribution of butter price and butter demand quantity across regions in Germany ... 56
22 Mean price box plot graph of butter across regions in Germany 2005-2010 ... 57
23 Price box plot graph of butter across retail store types in Germany 2005-2010 ... 59
LIST OF APPENDICES 1 Post estimate model test (econometric criteria) for types of retail store price difference analysis ... 66
2 Post estimate model test (econometric criteria) for region analysis ... 68
3 Post estimate model test (econometric criteria) for types of retail store demand function analysis ... 71
4 Regression results of butter demand across regions in Germany 2005-2010 ... 77
5 Butter price across regions in Germany 2005-2010 (in €/kg) ... 78
6 Butter price across retail store type 2005-2010 (in €/kg) ... 78
7 Price differential regression results with supermarket retail store type as
baseline of model ... Error! Bookmark not defined.79
8 Quantity of sales and market share of butter producers and private
1
1 INTRODUCTION
Background
Butter production is closely associated with the upstream subsystem of the milk agribusiness. Milk is a raw material of butter production. It can be said that the production of butter is strongly influenced by the production of milk. Based on
FAO (2014) and DairyCo (2014), the world’s milk production increased steadily
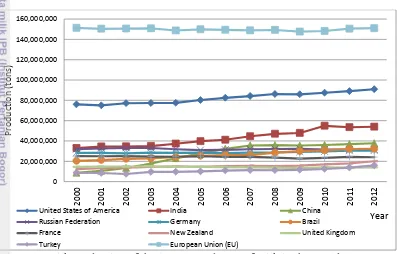
during 2000-2012 from 492.9 million tons to 625.8 million tons. In 2012, the largest global milk producer was the EU (151 million tons), followed by USA (90.9 million tons), India (54 million tons), and China (37.8 million tons). Figure 1 presents the graph of milk production of the largest milk producers in the world between 2000 and 2012.
Figure 1 Milk production of the largest producers of milk in the world 2000-2012
Source: FAOSTAT (2014) and DairyCo (2014)
Butter is a leading commodity for some countries in the EU. Based on Figure 1, the EU as the largest milk producer in the world, opens up great opportunities for the EU member countries to increasingly develop the dairy processing industry. Several major dairy products from the EU which became the leading products with large production, are: butter, cheese, cream, condensed milk, etc. The dairy product production data during the last two years is shown in Table 1.
0 20,000,000 40,000,000 60,000,000 80,000,000 100,000,000 120,000,000 140,000,000 160,000,000
2000 2001 2002 2003 2004 2005 2006 2007 2008 2009 2010 2011 2012
Pro
d
u
cti
o
n
(to
n
s)
Year
United States of America India China
Russian Federation Germany Brazil
France New Zealand United Kingdom
Table 1 The EU dairy products production in 2010-2013 (in 1 000 tons)
Product 2010 2011 2012 2013
Liquid milk 31 838 31 802 31 720 30 848
Cheese 8 455 8 442 8 661 8 716
Yogurt and other products 8 222 8 193 8 121 8 029
Cream 2 429 2 418 2 505 2 552
Butter 1 859 1 894 1 940 1 959
Whey powder 1 695 1 673 1 756 2 105
Skimmed Milk Powder (SMP) 1 059 1 190 1 218 1 174
Condensed milk 956 946 1 005 567
Whole Milk Powder (WMP) 769 755 741 760
Casein and caseinates 105 109 90 90
Source: CLAL.it (2014)
Based on Table 1, we can see that butter as one of the dairy products ranks the top five in the EU dairy product production during 2010-2012. In 2013, butter ranked sixth in the top dairy products in EU with quite large production reached to 1 959 thousand tons (CLAL, 2014). The butter production is aimed to fulfill the food industries and the household consumers’ needs. On the producer side, the butter production is closely associated with downstream subsystem of agribusiness, especially with food agribusiness system, such as chocolate, confectionery, baking, backery, and ice cream manufacturing industries.
On the consumer side, butter has been regarded as pleasure products in the European culture. Butter remains a main option for the European consumers who
wish healthy spreads foods. It is also associated with butter consumers’ behaviour
in the EU. Their consumption for butter has increased over the last four years. Based on the data of CLAL (2014), domestic consumption of butter in the EU increased steadily during 2010-2013. Consumption of butter in the EU has increased from 1 934 thousand tons in 2010 to 2 033 thousand tons in 2013 (see Table 2).
Table 2 The EU balance sheet of butter in 2010-2013 (in 1 000 tons)
Data 2010 2011 2012 2013
Opening Stocks 103 24 31 25
Production 1 859 1 894 1 940 1 959
Imports 40 47 55 42
Exports 156 126 127 128
Domestic consumption 1 934 1 982 2 031 2 033
Final Stocks 24 31 25 11
Source: CLAL.it (2014)
3
These indicate that butter is one of the leading international trade commodities in the EU.
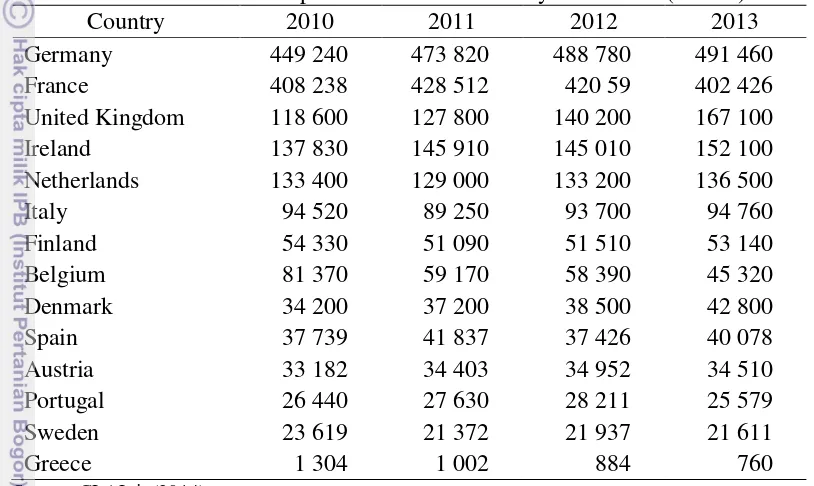
In the regional aspect of butter production country, Germany is the largest butter producer in the EU-28, with a total production of 491 460 tons in 2013, followed by France, the United Kingdom, Ireland, Netherlands, Italy, and others (CLAL, 2014). Table 3 shows the complete data of the EU butter production of butter in 2010-2013.
Table 3 The EU butter production across country 2010-2013 (in tons)
Country 2010 2011 2012 2013
Germany 449 240 473 820 488 780 491 460
France 408 238 428 512 420 59 402 426
United Kingdom 118 600 127 800 140 200 167 100
Ireland 137 830 145 910 145 010 152 100
Netherlands 133 400 129 000 133 200 136 500
Italy 94 520 89 250 93 700 94 760
Finland 54 330 51 090 51 510 53 140
Belgium 81 370 59 170 58 390 45 320
Denmark 34 200 37 200 38 500 42 800
Spain 37 739 41 837 37 426 40 078
Austria 33 182 34 403 34 952 34 510
Portugal 26 440 27 630 28 211 25 579
Sweden 23 619 21 372 21 937 21 611
Greece 1 304 1 002 884 760
Source: CLAL.it (2014)
As we can see on Table 3, Germany, where it consistently led in butter production during 2010-2013, has advantage in butter production compared with other countries in the EU. The trend of butter production in Germany also
increased steadily during the last few years. In 2013, German’s butter production
amounted to 25 % of the EU butter.
Figure 2 Comparative historical overview of wholesale and retail price of butter in Germany 1999-2010
Source: Butter-und Käse-Börse e.V. Kempten, processed by CLAL (2011)
Problem Statement
Germany as the largest butter producer has advantage in butter production compared with other countries in the EU-28. The trend of butter production in Germany also increased steadily during 2010-2013. The advantage in butter production, stock availability, and stable price of butter strongly supports the development of food industry in Germany.
However, there were fluctuations in the average price of butter in Germany during 1999-2010 and it was occurred from year to year (see Figure 2). Fluctuation of butter prices can affects business risk, the competition of butter producers, and economic surplus of consumers in the German butter market. German’s butter producers not only compete with domestic producers, but also compete with producers from outside Germany, especially with producers from other EU member countries (Ireland, Denmark, Netherland, etc.). One of the strategies which can be done by producers and retailers to survive in the competition is establish right price strategy, such implement price discrimination strategy. Price discrimination strategy aims to get consumer surplus, to increase profits and to face business competition.
Policy and regulation related to butter price determination and butter production can also affects conditions of competition in the German butter industry. Furthermore, the industrial condition of butter in Germany associated with the determination of the butter price and the competition among butter producers is interested to be examined, as well as, the consumer behaviour of butter in the German retail market related to fluctuation of average price.
To analyze the competition among producers and to examine the consumer behavior of butter product, a more detailed data about the variation of
5
that at any given time there is a great deal of variation around the average butter prices. For example, we can examine butter price data during 2005-2010 more closely and more detail. Tabel 4 summaries data of butter price in German retail market at any given weeks (randomly selected every year) can be observed to see
its variation.On the first week of May in 2008, there are 105 varibilities in butter
price.
Table 4 Summary of butter price data in the German retail market 2005-2010 (in €/kg)
Year Selected weeka
Number of unique
values
Maximum Minimum Mean
2005 3
rd
week,
September 88 9.96 0.8 4.62910
2006 2nd week, August 85 9.96 0.8 4.61779
2007 4th week, May 74 9.96 1.0 4.62799
2008 1st week, May 105 13.16 1.0 5.79997
2009 2nd week, March 95 9.96 0.8 5.35780
2010 1st week, December 85 13.16 0.8 6.02658
a
) Randomly selected using Microsoft Excel
Source: Author’s elaboration with data from IRI (2013)
Based on Table 4, we can see evidence of variation in the price of butter (see unique price value column). Further, it is interesting to analyze the casuse of the variation of butter price and whether the price discrimination could be possibly occurred. Analysis of butter prices will be associated with the
competition among producers in German butter industry and the consumers’
behavior in the German retail market.
Objectives of the Study
The main objective of this study is to analyze whether there is evidence of price discrimination in the butter market in Germany. In detail, objectives of this study are:
1. To analyze the necessary conditions (market power, different demand
elasticity, and preventing arbitrage) of occurrence in price discrimination of butter products in the German market through structure analysis.
2. To analyze demand function of butter products based on types of retail store in Germany.
3. To analyze price discrimination of butter products based on regions in Germany.
4. To analyze price difference of butter products across types of retail store
Benefits of the Study
This study provides information about conditions of competition in the industry and consumer behavior in the market. This information will be beneficial for policy makers, producers, retailers, researchers, students, and expertise concerned in the industry structure and marketing research. The benefits of this study can be classified as follow:
1. For the policy makers, producers, and retailers this study is expected to provide input to formulate marketing strategies. This study also can be reference and consideration for policy makers in setting appropriate strategic policy related to create fair competition in the industry. At last, this research provides reference and consideration for producers and retailers to implement appropriate managerial strategies and to increase their profits.
2. For the authors, this study is useful to improve the analytical capabilities
about the condition of competition in the industry and consumer behavior in the market with qualitative and quantitative approaches. This study is also useful to enhance the knowledge and experience as well as to apply the theories that have been acquired in the lecture on the actual condition. 3. For readers or other researchers, this study provides the information and
knowledge about price discrimination related to industry competition and consumer behavior in the market that can be applied in other research for different commodities or other locations with different market structures. This study is expected to be a reference to conduct in-depth research or further studies for other researchers.
Scope and Limitation of the Study
7
2 LITERATURE REVIEW
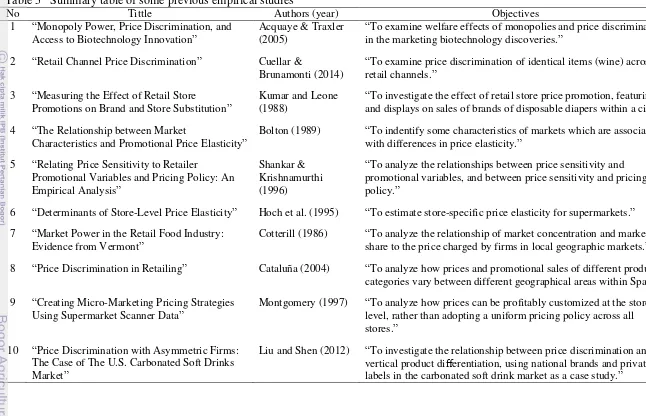
Prior to the discussion and further analysis regarding price discrimination on the butter market, we will discuss previous research and empirical studies related to this topic. The purpose of considering previous research and empirical studies is to determine the progress of any research that is related to price discrimination in various cases. Thus, we can perform a comparative and complementary study to the previous research. In addition, prior empirical studies also help in understanding the theories, concepts, and applications for future price discrimination studies.
Research and empirical studies related to price discrimination have been done on various commodities or products, with various types of data being used, as well as in varying locations and scopes of research. These previous studies can thus be compared based on the purpose of the research, the analysis method, and the obtained results. A review of several previous studies regarding the price discrimination, price elasticity, consumers demand, etc. will follow regarding the study of butter price discrimination in the German retail market. A summary table of previous empirical studies are used for the literature review of this study and can be seen in Table 7.
The Types of Price Discrimination in Empirical Studies
As previously explained in the theoretical framework section, price discrimination can be divided into several types. One of these categories is the division of price discrimination by Pigou (1920), which are: “first-degree price discrimination, second-degree price discrimination, and third-degree price discrimination.”
This categorization has been applied in several empirical studies about various types of price discrimination, such as the Bt cotton seed price discrimination research conducted by Acquaye & Traxler (2007). Third-degree price discrimination was discovered in relation to the Bt cotton seed in this study. The monopolist of the Bt cotton seed charges lower prices in (small and elastic) foreign markets than they charge in (large and inelastic) domestic markets. Based on Falck-Zepeda et al. (2000), as cited in Acquaye & Traxler (2007), the laws and enforcement of intellectual property rights (IPR) have provided innovate firms of agricultural inputs (fertilizer, seed, pesticide, etc.) with a level of monopoly power in the market. There are two reasons for which a monopolist can price discriminate in the Bt cotton sector. First, there are restricting possibilities for spatial arbitrage (geographic area) because cotton varieties on the highlands only affects small agro climatic. Second, seed monopolists such as Monsanto, can effectively segment the market through the use of a technology contract which states that farmers cannot resell their products (Acquaye & Traxler, 2007).
The Types of Data that can be Used for Price Discrimination Analysis
Analysis and research related to price discrimination can be accomplished by using various types and sources of data. Source data can be obtained from journals, previous empirical studies, report from companies or governments, surveys, and retail scanners (i.e., IRIs data, Nielsen’s data, etc.). Acquaye & Traxler (2007) used the data from previous empirical studies which were conducted by Hubbleet et al. (2000) to analyze the potential for price discrimination in Bt cotton seed throughout the states of Alabama, Georgia, North Carolina and South Carolina.
Meanwhile, most of the other empirical studies related to price discrimination are from retail sales data scanners at selling locations. The data used can be obtained from a single source or a combination of data from various sources. Liu and Shen (2012) use retail scanner data from A.C. Nielsen in the U.S. market to examine how soft drinks product differentiation affects the changes within the products price schedule of private label and national brands.
Another instance of combined data is the works of Cuellar & Brunamonti (2014), Cataluña (2004), and Cotterill (1986) which all use data from two or more sources. The data used in the study conducted by Cuellar & Brunamonti (2014) is scanner data from retail purchases of wine in three retail channels: drug stores, grocery stores, and liquor stores. The data was obtained from the Information Resources Incorporate (IRI) and the Nielsen systems, with the research being conducted in the U.S. between the years 2007 and 2010. IRI panel data is collected on a weekly basis through the use of electronic scanners at the store level and also contains information relating to relevant panel promotional activity. Cataluña (2004) used a combination of data from INFORES, S.A. retailer panel data and the IRI panel data to analyze markets in Spain. Cotterill (1986) used a data combination from the Vermont retail grocers association and personal extensive survey of grocery prices throughout the state’s supermarkets.
Meanwhile, Hoch et al. (1995) conducted a study in the Chicago metropolitan area using a combination of data from three sources. The
combination of data are store–level (retail) scanner data from the DFF
(Dominick’s Finer Foods), chain and market-level promotional activity data from the IRI, and store trading area data from Marketing Metrics.
Implementation of Pricing Strategy in Retailing
Cataluña (2004) states that pricing strategy can be implemented through the store level, the chain level, or the product category level. Price strategy which implement different pricing at the store level has become increasingly important for retailers (Yague, 1995; Gilbert and Jackaria, 2002; as cited in Cataluña, 2004). Hoch et al. (1995) state that the retailers can implement customized pricing at the store level. Additionally, retailers and manufacturers can establish cooperation programs on products that are in stores.
9
sensitivity or elasticity are very important in retail policy, examples could include a form of promotion, price determination, and pricing of private label brands.
Cataluña (2004) also states that measuring the price elasticity for each store is important and fundamental in considering many aspects, such as retailer policies, effective promotional, product pricing, and determining the distributors. For instance, Hoch et al. (1995) suggests that price discounts are better applied lightly in more price sensitive (elastic) stores and more aggressively in less sensitive (inelastic) stores. Hoch also references a pricing strategy in which temporarily lowering pricing can stimulate product sales for retailers and manufacturers. Cataluña (2004) found that to get greater sales retailers and manufacturers need more market promotion activities. Furthermore, Montgomery (1997) states that micro marketing strategies such as promotional activity and price discounts effectively increase the profits in the retail market.
Retail pricing strategy can also be analyzed based on geographical considerations. Cataluña (2004) found that there is a statistical difference between price discounts and promotional selling in the Nielsen market area. Promotional activity in the central-east region of Spain is much lower than in the rest of the Spain. Barcelona and the northeast region, however, have a greater sales percentage that include discount of price. This is in line with Shankar and Krishnamurthi (1996), who found that a retail store in the market with high competition has more different pricing than a retail store in the market with low competition.
Characteristics of Consumers and Pricing Strategy
Hoch et al. (1995) define micro marketing activity as a policy that is applied by retailers based on characteristics of consumers and the competitive environment. Montgomery (1997) also defines micro marketing activity as a variation of the marketing mix in the retail market which is determined considering consumer response.
For instance, in the wine market case, the retail channel stores can be divided into three types: drug stores, grocery stores and liquor stores. Drug store consumers buy wine products as an unplanned purchase, while initially shopping with the intent of buying other products. Bucklin and Lattin (1991), as cited in Cuellar & Brunamonti (2014), indicate that drug store consumers have a relatively high price elasticity of demand (great price sensitivity). In contrast, grocery store consumers buy wine products on impulse. Kahn and Schmittlein (1989) and Bucklin and Lattin (1991), as cited in Cuellar & Brunamonti (2014), show that grocery store consumers tend to be larger family with higher incomes, thus categorized as having low price sensitivity. Finally, liquor store consumers have specific shopping intent for wine. Thus, consumers also have the lowest price sensitivity. Price discrimination between the various retail channels is included in price discrimination based on consumers’ self-selection and shopping intent (Cuellar & Brunamonti, 2014).
in retail stores every 1-2 weeks and tend to choose larger stores. Secondary consumers shop in retail stores primarily to re-stock on products that have run out at home and tend to choose smaller stores (due to convenience).The study also determined that primary consumers in the larger stores would be more price sensitive than secondary consumers in the smaller stores.
Additionally, Hoch et al. (1995) analyze the price elasticity of products in the retail store related to consumer demographic characteristics (family size, education, age, income, and ethnicity). The results of the consumer demographic characteristics analysis indicated that more educated consumers are less price sensitive, black and Hispanic consumers are more price sensitive, larger families are more price sensitive and households with greater incomes are less price sensitive.
Evidence of Price Discrimination in Retailing Based on Empirical Studies
The results of the study conducted by Cuellar & Brunamonti (2014) determine that the order of price elasticity of demand is drug stores, grocery stores, and finally, liquor stores (|eDrug| > |eGrocery| > |eLiquor|). Based on semi log
fixed effects, it can be stated that, on average, the price of a bottle of wine sold at a drugstore is approximately 7.8% lower than at a grocery store, while it is 4.1% less at a liquor store than at a grocery store. In this case, the price of wine is cheapest at drug stores, more expensive at grocery stores, and most expensive at liquor stores (|PDrug| < |PGrocery| < |PLiquor|).
Previously, Cotterill (1986) found that different companies charge different prices based on their characteristics and there is imperfect price information regarding consumers in the retail stores. Market power or concentration can be measured through the four-firms concentration ratio
(CR4)and the Herfindahl-Hirschman Index (HHI), while the homogeneous
products industry with the four firms concentration tends to capture market power effectively and profitably in relation to market share. Profit maximizing firms facing inelastic market demand curves have a greater incentive to increase prices in the food retail market.
Furthermore, Liu and Shen (2012) determined the correlation between private labels and national brands of soft drinks production differentiation and discrimination of price in the U.S. retail market. It is suggested that private labels and national brands of soft drink products give discounts to consumers based on quantity in the U.S. retail market, i.e., prices per unit charged lower when consumers buy soft drinks with larger quanitities. Liu and Shen (2012) conclude that “private labels have a greater ability to perform price discrimination, segment
11 Table 5 Summary table of some previous empirical studies
No Tittle Authors (year) Objectives
1 “Monopoly Power, Price Discrimination, and Access to Biotechnology Innovation”
Acquaye & Traxler (2005)
“To examine welfare effects of monopolies and price discrimination in the marketing biotechnology discoveries.”
2 “Retail Channel Price Discrimination” Cuellar &
Brunamonti (2014)
“To examine price discrimination of identical items (wine) across retail channels.”
3 “Measuring the Effect of Retail Store
Promotions on Brand and Store Substitution”
Kumar and Leone (1988)
“To investigate the effect of retail store price promotion, featuring and displays on sales of brands of disposable diapers within a city.”
4 “The Relationship between Market
Characteristics and Promotional Price Elasticity”
Bolton (1989) “To indentify some characteristics of markets which are associated with differences in price elasticity.”
5 “Relating Price Sensitivity to Retailer
Promotional Variables and Pricing Policy: An Empirical Analysis”
Shankar & Krishnamurthi (1996)
“To analyze the relationships between price sensitivity and promotional variables, and between price sensitivity and pricing policy.”
6 “Determinants of Store-Level Price Elasticity” Hoch et al. (1995) “To estimate store-specific price elasticity for supermarkets.”
7 “Market Power in the Retail Food Industry: Evidence from Vermont”
Cotterill (1986) “To analyze the relationship of market concentration and market share to the price charged by firms in local geographic markets.”
8 “Price Discrimination in Retailing” Cataluña (2004) “To analyze how prices and promotional sales of different product categories vary between different geographical areas within Spain.”
9 “Creating Micro-Marketing Pricing Strategies Using Supermarket Scanner Data”
Montgomery (1997) “To analyze how prices can be profitably customized at the store level, rather than adopting a uniform pricing policy across all stores.”
10 “Price Discrimination with Asymmetric Firms: The Case of The U.S. Carbonated Soft Drinks Market”
3 THEORETICAL FRAMEWORK
Butter as one of the livestock derived products is quite a homogeneous product, but the price for all brands is heterogeneous in the German retail market. Butter is being sold for a large range of prices that vary around the average at any given time. It is interesting to review causes of price heterogeneity and to prove the existence of price discrimination of this butter type.
This chapter will help to explain the theory associated with price discrimination and necessary factors, which led to butter price discrimination in the German retail market. This chapter provides the theoretical framework which generally consists of: the definition of price discrimination, types of price discrimination, relationship between price discrimination and agricultural markets, the nature of price discrimination and its result with industrial – structure, conduct, and performance (SCP) analysis.
The Definition of Price Discrimination
In his paper, von Cramon-Taubadel (1989) states that the price discrimination can occur when the relationship between prices charged by producer in different markets is not equal to the relationship between the marginal costs raised in those market. In other words, price discrimination can occur when a producer charges different a price of a good for the different markets, whereas the marginal costs of producing that good for all markets are equal. Discrimination of price also can occur when a producer charges the price equally for different markets with different marginal cost of a good production.
Earlier Phlips (1983) on his book of ‘The Economics of Price
Discrimination’ writes that discrimination of price can occurs if similar good is sold at different prices to different consumers in the market. Gehrig and Stenbacka (2005) state that price discrimination is the economic practice which producers charge similar product with different prices to different customers. The keywords from all definition of price discrimination are different prices, different markets and similarity of goods (related to homogeneus product asumption).
Phlips (1983) further states that this definition does not satisfy with his criteria about price discrimination, where the similar good is sold at different prices to different consumers, may not always occur discrimination of price. In line with this statement, von Cramon-Taubadel (1989) states that not true directly assume that price discrimination is involved whenever producers charge different prices for the similar commodity (product).
13
There is a good indicator in order to clearly define the price discrimination which is by using the comparison between the ratio of price and ratio of the marginal cost. Gehrig and Stenbacka (2005) state that price discrimination cannot be explicitly formed such as when consumers are formally offered a similar option of the product, but in fact, different consumers choose different product options due to price. Volume discounts are implemented effectively to consumers with large quantities. Von Cramon-Taubadel (1989) also gives an additional explanation for these example cases to make clearly explaination about price discrimination; producer of computer can produce personal computers or notebooks at constant marginal cost, but the producer of computer offers more discounts for consumers who purchase with large quantities.
The Types of Price Discrimination
Historically, Pigou (1932) in ‘The Economics of Welfare’ has distinguished discrimination of price to become three degrees based on discriminating power by monopolists. First degree price discrimination can occurs when the monopolists charge different prices for different units of the product. The price charged for each unit of the commodity is equal to the price of demand. The consumers did not get their consumers' surplus at all because all economic surplus are taken by producers. In line with this, Phlips (1983) illustrates visualization of the situation that all consumers charged price of each commodity unit by considering ‘reservation price’ or the greatest price the consumer is ready to pay for one unit commodity (willingness to pay of consumers). McAfee (2008) adds explanation that the first degree discrimination of price as perfect form of
discrimination which prices charged based on consumer’s identity and their
subjective value of the product purchased.
Pigou (1932) and Phlips (1983) describe that the second degree is obtained
if a monopolist can make n different prices. For example, all quantities of product
with higher reservation price than Px are sold at Px, all quantities of product with less reservation price than Px and higher than Py are sold at Py, and so on (see Figure 3). Phlips (1983) adds that consumers are divided into n groups which were charged by an identical price each group. Some consumers have a consumer surplus while their demand or reserve price is higher than the identical price in their group. McAfee (2008) explains that the second degree price discrimination is offering a menu option to consumers such quantity discount.
Price
Px
Py
Pn
x y n Quantity
Figure 3 Second degree price discrimination
The last type of Pigou (1932) price discrimination concept called third degree price discrimination where the monopolist has an ability to divide
consumers to n different groups and charge different prices to the consumer
groups. Third-degree price discrimination involved the refusal to satisfy one market and another market is satisfied (see Figure 4). Phlips (1983) gives an example to illustrate this condition that is spatial price discrimination (known as the new concept of price discrimination), which different market area charged different net prices by considering translocation cost of commodities. McAfee (2008) states the third degree discrimination of price as an imperfect form of first degree discrimination of price.
The different ways in which markets can be insulated from one another provide us with a set of characteristics which can be used to classify the different types of price discrimination (von Cramon-Taubadel, 1989). There are five common types of price discrimination which will be discussed (Koester, 1987 and Hirshleifer, 1976 as cited in von Cramon-Taubadel, 1989). Those are:
1. Temporal Price Discrimination
Temporal discrimination of price can occurs if similar product is sold at different prices due to different times, and the difference in price is not justified by storage costs or changes in production costs which might have occurred.
2. Spatial Price Discrimination
Spatial price discrimination occurs when the price of a good is not the same at two different geographical locations, but the price difference is not equal to the costs incurred in moving the good from one location to the other such translocation cost.
3. Personal Price Discrimination
Personal discrimination of price discrimination occurs while producers charge different prices for the similar product to different personal consumers, and these prices are not justified by any variability in the costs of serving different individuals. Personal discrimination can be based on physical characteristics (age and sex), social characteristics (occupation and marital status), and economic characteristics (income and expenses). Private households and industries can be used as a broad definition of a person to determine different prices of good.
Figure 4 Third degree price discrimination
15
4. Quantitative Price Discrimination
Quantitative price discrimination occurs when different quantities of a good are sold for different unit prices. The producers have given different discounts of good to consumers for the first unit purchased and successive units.
5. Qualitative Price Discrimination
Qualitative price discrimination occurs when a producer sells the similarly good for different prices based on different perceptions of the good quality of characteristics.
In the development of the concept of price discrimination, von Cramon-Taubadel (1989) distinguishes between four basic types of discrimination by considering ‘voluntary’ and ‘optimal’ as criteria, that is: i) voluntary and optimal; ii) involuntary and sub-optimal; iii) voluntary and sub-optimal; and, iv) involuntary and optimal. Voluntary and involuntary related to how price discrimination can be occurs, by designing or accidentally occurs. Optimal and sub-optimal related to how effect of price discrimination in price, quantities, and welfare.
Relationship Between Price Discrimination and Agricultural Markets
Von Cramon Taubadel (1989) writes that price discrimination can occur in many sectors of the economy and become a common phenomenon. Agricultural sector can be also included in the price discrimination phenomenon, especially in the agricultural markets. Commodity in agricultural markets can be interesting objects for reading up about price discrimination. In this case, there are roles of market participants in determining the existence of price discrimination in agricultural markets. Market participants can be traced from the supply chain of a product or commodity and the institutions that affect the agricultural commodity trade, such as: farmers, breeder, fisherman, trader, firms, and public institution which purchase and provide agricultural equipment in the market.
Each market participant has a different role and influence in the practice of price discrimination in agricultural markets. Von Cramon-Taubadel (1989) gives examples to show that each market participant has the opportunity to price discriminate. Farmers, breeders, and fisherman can also implement price discrimination in agriculture sector, when a breeder charged a higher price of brown eggs than that of white ones while brown eggs and white eggs have similar marginal cost in the production process (von Cramon-Taubadel, 1989). The egg price difference is also due to consumer preference in the markets. The similar size of white and brown eggs has similar nutritional value. Some consumers prefer to choose brown-shelled eggs than white-shelled eggs and are willing to pay more
for brown-shelled eggs than white-shelled eggs1. Von Cramon-Taubadel (1989)
adds explanation of price discrimination that is performed by farmers. The farmers generally get much higher prices for commodities when farmers sell directly to consumers in the market than sell through intermediate traders (wholesalers or retailers). In this case, farmers get the marketing margin and higher price through selling commodities directly to consumers and eliminating the middleman or cutting the marketing chain of product.
1
Generally, firms in the agricultural sector also can price discriminate as well. In agricultural case, monopoly power can be conducted by performing innovation in product technology and laws such as property right. Acquaye and Traxler (2005) analyze that innovators in agricultural sector also had the ability to prevent consumers from reselling GMO (Genetically Modified Organism) commodity (Bt cotton). Furthermore, the innovators may be able to price discriminate in order to emphasize the effect of monopoly power through intellectual property (IP) protection in GMO commodities. Innovators who do IP protection in GMO commodities originate in the private sector (firms). For instance, Monsanto, as a main supplier of Bt cotton seed, has monopoly power because it owns the patents to the key genetic events. Von Cramon-Taubadel (1989) gives another example that the private sector performs price discrimination; a firm performing agricultural machinery maintenances charged similar price for similar work, all year-round. In the fact, marginal costs for maintenances agricultural machinery are not constant year-round.
As stated above, public institution or government, such as the European Community (EC) can implement price discrimination as well. Von Cramon-Taubadel (1989) gives an example of price discrimination performed by a public institution in dairy products, EC sells the same butter through intervention stocks policy at different prices to different consumers. The intervention stock is conducted by the EC because it is difficult to insulate markets from one to another. The EC performed a variety schemes to butter stock intervention consisted of subsidized exports, Christmas butter, butter for social purpose, butter for the ice cream industry (Keller, 1986 as cited in in von Cramon-Taubadel, 1989). Each scheme is applied to different discount rate, which also affect to different prices.
Analysis of price discrimination in agricultural commodities can be done in a macroeconomic viewpoint, such as export and import. Some of the literature investigate the existence of price discrimination on the export of agricultural commodities. Those are price discrimination analysis, which are conducted by Lavoie (2005) and Pall et al. (2011). Lavoie (2005) found that there is price discrimination of high quality wheat in the Canadian exports case. In addition, Pall et al. (2011) examine that Russian exporters implement different wheat prices for different importing countries, which have limited world market access, such as Uzbekistan, Tajikistan, Kazakhstan, and Armenia. Pall et al. (2011) add this wheat price discrimination due to differences in the quality demanded by each importing countries, so Russian exporters can use their market power. Both these papers indicate price discrimination on the export of agricultural commodities across countries caused by differences in the quality of products.
The Nature of Price Discrimination and Its Result (SCP Analysis)
SCP (structure, conduct, and performance) analysis of market were appeared from the previous concept about the neoclassical analysis of markets
(Edwards, et.al, 2005). Since the 1940s, structure, conduct, and performance
17
the industrial organization concept becomes subsector analysis. To analyze how markets behave Bain (1959) as cited in von Cramon-Taubadel (1989) emphasizes structure, conduct and performance as concepts which help to explain these analyses. Fu (2003) adds explanation that the structure, conduct, and performance paradigm has become a general approach to analyzing communication in the markets or industries. Price discrimination is also a phenomenon of economics, which occurs in industrial organizations or markets can be analyzed in the same manner (structure, conduct, and performance – SCP analysis). First, structure in the discrimination of price discussion is about the necessary conditions which should exist for the occurrence of price discrimination. Second, how and why this market structure leads to price discrimination (which the conduct markets type). Third, how is the impact of price discrimination in price, quantities, and welfare (performance).
Necessary Condition - Structure
McAfee (2008) states three necessary conditions of occurrence of price discrimination that are:
1) A producer has power in the market,
2) There is differences in consumer demand for given products, and
3) The producer can limit and prevent a market arbitrage.
If the consumers have similar demand for given products, thus that they would want a similar quantity of good at each level of price, so the quantity and price are only depend on the amount of consumers and capability of producers to provide the product to the market. In this condition producers tends to do not have market power to determine the price of goods. If producers do not have power in the market all goods would be sold at similar prices (the law of one price in perfect competition theory). Eventually, McAfee (2008) emphasizes that would attempt to resell the goods from consumers with low charged price with large quantities to consumers with high charged price when consumers can arbitrage price differences. In other words, producers do not have ability to isolate the product flow from one market to another.
Three necessary conditions of occurrence of price discrimination which explained by McAfee (2008) above is in accordance with that explained by von Cramon-Taubadel (1989):
1) The producer must have some market power in one or several markets.
This implies that the producer is a price maker who faces different demand curves and different elasticity. In other words, the producers could face a more elastic demand curve in the market and face inelastic demand curve in other markets. This affects the market power of producers in some markets. The producers can set the form of price difference in both or some markets.
3) Finally, the producers should be able to prevent or limit arbitrage distribution product from a market to another market. This can be achieved if the producers face two or more markets that can be effectively separated. So there is no product which will be resale from consumers with low prices to consumers with high prices. Prevention or limitation of arbitrage can be done by geographic separation or market regulation.
How to Identify Price Discrimination – Conduct
Von Cramon-Taubadel (1989) writes price discrimination can be explained verbally, graphically, and mathematically. The verbal explanation is intuitively useful, but does not provide much detailed information about the resulting prices and quantities (performance). Graphical analysis is more helpful explaining price discrimination visually. Mathematical explanation is the most informative and detailed explain about price discrimination case.
1) Verbal Explanation
A producer of an agricultural commodity who is facing the structure market can sell commodities in two or more insulated markets (market 1 and market 2), the producer has some degree of monopoly power in these markets and also some information about demand curves in these markets. Given information about the demand curves he faces, the producer will also know something about the corresponding marginal revenue curves. (von Cramon-Taubadel, 1989)
The producer will end up charging a different price in market 1 and in market 2. Recall that a given marginal revenue (MR) occurs at lower outputs and higher prices in markets with inelastic demand function than it does in markets with elastic demand function. For illustration, market 1 is characterized by elastic demand market relative to market 2 (inelastic demand market), and given the rule that marginal revenue must be equal in both markets. Then the producer charges the price on the market 2 will have to be higher than the price charged on the market 1.
2) Graphical Explanation
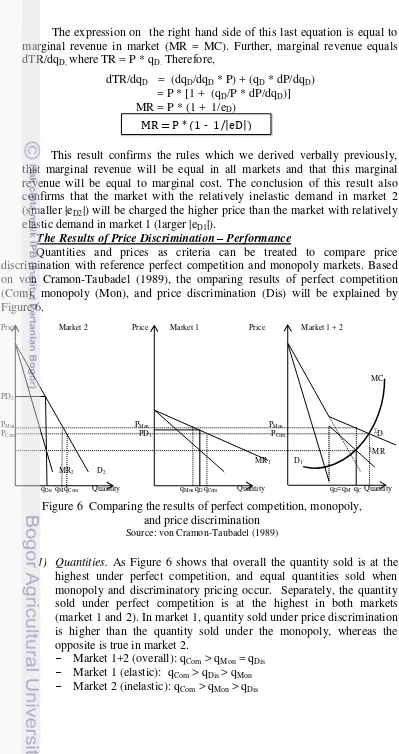
Figure 5 describes a condition in which the necessary conditions listed above are all met. A producer faces two markets (market 1 and market 2) which are insulated from one another. The producer has monopoly power in both markets, and also has some information about the demand functions which prevail in these markets (D1 is relatively elastic, D2 is relatively
inelastic). Based on this information concerning the two demand functions, it
is possible to draw the marginal revenue curves MR1 and MR2.
To determine the exact quantity at which marginal cost (MC) equals marginal revenue in market 1 and market 2, we add the demand functions horizontal in panel market 1+2 (∑D) and derive the resulting marginal revenue function (∑MR). MR1+2 cannot be derived by the horizontal addition
of MR1 and MR2 because this would give a rise to a function which does not
have the necessary discontinuity corresponding to kink in the aggregate demand curve. Marginal revenue is a function which must be derived vertically from the appropriate demand function. Then, when MC equals ∑MR at the quantity q1+2, that is divided into q1 and q2 and sold for the price
19
in market 2 which relatively inelastic demand is higher than that charged where demand is relatively elastic (market 1).
Price Market 2 Price Market 1 Price Market 1 + 2
MC
PB
PA
∑D
∑MR
MR1 D1
MR2 D2
q2 Quantity q1 Quantity q1+2 Quantity
3) Mathematical Explanation
The necessary conditions discussed previously can be translated into mathematical forms as follows. Demand in markets 1 and 2 respectively can be described by the following general functions. It is assumed that these markets (market 1 and 2) are insulated from one another.
The producer’s total cost (C) function is:
TC = g(q1 +q2) = g(q), where q = q1 +q2
This information is used to formulate a profit function (π= profit, TR=
total revenue) which producer maximizes. π = TR – TC
π = (q1 * P1) + (q2 * P2) – g(q)
The values of q1+q2 which maximize profit are those at which the first
partial derivatives of profit are equal to zero (dπ/dqi= 0), where i= 1 and 2.
This expression equals 0, when: dπ/dqi = 0
Pi * (1 + 1/eDi) – MC = 0,
(where eDi = the elasticity of demand in market i)
MC = Pi * (1 + 1/eDi) or,
q1 = f1 (P1)
q2 = f2 (P2)
dπ/dqi = dqi/dqi * Pi) + (qi * dPi/dqi) – dTC/dqi
= Pi * [1 + (qi/Pi * dPi/dqi)] – MC
= Pi * (1 + 1/eDi) – MC
MC = Pi * (1 - 1/|eDi|)
Figure 5 Graphical presentation of price discrimination