3 CHAPTER 2
LITERATURE REVIEW AND THEORITICAL BACKGROUND
2.1 Literature Review 2.1.1 Previous Research
There are some previous research which being references in this research making. Selection of the marketing strategy of the SME done by Astuti, Silalahi, and Wijaya (2015). That research objectives is about to know the influence of 7P marketing mix variables, which consists of product, price, promotion, place, people, physical evidence and process on purchasing decision of consumers in determining appropriate marketing strategy of Malang apples at Giant MOG. There are 2 variables; independent variables that is 7P (X) and dependent variables that is purchasing decision (Y). At that research, multiple linear regression analysis was used to determine the marketing mix variable that most influences on purchasing decisions of Malang apples consumers at Giant MOG. Analytical Hierarchy Process (AHP) was used to set the right marketing strategy of Malang apples at Giant MOG according to management of Giant MOG.
A research about marketing strategy also conducted by Kumar and Rajeev (2012). In his research explained that internet marketing strategy have a very important role in many industries because internet marketing is one of the easiest and cheapest way of marketing. Its population of the internet user increase day-by-day and it is easily available in any part of the country. With the same reason Kiran, Majumdar, and Kishore (2012) in his research about innovative marketing strategies for SME also suggest to use Internet as a promotional tool in Small Medium Enterprise (SME). It is also agreed by Öztamur and Karakadılar (2014), Dilhan did a marketing research strategy using internet as the media with a assumption that internet give us a big opportunity to connect with people throughout the world. In his research qualitative content analysis is used as the main method, because the ultimate target is to see the companies strategical use of social media, including which contents they choose, how often they update their accounts, what style of language they use and how effective their communication is.
4
to educate small businesses about the potential that a good social media strategy for your business can generate. Many of them have no knowledge of the existence of tools that could be useful in their daily operations as promote their products, customer approach, monitoring and measuring the effectiveness of its strategy, brand positioning, etc.
2.1.2 Present Research
This research is about identify the marketing strategy for product innovative of SME of Mount Merapi Eruption victims based on the women whose job switched from agriculture to SME in Cangkringan as the object. The method is used in this research is Analytic Network Process (ANP).
2.2 Theoretical Background 2.2.1 Marketing strategy
Marketing is one of the important things in the business. Many people mistakenly think that marketing is only about communication activities such as advertising, promotion, public relations, and personal selling. In his book Ferrell and Hartline (2005) says that marketing is the process of planning and executing the conception, pricing, promotion, and distribution of ideas, goods, and services to create exchanges that satisfy individual and organizational objectives. Viewed from that perspective, we can see that the scope of marketing function is considerably broader.
5
strategy. When customers needs are satisfied by effective marketing programs, long-term competitive advantage can be achieved and financial goals can be met (Urban & Star, 1991). The marketing strategy can be consist of one or more marketing programs. Each programs consists of two elements—a target market and a marketing mix. To develop a marketing strategy, an organization must select the right combination of target over it market(s) and marketing mix in order to create distinct competitive advantages over its rivals (Ferrell & Hartline, 2005).
The term ‘marketing mix is attributed to Neil H.Borden and refers to the set of marketing ingredients a company can use to achieve its objectives. Lancaster and Massingham (2010) suggest some of the factors that the detailed marketing mix plans as four Ps are Products (Quality, Features, Options, Style, Services, Installation, Warranty, Packaging,and New product development), Price (Pricing, Price changes, List prices, Discounts, Allowances, Payment, and Credit terms), Promotion (overall emphasis in promotional mix, objectives, strategies and plans), and the last is Place (Channel configuration/coverage/levels, Specific type of intermediaries, Terms and responsibilities of channel members, Order processing systems, Warehousing, storage, stocking and delivery policies)
In a modern marketing system, marketing mix incorporated in 7P, i.e. product, price, place, promotion, people, physical evidence, and process (Lovelock & Wirtz, 2011). The definition of 7P according to The Chartered Institute of Marketing (2009) is as follows:
a. Product
There is no point in developing a product or service that no one wants to buy, yet many businesses decide what to offer first, and then hope to find a market for it afterwards. In contrast, the successful company will find out what customers need or want and then develop the right product — with the right level of quality to meet those needs now and in the future.
b. Price
6 c. Place
The place means of distributing the product to that place where customers buy a product. The product must be appropriate and convenient for the customer. The product must be available in the right place, at the right time and in the right quantity, while keeping storage, inventory and distribution costs to an acceptable level.
d. Promotion
Promotion is the way a company communicates what it does and what it can offer customers. It includes activities such as branding, advertising, PR, corporate identity, sales management, special offers and exhibitions. Promotion must gain attention, be appealing, tell a consistent message and above all else give the customer a reason to choose your product rather than someone else s.
e. People
Anyone who comes into contact with customers will make an impression, and that can have a profound effect — positive or negative — on customer satisfaction. The reputation of the brand rests in the people s hands. The people must be appropriately trained, well motivated and have the right attitude. It is essential to ensure that all employees who have contact with customers are not only properly trained, but also the right kind of people for the job
f. Process
The process of giving a service, and the behavior of those who deliver are crucial to customer satisfaction. Issues such as waiting times, the information given to customers and the helpfulness of staff are all vital to keep customers happy. g. Physical evidence
A service cannot be experienced before it is delivered. This means that choosing to use a service can be perceived as a risky business because buying something intangible. This uncertainty can be reduced by helping potential customers to ‘see what they are buying. Case studies and testimonials can provide evidence that an organization keeps its promises. Facilities such as a clean, tidy and well-decorated reception area can also help to reassure.
7
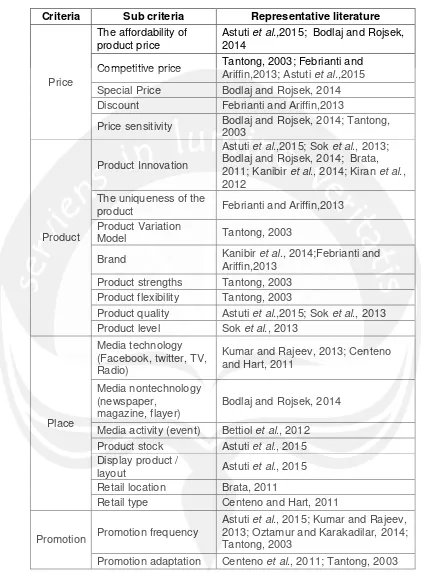
Table 2. 1. Categorize of innovative marketing sub criteria Criteria Sub criteria Representative literature
Price
The affordability of
product price Astuti et al.,2015; Bodlaj and Rojsek, 2014 Competitive price Tantong, 2003; Febrianti and Ariffin,2013; Astuti et al.,2015
Special Price Bodlaj and Rojsek, 2014 Discount Febrianti and Ariffin,2013
Price sensitivity Bodlaj and Rojsek, 2014; Tantong, 2003
Product
Product Innovation
Astuti et al.,2015; Sok et al., 2013; Bodlaj and Rojsek, 2014; Brata, 2011; Kanibir et al., 2014; Kiran et al., 2012
The uniqueness of the
product Febrianti and Ariffin,2013 Product Variation
Model Tantong, 2003
Brand Kanibir et al., 2014;Febrianti and Ariffin,2013 Product strengths Tantong, 2003
Product flexibility Tantong, 2003
Product quality Astuti et al.,2015; Sok et al., 2013 Product level Sok et al., 2013
Place
Media technology (Facebook, twitter, TV, Radio)
Kumar and Rajeev, 2013; Centeno and Hart, 2011
Media nontechnology (newspaper,
magazine, flayer) Bodlaj and Rojsek, 2014 Media activity (event) Bettiol et al., 2012 Product stock Astuti et al., 2015 Display product /
layout Astuti et al., 2015
Retail location Brata, 2011
Retail type Centeno and Hart, 2011
Promotion Promotion frequency
Astuti et al., 2015; Kumar and Rajeev, 2013; Oztamur and Karakadilar, 2014; Tantong, 2003
8
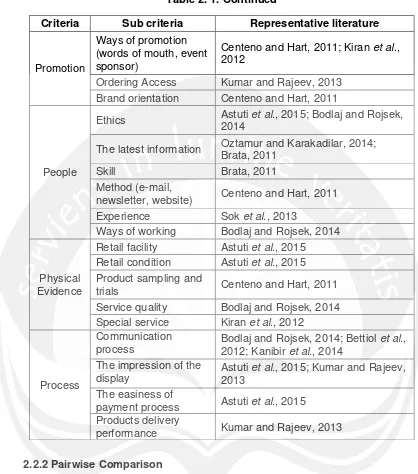
Table 2. 1. Continued
Criteria Sub criteria Representative literature
Promotion
Ways of promotion (words of mouth, event sponsor)
Centeno and Hart, 2011; Kiran et al., 2012
Ordering Access Kumar and Rajeev, 2013 Brand orientation Centeno and Hart, 2011
People
Ethics Astuti et al., 2015; Bodlaj and Rojsek, 2014 The latest information Oztamur and Karakadilar, 2014; Brata, 2011
Skill Brata, 2011
Method (e-mail,
newsletter, website) Centeno and Hart, 2011 Experience Sok et al., 2013
Ways of working Bodlaj and Rojsek, 2014
Physical Evidence
Retail facility Astuti et al., 2015 Retail condition Astuti et al., 2015 Product sampling and
trials Centeno and Hart, 2011
Service quality Bodlaj and Rojsek, 2014 Special service Kiran et al., 2012
Process
Communication
process Bodlaj and Rojsek, 2014; Bettiol et al., 2012; Kanibir et al., 2014 The impression of the
display Astuti et al., 2015; Kumar and Rajeev, 2013 The easiness of
payment process Astuti et al., 2015 Products delivery
performance Kumar and Rajeev, 2013
2.2.2 Pairwise Comparison
Suppose there are objectives. We begin by writing down an matrix (known as the pairwise comparison matrix) �. The entry in row and column of � (call it
9
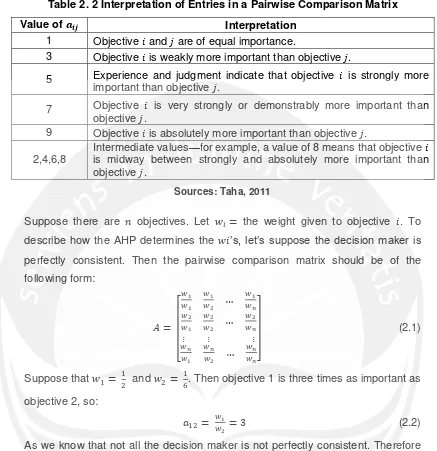
Table 2. 2 Interpretation of Entries in a Pairwise Comparison Matrix
Value of � Interpretation
1 Objective and are of equal importance.
3 Objective is weakly more important than objective .
5 Experience and judgment indicate that objective is strongly more important than objective .
7 Objective is very strongly or demonstrably more important than objective .
9 Objective is absolutely more important than objective .
2,4,6,8 Intermediate valuesis midway between strongly and absolutely more important than —for example, a value of 8 means that objective objective .
Sources: Taha, 2011
Suppose there are objectives. Let = the weight given to objective . To describe how the AHP determines the s, let s suppose the decision maker is perfectly consistent. Then the pairwise comparison matrix should be of the following form:
� =
[ � �
�
� … � �� �
� �
� … � �� ⋮ ⋮ ⋮ ��
� �� � …
�� ��]
(2.1)
Suppose that = and = . Then objective 1 is three times as important as objective 2, so:
� = �� = (2.2)
As we know that not all the decision maker is not perfectly consistent. Therefore that for a consistent decision maker, the weights can be obtained from the only nontrivial solution to (2.1). Now suppose that the decision maker is not perfectly consistent, we use the following two-step procedure:
1. � � matrix
10 2. Average each row
Estimate as the average of the entries in row of � � . The lowest averaged result will be the weakest criteria, whereas the highest will be the strongest criteria in that comparison.
Pairwise comparisons assessment involving more than one expert will produce a different assessment. Every expert assessment results will be combined into a single value that represents all the pairwise comparison assessment results. The merging is done by finding the average value. According to Saaty (1994), the smoothing method used is the Geometric Mean.
Each of these values for each pair are multiplied then the multiplying result are rooted by the number of expert with the geometric mean. Mathematically geometric mean formula is written as follows (Saaty, 1994):
� = √� � … �� (2.3)
where :
� = Geometric Mean baris ke-i kolom ke-j n = jumlah expert
We can now use the following four-step procedure to check for the consistency of the decision maker s comparisons. (From now on, w denotes our estimate of the decision maker s weights.)
1. Compute ���
���= [
� �
�
� … � �� �
� �
� … � �� ⋮ ⋮ ⋮ ��
� �� � …
�� ��]
[
� �
� � ⋮ � � ]
(2.4)
2. Compute
∑== en y n �� en y n ��� (2.5)
3. Compute the consistency index (CI) as follows:
11 4. Compare CI to the random index (RI)
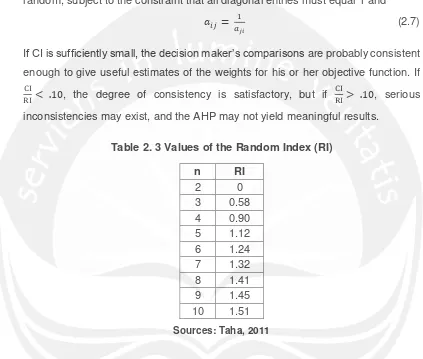
Compare CI to the random index (RI) for the appropriate value of n, shown in Table 2.2. For a perfectly consistent decision maker the th entry in ���= ( th entry of ��). This implies that a perfectly consistent decision maker has CI = 0. The values of RI in Table 2.3 give the average value of CI if the entries in � were chosen at random, subject to the constraint that all diagonal entries must equal 1 and
� = � (2.7)
If CI is sufficiently small, the decision maker s comparisons are probably consistent enough to give useful estimates of the weights for his or her objective function. If CI
I< . , the degree of consistency is satisfactory, but if CI
I> . , serious inconsistencies may exist, and the AHP may not yield meaningful results.
Table 2. 3 Values of the Random Index (RI)
n RI
2 0
3 0.58 4 0.90 5 1.12 6 1.24 7 1.32 8 1.41 9 1.45 10 1.51 Sources: Taha, 2011
12
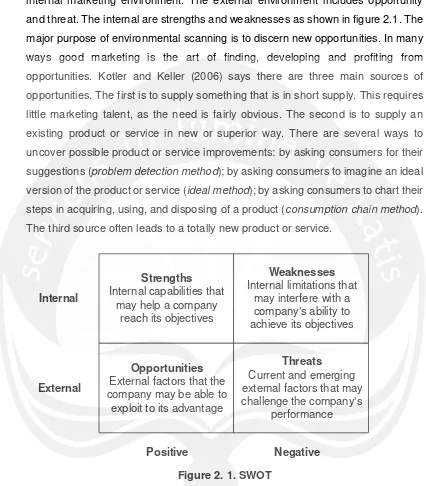
According to Kotler and Keller (2006), SWOT involves monitoring the external and internal marketing environment. The external environment includes opportunity and threat. The internal are strengths and weaknesses as shown in figure 2.1. The major purpose of environmental scanning is to discern new opportunities. In many ways good marketing is the art of finding, developing and profiting from opportunities. Kotler and Keller (2006) says there are three main sources of opportunities. The first is to supply something that is in short supply. This requires little marketing talent, as the need is fairly obvious. The second is to supply an existing product or service in new or superior way. There are several ways to uncover possible product or service improvements: by asking consumers for their suggestions (problem detection method); by asking consumers to imagine an ideal version of the product or service (ideal method); by asking consumers to chart their steps in acquiring, using, and disposing of a product (consumption chain method). The third source often leads to a totally new product or service.
Strengths
Internal capabilities that may help a company
reach its objectives
Weaknesses Internal limitations that
may interfere with a companys ability to achieve its objectives
Opportunities External factors that the company may be able to exploit to its advantage
Threats Current and emerging external factors that may challenge the companys
performance Internal
External
Positive Negative
Figure 2. 1. SWOT Source: Kotler and Keller, 2006
2.2.4 Analytical Network Process (ANP)
13
possible outcomes. We can also combine our judgments or our final choices obtained from a group when we wish to cooperate to agree on a single outcome (Saaty, 1999).
The Analytic Network Process (ANP) is a generalization of the Analytic Hierarchy Process (AHP), by considering the dependence between the elements of the hierarchy. Many decision problems cannot be structured hierarchically because they involve the interaction and dependence of higher-level elements in a hierarchy on lower- level elements. Therefore, ANP is represented by a network, rather than a hierarchy. The Analytical Network Process (ANP) is a general theory of relative measurement used to drive composite priority ratio scales from individual ratio scales that represent relative measurement of the influence of elements that interact with respect to control criteria (Saaty, 1999). ANP is one of the multivariate decision making methods. It's useful when decision makers should consider multiple factors and choices.
The feedback structure does not have the top-to-bottom form of a hierarchy but a network, with cycles connecting its components of elements, which we can no longer call levels, and with loops that connect a component to itself. It also has sources and sinks.