TESTMICROSTRUCTURE PERMEABLE PAVEMENT USED DOMATO
STONE AS LOCAL MATERIAL FROM BANGGAI ISLAND WITH
ADEDTIVE BNA BLAND PERTAMINA
The lot deposit of Domato Stone as local material from sea location in Banggai island in half Sulawesi of Indonesia. Was still not be exploited better. Some reseaarch in the field of road construction showed that Domato Stone was powefull enough when mixtured asphalt structure.Permeable asphalt pavement or porous friction course is commonly knows as porous asphalt. The porous pavement used in japanes and europe. The pavement consists in a porous overlay allowing rainwater to flow down to the botton the overlay andthen to drain on the edges of the pavement.Quality of porous asphalt was developed to drain pavement surface flow through it’s pores, because of is specific propertis to mesure it’s ability to drain the water ( Permeability ), a special measuring device is required. This study is aimed to measure the coefficient of permebility using the constanthead permeability test at transportation laboratory Hasanuddin University. The result were compared with the previous study. The test included horizontal and vertical permeability.There types of gradation were in comporated to : British Graduation, Binamarga Gradation, and Australian Gradation. The tests were carried out at optimum bitumen content, the result shows that the vertical permeability of porous asphalt usig British Gradation were : 0,0914, 0,2841 and 0,2912 Cm/sec. Respectively meanwhile for horizontal permeability were 0,1168, 03212, 0,2897 Cm/Sec. The Marshall stabilities were at in countary to the permeabilities, the porousity were comparable to the permeabilities.The results of research indicates that porous asphalt mixture showed an influence on the value of the characteristics of porous asphalt particularly at concrete waste fraction grading 50% retained 1/2 " and 50% natural crushed stone retained 3/8" where the values obtained from the analysis of optimum binder content is 9.5%. Based on the Scanning Electron Microscope (SEM) can be seen the microstructure and content of chemical elements present in the porous asphalt which prove that all elements of the liquid asbuton and concrete waste can blend and bind well.
Key words : Gradation, Optimum bitumen content, Permeability porocity, Catambro Loss,X-Ray, SEM.
INTRODUCTION
Permeable asphalt pavement or porus friction course is commonly knws as porous asphalt. The porous pavement is commonly used in Europ and Japan. The pavement cousist in a porous overlay and then to drain on he edges to the pavement (Michael. E barret. Ph.D) [1]. The lot deposit of Domato stone in Indonesia was still not be exploited better. Among the exiting utilization of it most of it was exploited for traditional needs fireplace material, some last rasearch in the field of road construction showed that Domato stone was powerfull enough when mixtured material for pavemen stabilization. Domato stone is local material from sea location in the island of banggai half Sulawesi Indonesia. Its was kwarsit Dolomitan material Celebes (Car Donald. 1985)[2]. This Experimental be done for mesuring propertis permeability porous Asphalt with using Domato stone as Local material who was come from sea location at the Banggai Island half Celebes Indonesia [3].
Picture 1. Permeable Friction Course
Picture 2. Domato Stone (Local Containe Of Banggai island in half celebes )
X-ray Computed Tomography (CT) is a nondestructive imaging technology, capable of acquiring a 3D or 2D image of the internal structure of a solid object, such as asphalt concrete. The directing planar x-rays pass through the specimen, along several different paths and from different directions and are captured by the detector. The attenuations of x-rays within a specimen are recorded for calculating the linear attenuation coefficients, which may be used to represent the spatial locations of the different components of the specimen. After finishing the collection of attenuations for a full rotation of the specimen, it is vertically moved downward for scanning the next slice.X-ray CT was frequently applied in recent years to characterize cracks or any damage in asphalt mixtures by measuring the internal structure distribution of specimens, such as the locations of aggregates, as well as mastic and air voids. Image analysis techniques of X-ray CT images can be used to quantify damage parameters by measuring the cracking growth in mixtures under uniaxial loading. In order to obtain more accurate internal structure distribution, 2D cross-sectional CT images are needed to reconstruct 3D visualization images of the specimens. 2D cross-sectional CT images were obtained to measure air void distribution and crack size at different depths with asphalt specimens. After capturing 2D cross-sectional images, the 3D visualization image of the sample can be reconstructed for importing to computer to simulate the performance of asphalt mixture under various loading and environmental conditions. Benefiting from this non-destructive technology, the intact sample may still be used for engineering properties tests such as the dynamic modulus test and the flow number test. Hence, X-ray CT is an effective technology to study the relationship between asphalt microstructure and engineering properties.(Masad and co-workers1998) [5].
LITERATURE REVIEW
Procedure Of The Constant Head Test
This section summarizes the methodology followed when experiments were carried out to preparation of the measuring system. Tested cores were immersed in water overnight and shaken before being placed betweentwo pieces of rubber gaskets. The whole assembling was locked between the two metallicplates using the locking bolts. The tank was completely filled with water and theperistaltic pump was turned on for 30 minutes to evacuate the last air voids from the core.The air in the connection between the manometer tubes and the devices was flushed outusing a hose. When ready, the tank was drained until the water level was about 5cmabove the top plate. Note: the torque applied on the system was as high as possible,consistent with the structure of the porous asphalt core [6].
Run of the experiment
The hydraulic conductivity was measured by decreasing the flowrate. Between twomeasures, the level on the bubbler was calibrated and set to zero. A hydraulic gradientwas imposed on top of the open core surface by turning on one of the pumps. The levelswere read on the manometer or bubbler once the levels were stabilized. The flowratedelivered by the pump was then measured using the stopwatch and the laboratoryglassware. High flowrate measures were carried out with the Heidolph pump whereaslow flowrates were delivered by the VWR peristaltic pump. 12 to 18 different headdifference measures were reported for each core.
Porous asphalt is subject to clogging. The main measure for hydraulic conductivityconsiders that the vertical and radial hydraulic conductivities are equivalent since theslowest velocity drives the behavior of the other velocity inside the pavement. The pavement mightbe clogged on surface. An experiment was carried out in order to verify the veracity ofthe results. Experimented cores were drilled on their center by a core pin of 1.25 inches(1.59 cm) outer diameter at the TxDOT asphalt laboratory.
Comparing the situation to the one in, we have a uniform established headH1 imposed on the inner area of the cylinder at R= R1. The established head H2 is uniformover the radial periphery of the sample at R= R2.
derive the flow rate, which is considereduniform over the inflow and outflow surfaces this time.
dr
− =
1 2
2 1 r
R R ln ) H H ( b 2
Q K
(4)
As described, the same experimental procedure was followed during the verification tests.
Picture 4.Setup of the Testing Apparatus
X-Ray Computed Tomography
You and co-workers (2009) predicted a dynamic modulus of asphalt mixture by applying both two dimensional (2D) and three-dimensional (3D) Distinct Element Method (DEM) generated from X-ray CT images. The accordance with the AASHTO TP62-03 standard, a uniaxial compression test was conducted to measure the dynamic modulus of sand mastic and asphalt mixtures at different temperatures and loading frequencies. Cylindrical HMA specimens were loaded by haversine compressive stress for a range of temperatures (4, -6, and -18 ˚C) and loading frequencies (0.1, 0.5, 1, 5, 10, and 25 Hz). The dynamic modulus (|E*|) and phase angle were calculated by measuring recoverable axial strain. Figure 2.26 shows an example of the applied axial stress and the measured strain response versus time plots for an asphalt mixture specimen, tested at a temperature of 4˚C and a frequency of 5 Hz. Figure 2.27 shows the dynamic moduli of HMA mixtures measured for this study across a range of temperatures and loading frequencies. The dynamic modules were used as input parameters to predict the asphalt 45 mixture dynamic modulus in 2D and 3D DEM simulations and compared with both the experimental measurements results. You and co-workers (2009) reported that the 3D discrete element models can successfully predict the asphalt mixture dynamic modulus over a range of temperatures and loading frequencies. In contrast, 2D discrete element models under predicted the asphalt mixture dynamic modulus.
(a) (b)
Picture 5. Three-Dimensional Images of Air Void and the percentage Air Voids Distribution plot (a), and GPR Data (b) (Kassem et al. 2008).
METHODOLOGY
TESTING PERMEABILITY Limitation Of Darcy’s Law
v g k
K=
(5)
Where k is the intrinsic permeability, v the kinematic viscosity and g the gravity acceleration.
The intrinsic permeability is only a function of the matrix composing the porous media and its characteristics such as grain size distribution, tortuosity and porosity. For porous media, the Reynolds number (Re) can be defined as (Charbeneau, 2000):
v d q
Re =
(6)
Where q is Darcy’s velocity and d is the average grain diameter or d10 of the size distribution profile of the porous media. Experiments have shown that Darcy’s law remains valid as long as the Reynolds number doesn’t exceed a value between 1 to 10 (Venkataraman, 1999). As the Reynolds number doesn’t exceed this value, the flow remains laminar and is governed by viscous forces. However the inertial forces start to govern the flow through the porous media in transitional flow when Re becomes higher than the transition value. As the Reynolds number continues to increase, the flow becomes turbulent at some point (Bear, 1972).
Picture 6. Setup of the Testing Apparatus
RAIN FALL – RUN OFF RELATION FOR POROUS ASPHALT TESTING
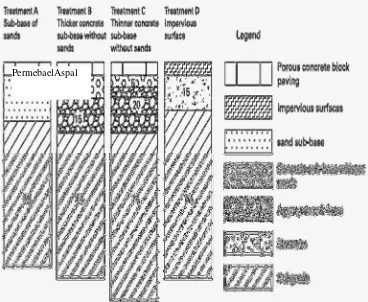
This experiment was carried out in Mentougou experimental station of Beijing Hydraulic Research Institute, which specializes in runoff utilization. Four experimental steel cells were used (Figure 1), with each cell measuring 0,40m x 0,40m. There were drainage boards under the cells, which had p 1.0cm holes. Water outlets were set up under the holes to monitor the quantity of the collection water. Pipes were used to collect both surface runoff and subgrade infiltration. Surface runoff and subgrade drainage from each cell were measured with beakers and flasks at the rear of each cell through drainage pipes for each of the three types of porous pavements and the impervious cell. Precipitation and runoff rates were recorded every 5 min. An artificial rainfall apparatus was constructed on an adjustable shelf. It consisted of 36 Rainbird
1,800 sprinklers, with an operating pressure of 0.1 MPa, a discharge rate of 0.1m3/h and a insufflation area
of 1.2m x 4.0 m. The uniformity of the rainfall intensity is 0.905 and is controlled by sprayer combination.
a).
Treatment A, porous concrete (permeable asphalt pavement) with Hot Mix aspahalt
gradation Binamarga. (Binamarga Model)
b).
Treatment B, porous concrete (permeable asphalt pavement) with permeable friction course
gradation. (British Model)
c).
Treatment C, porous concrete (permeable asphalt pavement) with porus asphalt gradation
Australia.block paving with subbase of 5 cm thick concrete lacking sand and 20cm thick
gravel. (Australia Model)
d).
Treatment D, impervious surface (Hot Mix asphalt gradasi rapat). (Close Gradation)
Mix Design Permeable Asphalt Pavement Testing
aggregate, i.e. 10 mm, 14 mm, and 20 mm. Asphalt content provisional then define by mean of asphalt content which meet with specification below
Picture 7.Rain fall – run off relation for porous asphalt testing
:Table 1. Summary of Design Limits (Alderon, A., et al 1997)
Design Criteria Type II Type I
Cantabro Loss – Unconditioned (%) < 20 < 25
Cantabro Loss – Conditioned (%) < 30 < 35
Air Void Content (%) 20 – 25 > 20
Loss of Running Off (%) < 0,3 -
Optimum asphalt content then defined by adding asphalt content provisional with loss of running off value. In Brithis method target aggregate grading and optimum asphalt content was defined from target air void content, which was generated from trial error samples using 3 (three) proportion of coarse aggregate, i.e. 80%, 85%, and 90 %, also some provisional asphalt content combinations.
The experiment works was divided into 3 (three) phases, for first phase was developed to investigate the properties of aggregates and asphalt qualities. The experiment work for second phase was developed to design the porous asphalt mix. In this phase Australian’s method and British method was used to define optimum asphalt content. In this phase, has result cantabro-loss, asphalt flow down, air void and density values. The experiment work for the last phase was developed to investigate the qualities of porous asphalt at optimum asphalt contents. In this phase, wheel tracking machine test was used to investigate the dynamic stability of mixes. Table 2. Shows aggregate grading was used in this experiment. Marshall Specimens were prepared at asphalt content range 4 %, 4, 5 %, 5 %, 5, 5 % and 6 %. In British method there 3 (three) modifications on proportion of coarse aggregate, i.e. 80 %, 85 %, and 90 %; also on proportion of mineral filler, i.e. 4 %.
Table 2. Aggregate Grading Used For Experiment (Percent passing) (Alderon, A., et al 1997) Sieve Aperture
(mm)
Nominal Mix Size 14 mm
19,0 100
13,2 95
9,5 50
6,7 27
4,75 11
2,36 9
1,18 8
0,6 6,5
0,3 5,5
0,15 4,5
0,075 3,5
For Australian’s method, optimum asphalt content then define by cantabro loss value and air void then adding by loss of running of value. For British method’s, optimum asphalt content was defined by cantabro
loss value and loss of running off value and air voids target to get optimum asphalt content and percentage of coarse aggregate.
X-RAY COMPUTED TOMOGRAPHY
X-ray computed tomography (CT) is an innovative, nondestructive technique used for obtaining digital information on the three-dimensional internal microstructure of solid materials. Different phases in solid materials may be distinguished using x-ray CT. In recent years, this imaging technique has been utilized to characterize the microstructure of asphalt mixes (Shashidhar 1999; Wang et al. 2001; Masad et al. 2002, 2004). In this study, the x-ray system in the Advanced Characterization of Infrastructure Materials laboratory at Universitas Negeri of Makassar was used to scan the test specimens (Figure 6). The setup includes two separate x-ray systems; the micro-focus and the mini-focus. The micro-focus system consists of a 225 kV x-ray source and an image intensifier detector, while the mini-focus has a 350 kV x-ray source and a linear detector. Due to the limited power of the micro-focus system, it is more applicable to scan small asphalt mixture specimens with better resolution. The mini-focus is more applicable to scan large asphalt mixture specimens with an adequate resolution of 0.17 mm/pixel. In this study, the mini-focus was used to scan the test specimens. The three example cross-sectional images from each depth (top third, middle third and bottom third) of all the specimens are presented
Picture 8. Components of the X-ray CT System at Texas A & M
RESULT AND DISCUSSION
Analysis Rainfal-Run Off
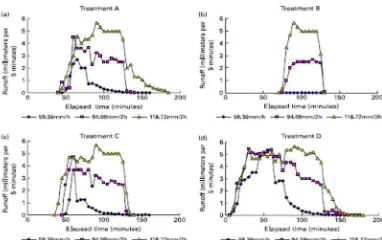
than the impervious pavement, with the flood peaks reduced by 35–100%, especially for Treatment B, with a recorded flow of zero.
Picture 9. Comparison of precipitation rate, surface runoff of three porous pavement cells and the impervious surface cell.
The order of infiltration coefficients for the different media investigated in this study is KCLS. KPCBP. KS . KIS, where KCLS, KPCBP, KS and KIS are the infiltration coefficients for the materials of concrete lacking sand, permeable asphalt pavement, subgrade and impervioussurface, respectively (see Picture 8). The factors discussed above explain the quantitative relationships of flood peak for the four surfaces FD . FC . FA . FB, where FD, FC, FA and FB signify the volume flood peaks for Treatments D, C, A and B, respectively.
Picture 10. Runoffs of different treatments under conditions with rainfall and without rainfall before artificial rainfall happened
A period of no rainfall was 5–10 min later than a period preceded by rainfall, with the flood peak decreased by 5% or more. There was no obvious difference of Treatment D between preceded rainfall events and non-preceded rainfall events. During the infiltration process, infiltration rates were affected by negative soil pressures before saturation. The lower the initial water content, the higher the grades of radical potential and soil suction. The soil water content following periods of no rainfall was lower and the porous pavement function of reducing runoff was distinct. So, conditions with rainfall and without rainfall had
different effects on the next rainfall infiltration and runoff. From Figure 5, it can be seen that Treatment B
had runoff beginning later and terminating earlier, with the shortest runoff time period of the three porous pavement systems for the same rainfall. With regard to Treatment D, runoff yield occurred with the inception of precipitation. The results demonstrate that the sub-base of Treatment B is the most effective surface for minimizing runoff by maximizinginfiltration. Effect of different rainfall intensities on runoff Rainfall intensity is another predominant factor in determining the cause of runoff. The higher the precipitation accumulation, the higher the runoff. Consequently, to avoid ground rainstorm water logging, the infiltration rate through the surface must exceed the maximum rainfall intensity. The effect of different rainfall intensities on runoff for the four surfaces is presented in Picture 9.
Picture 11. Runoffs of different treatments in three rainfall intensities.
Analysis Mix Design Permeable Asphalt Pavement
Table 4. shows properties of straight asphalt were used in the experiment. It shows that type of asphalt is straight asphalt penetration 60/70. In general, asphalt binder qualities comply with the requirement and recommended to apply for practical purpose.
Table 3. Properties of Asphalt
Properties Asphalt Value
Penetration (1/10 mm) 250C 64
Softening Point (0C) 55
Ductility (cm) > 140
Specific Gravity (gr/cm3) 1,034
Table 4. Shows properties of aggregates were used to the experiment. It shows that material comply with the request in specification and recommended to apply for practical purpose too.
Table 4. Properties Aggregates
Properties Asphalt Value
Coarse Aggregate
Bulk Specific Gravity (gr/cm3) 2,72
Saturated Specific Gravity (gr/cm3) 2,67
Apparent Specific Gravity (gr/cm3) 2,82
Absorption (%) 0,82
LA Test (%) 14,4%
Fine Aggregate
Bulk Specific Gravity (gr/cm3) 2,68
Saturated Specific Gravity (gr/cm3) 2,65
Apparent Specific Gravity (gr/cm3) 2,68
Absorption (%) 1,28%
Shows relation between cantabro loss and asphalt content. It illustrates that increasing in asphalt content, make decreasing in cantabro loss. It also shows that cantabro loss from Australian’s method rank between cantabro loss British method 85% coarse aggregate content and 90% coarse aggregate content. It explains that Australian’s method content more than 85 % of coarse aggregate content.
By adding asphalt content, it will increase aggregate surface area covered by asphalt film. This condition strengthening binding force between aggregates, therefore Cantabro loss value decrease. Cantabro loss value also affected by percentage of coarse aggregate. Higher the percentage higher cantabro loss value. Explanation of this condition is by increasing in percentage of coarse aggregate have an effect on decreasing in interlocking between aggregates.
Analysis X-Ray - Tomography
Based on the Scanning Electron Microscope (SEM) can be seen the microstructure and content of chemical elements present in the porous asphalt which prove that all elements of the liquid asbuton and concrete waste can blend and bind well.
Picture 12. Photo X-Ray Permeable Asphalt Pavement (British Standard)
Picture 13.Tescan vega3SB Spectrum: test
Element unn. C norm. C Atom. C Compound norm. Comp. C Error (3 Sigma)
[wt.%] [wt.%] [at.%] [wt.%] [wt.%]
---
Oxygen 41.56 42.98 58.53 0.00 15.03
Silicon 10.48 10.83 8.41 SiO2 23.18 1.46
Aluminium 8.06 8.33 6.73 Al2O3 15.74 1.29
Sodium 7.35 7.60 7.21 Na2O 10.25 1.59
Magnesium 4.74 4.90 4.39 MgO 8.12 0.92
Potassium 1.50 1.55 0.86 K2O 1.86 0.26
Calcium 16.39 16.95 9.21 CaO 23.71 1.58
Sulfur 6.64 6.86 4.66 SO3 17.14 0.84
--- Total:96.71 100.00 100.00
Picture 15. Tescan vega3SB
Spectrum: test
Element unn. C norm. C Atom. C Compound norm. Comp. C Error (3 Sigma)
[wt.%] [wt.%] [at.%] [wt.%] [wt.%]
--- Oxygen 20.01 40.36 58.46 0.00 9.11
Silicon 1.56 3.15 2.60 SiO2 6.73 0.36 Aluminium 1.68 3.39 2.91Al2O3 6.40 0.42
Sodium 2.74 5.52 5.57 Na2O 7.45 0.79 Calcium 16.39 33.05 19.11 CaO 46.25 1.68 Sulfur 5.37 10.83 7.83 SO3 27.05 0.76
Magnesium1.83 3.69 3.52 MgO 6.12 0.50
--- Total: 49.57 100.00 100.00
CONCLUSIONS
1.This study evaluated the performance of three porous pavement systems from the perspective of
infiltration and runoff, with very positive performance in comparison to a traditional impervious surface. All three porous pavement surfaces increased infiltration and decreased runoff. Larger porosity values, higher infiltration coefficients, thicker sub-base layers and lower initial water contents of the subgrade produce higher infiltration rates and smaller runoff coefficients. When rainfall infiltrates into a porous surface and its underlying sub-base, the outflow hydrograph will be influenced by the way in which the construction materials retain or delay flow. The quantitative relationship of runoff coefficients for the different media investigated in this study were: RD . RC . RA . RB, where RD, RC, RA and RB signify runoff coefficients of Treatments D, C, A and B, respectively. The optimal sub-base for reducing runoff by increasing infiltration was B. It had a thickness of 31 cm, consisting of a 6cm top layer of porous concrete and a 25 cm sub-base, consisting of 10 cm concrete without sand and a 15 cm aggregate base. Under a rainfall rate of 59.36 mm/h, the runoff coefficient of Treatment B was 0 compared to the coefficient of 0.85 for the impervious pavement. Sediment and sediment-associated pollutants will tend to be trapped within the upper layers of the construction above the sub-base stone.
2.Cantabro loss will be decrease with increasing in asphalt content, and decreasing in proportion of coarse
aggregate in mix. Air void will be increase with decreasing in asphalt content, and increasing in proportion of coarse aggregate in mix. Loss of running off will be increase with increasing in asphalt content, and increasing in proportion of coarse aggregate in mix. The Japan’s method resulted lower optimum asphalt content and higher dynamic stability compare to the Australian’s method, although it is required more evidence.
3.The Scanning Electron Microscope (SEM) can be seen the microstructure and content of hemical
REFERENCES
Alderon, A., John B., John O., John R. (1997) Open graded asphalt design guide. AustralianAsphalt Pavement Association.
Allex Eduardo Alvarez Lugo, 2009, Improving Mix Design and Construction of Permeable Friction Course Mixtures. Disserttion Departmen of Civil EngineringTexasUniversity.
Bing Zhanf, 2007. Digital Test of Composite Material Using X-Ray Tomography and Finete Element
Simulation.
Colorado Ready Mixed Concred Association, 2005. Specifiec’s Guide for Pervios Concrete Pavement
Design.
Fazleem Hanim Ahmad Kamar, Jaszline Nor Sarif, 2005. Design of Porus Asphalt Mixture to Performance Related Criteria.
Hao Ying, 2008, Using X-Ray Computed Tomography to Quantity Damage of Hot-Mix Asphalt in The
Dynamic Complex Modulus and Flow Number..
He Gui Ping, Wong Wing Gun, 2006. Effects of Moisture On Strength and Permanent Deformation of
Foamed Asphalt Mix Incorporating Rap Materials. Journal of Constraction and Building Materials. International Tecnology Exchange Program, 2005. Quite Pavement System In Europe.
Lori Kathryn Schaus, 2007. Porus Asphalt Pavement Design In Proactive Design for Cold Climate Use Thesis Departmen of EivilEngineringWaterlooUniversity.
Meor Othman Hamzah, Mohammad Rosli Mohammad Hasan, Martin Van de Van , 2011. Permeability
Loss In Porus Asphalt due to Binder Creep. Journal of Construction and Building Materials.
Nakanishi H., Sinichi T., Koji G. (1995) Suggestion to the improvement in durability of the function of porous asphalt pavement, Road Construction, August
R. Christopher Williams, 2009. Early Permebility Test For Asphalt Acceptance, Center for Transportation Research and EducationLowaStateUniversity.
StormWaterCenterUniversity of new Hampshier, 2007. Porus Asphalt Pavement and Infiltration Beds. Verhelst, F.A.D.B, Vervoort and G Marchal (1995). X-Ray Computerized Tomography Determination of