Faculty of Manufacturing Engineering
MIXED-LOAD MACHINE UTILIZATION IMPROVEMENT AND
TRANSFER BATCH SIZE OPTIMIZATION USING
HYBRID SIMULATION APPROACH
Hayati Mukti Asih
Master of Science in Manufacturing Engineering
MIXED-LOAD MACHINE UTILIZATION IMPROVEMENT AND TRANSFER BATCH SIZE OPTIMIZATION USING HYBRID SIMULATION APPROACH
HAYATI MUKTI ASIH
A thesis submitted
in fulfillment of the requirements for the degree of Master of Science in Manufacturing Engineering
Faculty of Manufacturing Engineering
UNIVERSITI TEKNIKAL MALAYSIA MELAKA
DECLARATION
I declare that this thesis entitle “Mixed-Load Machine Utilization Improvement and Transfer
Batch Size Optimization using Hybrid Simulation Approach” is the result of my own
research except as cited in the references. The thesis has not been accepted for any degree
and is not currently submitted in candidature of any other degree.
Signature : ...
Name : Hayati Mukti Asih
APPROVAL
I hereby declare that I have read this thesis and in my opinion this thesis is sufficient in terms
of scope and quality for the award of Master of Science in Manufacturing Engineering.
Signature : ...
Name : Assoc. Prof. Dr. Chong Kuan Eng
DEDICATION
To my beloved families:
i ABSTRACT
ii ABSTRAK
iii
ACKNOWLEDGEMENT
In the name of Allah, The Beneficent, The Merciful.
Alhamdulillahi rabbil `alamin. All praise belongs to Allah, who by his blessing and
mercy all righteous deeds are being perfected, and this thesis would not have been completed
without his divine guidance.
Firstly, I would like to express my sincere thanks to my supervisor, Assoc. Prof.
Chong Kuan Eng and Prof. Adi Saptari for their patience, guidance, advice, and motivation
to complete this thesis since the very beginning.
Muhammad Faishal who is always beside me, believing in me, and encouraging me
in the good things. The understanding, support, and patience of him is ark for me to stare the
future wiser.
I will always be grateful to my beloved parents, Achmad Kartubi and Qurrotu Aini
for their prayers, love, and patience. The spirit of their prayers and smiles is always adorned
the peace of this heart to pursue a dream. Also, perfect thing cannot be achieved without
their sincerity.
I also want to thank my lovely sister, Hayati Puji Astuti, who always giving me a
support and cheerfulness.
Lastly, friendship and togetherness have been always there for all my Indonesian and
Malaysian friends. A beautiful moment and word of thanks always decorate for laughter and
iv
TABLE OF CONTENTS
DECLARATION
APPROVAL
DEDICATION
ABSTRACT i
ABSTRAK ii
ACKNOWLEDGEMENT iii
TABLE OF CONTENTS iv
LIST OF TABLES viii
LIST OF FIGURES x
LIST OF APPENDICES xiii
LIST OF ABBREVIATIONS xiv
LIST OF PUBLICATION xv
CHAPTER
1. INTRODUCTION 1
1.1. Introduction 1
1.2. Company Background 2
1.3. Problem Statement 4
v
1.5. Research Objectives 5
1.6. Research Scopes 6
1.7. Organization of the Thesis 6
2. LITERATURE REVIEW 8
2.1. Operation Management 8
2.1.1. Production Planning and Control 9
2.1.2. Loading 12
2.1.3. Transfer Batch Size (TBS) 24
2.2. Hard Disc Drive Manufacturing System 27
2.2.1. Hard Disc Drive Manufacturing System Problems 28
2.3. Simulation 29
2.3.1. Why Simulation 31
2.3.2. Simulation in Manufacturing 32
2.3.3. Simulation Optimization 39
2.4. Multi Criteria Decision Making (MCDM) analysis 41
2.4.1. Analytic Hierarchical Process (AHP) 42
2.4.2. Technique for Order Preference by Similarity to Ideal Solution (TOPSIS) 44
2.5. K-Chart 45
vi
3. RESEARCH METHODOLOGY 50
3.1. Introduction 50
3.2. Detail Company`s Background 50
3.3. Research Design 54
3.3.1. Phase 1: Preliminary Study 56
3.3.2. Phase 2: Experimental Design 1 58
3.3.3. Phase 3: Experimental Design 2 60
3.3.4. Documenting and Reporting 60
4. DEVELOPMENT OF MODELS AND EXPERIMENTS 62
4.1. Introduction 62
4.2. Process Flow in Case Company 62
4.3. Conceptual Modeling 64
4.3.1. Scope of the Model and Level of Details 65
4.3.2. Assumptions 67
4.4. Model Data 67
4.5. Model Translation in ProModel® 7.5 Simulation Software 72
4.6. Verification and Validation 90
4.7. Warm-up Determination 94
4.8. Number of Replications 97
4.9. Experimentations 98
vii
4.9.2. Experimental Design 2 113
5. RESULTS AND DISCUSSIONS 118
5.1. Introduction 118
5.2. Results for Experimental Design 1 118
5.2.1. Result of Mathematical Model for Mixed-load Tester 118
5.2.2. Results of Simulation Modeling 126
5.2.3. Results of Identification of the Best Scenario 130
5.3. Results for Experimental Design 2 136
5.4. Summary of Experimental Results and Discussion 138
5.5. Research Contributions 140
6. COCLUSIONS AND RECOMMENDATIONS 142
6.1. Conclusion 142
6.2. Recommendations 144
REFERENCES 145
viii
LIST OF TABLES
TABLE TITLE PAGE
2.1 A Summary of Related Literature on Machine Loading Problem in Various
Applications 18
2.2 Applications and categorization of simulation technique 35
3.1 The Historical Data Throughput 52
4.1 Scope of the Model 65
4.2 Level of Detail 66
4.3 Testing Time and Processing Time of Product T (Standard Time) 68
4.4 Current Mixed-load Tester Model 70
4.5 Testing Time Distribution of the Automatic Testing Process and 85
4.6 Input Quantity Distribution 89
4.7 Validation: Student T-Test for Throughput 91
4.8 Validation: Student T-Test for Tester Utilization 92
4.9 Results from Five Replications of Throughput Data 94
4.10 Scenarios of the Mixed-load Tester 104
4.11 Inputs for Calculating the Allocation Problem 105
4.12 Pairwise Comparison of Each Grade (adopted by Chen et al., 2009) 110
5.1 The Mixed Loading of Tester A for Scenario 1 120
5.2 The Hourly Loading of Tester A for Scenario 1 121
ix
TABLE TITLE PAGE
5.4 The Hourly Loading of Tester B for Scenario 1 124
5.5 The Scenarios of Mixed-load Tester with the Number of Testers 125
5.6 The Hourly Loading for All Product Families in Tester A and Tester B 126
5.7 Confidence Interval of the Six Scenarios 128
5.8 The AHP Results for Six Selected Scenarios 130
5.9 Normalized Decision Matrix 131
5.10 The Weighted Normalized Decision Matrix 132
5.11 Positive Ideal Solution 133
5.12 Negative Ideal Solution 133
5.13 Positive Ideal Separation 134
5.14 Negative Ideal Separation 134
5.15 The Relative Closeness to the Ideal Solution 135
5.16 The Comparison Results of AHP and TOPSIS 135
5.17 The Differences of Scenario 1 and Scenario 2 136
5.18 A Summary Confidence Interval and Prediction Interval for Throughput, System
WIP, and Tester Utilization for the Transfer Batch Size of 86 units 136
x
LIST OF FIGURES
FIGURE TITLE PAGE
1.1 General Process Flow Diagram 3
1.2 Layout of Automatic Testing and Label Printing Processes 3
1.3 Average Tester Utilization: Current System versus Target 4
2.1 The General Process Flow of the HDD Manufacturing System 27
2.2 Research K-Chart 47
3.1 Back-end Process 51
3.2 The Operation Process 54
3.3 Research Design 55
3.4 The Details of the Hybrid Simulation Approach for Mixed-load Tester 61
4.1 Layout of the Automatic Testing and Label Printing Processes 63
4.2 Operation Process Flow Diagram 64
4.3 The Model Translation of the Base Model using the ProModel 7.5 Simulation
Software 73
4.4 The Entities using the ProModel 7.5® Simulation Software 74
4.5 The Locations in ProModel 7.5® Simulation Software 75
4.6 The Locations of Sample Tester Group 76
4.7 The Resources in ProModel 7.5® Simulation Software 77
4.8 The Operator and Robot Paths for the Automatic Testing Process 78
xi
FIGURE TITLE PAGE
4.10 The Routings of the Automatic Testing Process 79
4.11 The Routings using the ProModel® 7.5 Simulation Software 81
4.12 The Routings of Product T 82
4.13 The Routings of Product A, B, and S 83
4.14 The Entity Operation 84
4.15 The External File 85
4.16 Generate Testing Time of Product S 86
4.17 Export Data: Testing Time of Product S 86
4.18 The Entity Arrival using the ProModel 7.5® Simulation Software 87
4.19 The Auto::Fit of Distribution: Input Quantity of Product S 87
4.20 Summary of Goodness of Fit: Input Quantity of Product S 88
4.21 Goodness of Fit: Input Quantity of Product S 88
4.22 Export Data: Input Quantity of Product S 89
4.23 The Warm – Up Determination 97
4.24 The Number of Replications Determination 98
4.25 Model Input, Process, and Output 99
4.26 The Input, Process, and Output of Simulation Modeling 105
4.27 The Simulation Model of Scenario 1 for Experiment 1 108
4.28 AHP Model for Scenarios of Mixed-load Tester 110
4.29 Simulation Optimization Model 113
4.30 The Pallet Run 114
4.31 Macros Tool Box in the ProModel® 7.5 Simulation Software 115
4.32 Decision Variable Determination 115
xii
FIGURE TITLE PAGE
4.34 Simulation Parameter 117
5.1 The Proportion of the Mixed Loading in Tester A for Scenario 1 121
5.2 The Proportion of the Mixed Loading in Tester B for Scenario 1 124
5.3 The Average of Simulation Results for All Scenarios 127
5.4 The Improvement for system WIP 137
5.5 The System WIP in the SimRunner® Optimization Software 138
xiii
LIST OF APPENDICES
APPENDIX TITLE PAGE
A Historical Data of Throughput 163
B Verification Form 164
C Data of Testing Time 166
D Historical Data of Throughput for Each Model 168
E Historical Data of Input Quantity 169
F The Model Elements of Base Model 171
G Historical Data of Tester Utilization 174
H Simulation Results for All Scenarios with Three Replication Runs 175
I The Simulation Results of Scenario 1 177
J The Optimization Results 185
xiv
LIST OF ABBREVIATIONS
AHP Analytic Hierarchy Process
FIFO First-in-First-out
HDA Hard Disk Assembly
HDD Hard Disk Drive
MCDM Multi Criteria Decision Making
OM Operation Management
PPC Production Planning and Control
TBS Transfer Batch Size
TH Throughput
TOPSIS Technique for Order Preference by Similarity to Ideal Solution
xv
LIST OF PUBLICATION
1. International Journal
Hayati Mukti Asih and Chong Kuan Eng (2014). Throughput and Tester Utilization
Improvement in the Hard Disk Drive Assembly Line using Hybrid Simulation Approach.
Advanced Science Letters, Vol. 20, No. 02.
2. Proceeding
Hayati Mukti Asih and Chong Kuan Eng. Throughput and Tester Utilization Improvement
in the Hard Disk Drive Assembly Line using Hybrid Simulation Approach. The 2013 Annual
International Conference on Advances Technology in Telecommunication, Broadcasting,
1 CHAPTER 1
INTRODUCTION
1.1. Introduction
Current technological development has increased the competitiveness in the
manufacturing system, especially for hard disk drive (HDD) industry. In addition, the
companies are required to focus on the job allocation of every machine and transfer batch
size issues due to the high production volumes and variety of products. In the real world,
many uncertainties influence the performance of a production system. According to Ho
(1989), these uncertainties are caused by operating variables (i.e. the uncertainty of
production yield, lead time, quality, product development, etc.) and environmental factors
(i.e. the uncertainty of demand and supply).
One of the essential performances of the production system is machine utilization.
Improving the tester utilization will result in achieving the production target based on
customer order. In addition, another way to achieve good production performance measure
is the work-in-process (WIP). The system WIP is the amount of product waiting in the
production system. It could be the raw material, in-progress product and finished product.
Reducing the WIP level yields increase the throughput, reduces cycle time and reduces cost
as well.
Allocating jobs with stochastic input parameters, high product mixes and long
production process time make it difficult to investigate the system performance through
analytical methodology. This research, which is based on a case study of an HDD company,
2
problems. The mixed-load tester problem is the ability of a tester to simultaneously load
multiple product families.
1.2. Company Background
This research is based on a case study of a back-end process of an HDD
manufacturing system located in Petaling Jaya, Malaysia. The Backend process is a testing
and inspection process after the completion of a one piece flow of Hard Disc Assembly
(HDA) at the Cleanroom. The process flow in the assembly line is presented in Figure 1.1.
In these processes, there are two types of product produced in this company are 2.5”
HDD and 3.5” HDD. There are more than twenty product families that are produced for both
product types whereas each product family has different process flows, different production
volumes and different testing process. Hence, this makes the HDD company more complex.
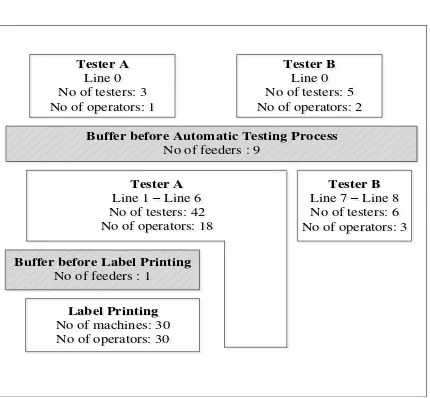
This research focuses on the automatic testing and label printing processes. The
layout is shown in Figure 1.2. In the automatic testing process, there are two stages, i.e.
Tester A and Tester B. It consists of seven lines for Tester A and three lines for Tester B.
The feeder is the one who distributes the amount of drives from the buffer before automatic
testing process to the small buffer which is close to each tester, then takes the tested drive to
the next stage. A feeder is responsible for handling a line. Then, an operator loads and
unloads drives to testers. On the other hand, in label printing process, the duty of the operator
is to print the label on each drive and the feeder is to distribute the drives to each small buffer
3
Clean Room
Clean Room PCBA AssemblyPCBA Assembly Helium Charge and Seal Installation
Helium Charge and
Seal Installation Filler TestFiller Test Seal RemovalSeal Removal
Helium
Figure 1.1 General Process Flow Diagram
Tester A
Buffer before Automatic Testing Process No of feeders : 9
4 1.3. Problem Statement
The observations of the production process and from the discussions with the
managers, IE planner, plant supervisors and production line associates found that the
characteristics of the shop floor are complex. The automatic testers are employed have
almost three thousands slots that able to load multiple product families, simultaneously.
Moreover, there are more than fifteen models in all product families with different testing
durations. In addition, to the high product varieties, each product family undergoes different
production process flow making the problem more complicated.
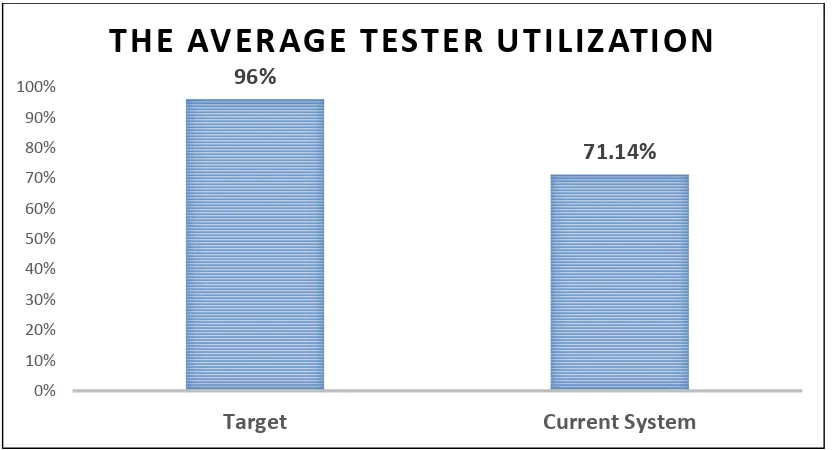
Therefore, the company is difficult to achieve the target of average tester utilization
as 96%. While, the current system is 71.14% for 35 days. Figure 1.3 presents the gaps of
the average tester utilization between the current system and the company`s target.
Figure 1.3 Average Tester Utilization: Current System versus Target
Because of the problem considering the uncertainties in production system, the