POTENTIAL AREA PRODUCING FEED SUPPORTING
THE DEVELOPMENT OF CATTLE POPULATION
IN TANAH LAUT REGENCY
LASTI PITRIANI
GRADUATE SCHOOL
BOGOR AGRICULTURAL UNIVERSITY
BOGOR
STATEMENT
I, Lasti Pitriani, hereby state that this thesis entitled:
POTENTIAL AREA PRODUCING FEED SUPPORTING THE DEVELOPMENT OF CATTLE POPULATION IN TANAH LAUT REGENCY
Are results of my own working during the period of December 2010 until Mei 2011, and that it has not been published before. The content of the thesis has been examined by the supervisory committee and the external examiner.
Bogor, August 2011
Lasti Pitriani
ABSTRACT
LASTI PITRIANI. Potential Area Producing Feed Supporting the Development of Cattle Population in Tanah Laut Regency. Under supervision of TOTO TOHARMAT AND HARRY IMANTHO
Forage has very important role as a ruminant feed that can not be replaced by the concentrate. Almost 90% of ruminant ratio comes from forage. There is a continuing conversion of forage producing areas into other uses resulting in the reduction of forage availability 30 %. Remote Sensing (RS) technology and Geographical Information System (GIS) can be used in agricultural mapping to manage natural resources in certain. This study aimed to identify the potential of areas producing feed and determine its availability in supporting the development of cattle population in Tanah Laut Regency. The showed 72,902 ha of the area including pasture (6,324 ha) maize field (25,622 ha), paddy field (40,956 ha) has potential to produce forage of 234,404 tons dry matter per year. One sub district in the regency was classified as moderate CCI area. The RS technology and GIS can be used to calculate feed availability development of cattle population. Tanah Laut regency has a potential capacity to accommodate more cattle population.
ABSTRAK
LASTI PITRIANI. Lahan yang Berpotensi Memproduksi Pakan untuk Mendukung Pengembangan Sapi Potong di Kabupaten Tanah Laut. Di bawah bimbingan dari TOTO TOHARMAT DAN HARRY IMANTHO
Rumput mempunyai kedudukan yang sangat penting sebagai pakan ternak yang tidak dapat digantikan seluruhnya oleh pakan konsentrat. Hampir 90% komponen ransum ternak ruminansia berasal dari hijauan. Terdapat kecenderungan alih fungsi lahan sumber hijauan menjadi lahan lain sehingga menyebabkan ketersediaan hijauan berkurang sampai 30%. Teknologi remote sensing (RS) dan geographical information system (GIS) dapat digunakan untuk pemetaan kawasan dan lahan pertanian. Penelitian ini bertujuan untuk mengidentifikasi lahan yang berpotensi sebagai pakan ternak dan menentukan tingkat ketersediannya di kabupaten Tanah Laut. Hasil study menunjukan bahwa luas area yang berpotensi sebagai pakan ternak adalah 72,902 ha yang meliputi pasture 6,324 ha, lahan jagung 25,622 ha, dan lahan padi 40,956 ha. Dari total area tersebut potensi produksi pakan hijauan di kabupaten Tanah Laut sekitar 234,404 ton bahan kering per tahun. Indeks daya dukung dari 11 kecamatan di kabupaten Tanah Laut menunjukan satu kecamatan dengan criteria daya dukung tinggi, dan sepuluh kecamatan dengan daya dukung sedang. Teknologi RS dan GIS dapat digunakan untuk menghitung ketersediaan pakan untuk pengembangan populasi ternak di kabupaten Tanah Laut.
SUMMARY
LASTI PITRIANI. Potential Area Producing Feed Supporting The Development of Cattle Population in Tanah Laut Regency. Under supervision of TOTO TOHARMAT AND HARRY IMANTHO
Tanah Laut regency is known as cattle-producer areas in South Kalimantan province. Almost 40% of meat in South Kalimantan is supplied from Tanah Laut regency. The predicate of beef cattle produces regency will be achieved if the cattle population is supported by the adequate of feed resources availability including land, labor and cattle population.
Remote sensing (RS) in technique to gather information about the object and its environment from a distance without a physical touch. The main purpose of RS is to collect data on natural resources and environment. This technique usually produces some form of image than can be further processed and interpreted to produce useful data for applications in agriculture, forestry, geography, geology, and archeology. The data obtained from RS can be linked to the various kinds of GIS to manage such as agriculture resources the region.
Land is the main production factor in animal production activity to establish the housing and to produce forage. In order to achieve the optimum production of beef cattle, it is necessary to determine the land capability to produce forage continuously in sufficient quantity and quality.
One of the constrain in the improvement of beef cattle is the reduction of forage producing are. There is continuing land use availability 30%. Tanah Laut in South Kalimantan the largest beef cattle population of 91,026 heads. Dry matter intake of beef cattle was assumed of 20 kg per head per day. Therefore Tanah Laut regency dry forage of 1,820 tones per day or approximately 655,387 tones per year. To ensure the availability of feed in Tanah Laut regency, it necessary to determine the potency of the area in producing feed especially crop, oil by product.
This study aimed to identify the potential of areas in producing feed and determine its availability in supporting the development of cattle population in Tanah Laut regency.
The study was conducted in Tanah Laut regency from December 2010 until May 2011. Secondary data collection and field surveys were conducted in the Tanah Laut regency. Data processing and analysis were performed at the Laboratory of RS and GIS, Master of Science in Information Technology (MIT), Bogor Agricultural University.
This study was commenced processing Landsat TM7 using supervised classification. The data was validated the ground check (ground truth). The results of the classification were used as a reference mapping the potency of areas in producing forage and determine availability for beef cattle in the regency.
between the actual the image coordinate system with the geographic coordinate system using the sensor calibration data, or ground control point (GCP). Radiometric minimize bias related to digital/pixel brightness values measured on the histogram data channels of spectral imagery. Radiometric correction was based on the minimum histogram method. Image classification used in this study was guided classification by the Likelihood Standard Neighbor classification type. Supervised classification used training areas based on the coordinates of the points taken in the field using GPS. The information in each pixel was obtained with the help of computers, and clustering was done automatically by a computer based on the spectral distribution of the digital number. The areas were classed into grassland, farmlands, forest, settlements, water body. Accuracy evaluation was performed to calculate the amount of landcover classification errors, so it can be determined magnitude of the percentage of accuracy of mapping. Accuracy of analysis was performed by using a confusion matrix/contingency matrix. Accuracy is calculated using user’s accuracy, producer’s accuracy, overall accuracy and kappa accuracy.
Landcover including pastures, paddy and maize fields were obtained from classification of the image. Availability of forage dry matter (DM) from the landcover calculated based on the following formula: (1) pasture = (7.5 x land area x 0.23) tons/year DM; (2) Paddy straw = (2.5 x land area x 0.70) tons/year DM; (3) Maize straw = (6.0 x land area x 0.75) tons/year DM.
Carrying Capacity (CC) and Carrying Capacity Index (CCI) were calculated based on forage availability value and the standard deviation (SD) of CCI were grouped into three categories: (1) low CCI category which had value less than the average minus standard deviation; (2) average CCI category which had values in the rang between the average minus and plus standard deviation; (3) high CCI category which had higher values than the average value of CCI plus of standard deviation.
Fifty seven ground check point coordinates related to landcover consisting of mining, swamps, forest, rubber plantation, palm oil plantation, pasture, maize, paddy field and housing areas were taken 11 sub district. The results of classification and interpretation of landsat TM images of 2010 in Tanah Laut regency indicated that the largest land cover was palm oil plantation (42.25%), while the smallest land cover was the shadow (1.43%). The potential landcover producing feed were maize field 25,622 ha or (6.78%), pastures 6,324 ha or (1,67%), and paddy field 40,956 ha or (10.84%). The overall accuracy of calculation result of 84.3% and kappa accuracy was 80% which were higher the acceptable level of 70%.
Potential area producing forage in Penyipatan, Jorong, Pelaihari and Bumi Makmur sub district was 11,866 ha, 11,029 ha, 9,185 ha and 2,806 ha respectively. The total forage dry matter potentially produced in Tanah Laut regency was 234,403 ton per year. Pastures potentially produced (47,431) tons DM per year, maize field produced (115,299) tons DM per year, and paddy field produced (71,673) tons DM per year.
carrying capacity of (2,168 AU with beef cattle population of 131 AU could be improved by utilizing the available pasture from other nearby area producing forage.
One sub district was included in high potential area, and ten sub districts were moderate potential area. The region having a high carrying capacity could be recommended as a center for the development of beef cattle and a supplier of feed to other region which low CCI category. Carrying capacity of the regions was associated with their livestock population. Tanah Laut, with the carrying capacity of 102,808 AU and cattle population 57,115 AU allowed the addition of cattle population of 45,692 AU.
The conclusions of the study were: (1) the potential are producing forage in the of Tanah Laut regency (72,902 ha), with the potential forage dry matter production 234,403 tons per year; (2) Tanah Laut regency had one sub district with high potential CCI and ten sub district with moderate potential CCI; (3) Tanah Laut regency had carrying capacity of 102,808 AU, cattle population of 57,115 AU and allowed the additional population 45,692 AU.
It is recommended that to achieve the vision of the livestock development in Tanah Laut as a local resources based beef cattle center and an agribusiness oriented regency, an integrated agriculture supplying other alternative feed sources such as crop products, palm oil by product, and the integration of beef cattle into palm oil and rubber plantation should be applied in the regency.
Copyright ® 2011, Bogor Agricultural University Copyright are protected by law,
1. It is prohibited to cite all or part of this thesis without referring to and mentioning the source
a. Citation only permitted for the sake of education, research, scientific writing, report writing, critical writing or reviewing scientific problem.
b. Citation does not inflict the name and honor of Bogor Agricultural University.
POTENTIAL AREA PRODUCING FEED SUPPORTING
THE DEVELOPMENT OF CATTLE POPULATION
IN TANAH LAUT REGENCY
LASTI PITRIANI
A Thesis is submitted for the degree of Master of Science in Information Technology for Natural Resources Management Study Program
GRADUATE SCHOOL
BOGOR AGRICULTURAL UNIVERSITY
BOGOR
Research Title : Potential Area Producing Feed Supporting the Development of Cattle in Tanah Laut Regency
Student Name : Lasti Pitriani Student ID : G 051090111
Student Program : Master of Science in Information Technology for Natural Resource Management
Approved by, Advisory Board :
Prof. Dr. Ir. Toto Toharmat, M. Sc
Supervisor Co-Supervisor
Harry Imantho, S.Si. M.Sc.
Endorsed by,
Program Coordinator, Dean of the Graduate School
Dr. Ir. Hartrisari Hardjomidjojo, DEA Dr. Ir. Dahrul Syah, M.Agr. Sc.
ACKNOWLEDGEMENT
I would like to thanks to all people who have helped and assisted me during the preparation on this thesis.
First of all, I would like to thanks to Prof. Dr. Ir. Toto Toharmat, M. Sc. and Harry Imantho, S. Si. M. Sc., who acted as my supervisor and co-supervisor, for their guidance, helped and supported during my research.
I would like to thanks to Ministry of Agriculture for financial support during two years of my study. Without this support, this research would not be possible.
I would like to thanks also Dr. Ir. Hartrisari Hardjomidjojo, DEA as MIT Program Coordinator, MIT Lecturers, and Staffs, thank you for helping and supporting me.
I appreciate the advice and assistance of my friend and my colleagues.
• Principle School of Agriculture Development Pelaihari, and Staff cooperation
• Head Animal Husbandry Office Province South Kalimantan • Bapak Sujoni, drh., you’re nice friend
• MIT 99, I really appreciate our togetherness, our spirit of “keep moving”, and know we support each other to finish our study
• Alumni School of Agriculture Development, for their support and prayers.
My parents, my husband, my daughter, my brother, my sister, your love and support was continuous and without limits.
Thank you.
And finally, I wish to thanks to all the other not mentioned individually for their assistance.
Bogor, August 2011
CURRICULUM VITAE
The author was born in the Hulu Sungai Selatan South Kalimantan on 10 January 1967 from family of Bapak Abdul Khair Sadjali and Ibu Hj. Rosmaliah. The author is the second child of eight children.
In 1986 the author graduated from the SPP-SNAKMA (Sekolah Pertanian Pembangunan-Sekolah Peternakan Menengah Atas Negeri/School of Agricultural Development) in Pelaihari. In the same year the author was hired in SPPN Pelaihari. In 1995 the author had scholarship to study in APP (Akademi Penyuluhan Pertanian/Agriculture Extension Academy) in Bogor and graduated in 1998. Undergraduate education was obtained from the University of Malang Tribhuwana Tungga Dewi in the Faculty of Animal Husbandry and Production majors and graduated in 2003. Opportunities for continuing education at the Graduate School of Bogor Agricultural University obtained in 2009 and enrolled the MIT (Master Information Technology) program for the NRM (Natural Resources Management). The scholarship for the master program was obtained from the Agency for Agricultural Human Resources Development Ministry of Agriculture.
TABLE OF CONTENTS
Pages
TABLE OF CONTENTS ……… xiii
LIST OF TABLE ……… xv
LIST OF FIGURES ……… xvi
LIST OF APPENDICES ……… xvii
I. INTRODUCTION ……… 1
1.1. Background ……… 1
1.2. Scope of Study ……… 4
1.3. Objectives ……… 4
II. LITERATURE REVIEW ……… 5
2.1.Cattle Feed ……… 5
2.2.Land Feed ……… 6
2.3.Supporting Resources ……… 7
2.4.Geography Information System ……… 7
2.5.Remote Sensing ……… 8
2.6.Remote Sensing and GIS Applications ……… 8
III.METHODOLOGY ……… 11
3.1.Time and Location ……… 11
3.2.Data and Tools……… 12
3.3.Research Framework..………..…… 12
3.4.Methods 13 3.4.1. Ground Check ……….……… 13
3.4.2. Image Processing ……… 13
3.4.2.1. Geometric Correction ……… 14
3.4.2.2. Radiometric Correction ……… 14
3.4.2.3. Cropping ……… 15
3.4.2.4. Supervised Classification ……… 15
3.4.2.5. Validation Result of Classification ……… 15
Pages
3.4.4. The Availability of Forage Level ………. 17
IV.RESULT AND DISCUSSION.………..………. 19
4.1. Ground Check ……… ……… 19
4.2. Landcover ……… 19
4.3. Validation of the Lancover Classification Result ……… 21
4.4. Potential Feed ……… 22
4.4.1. Forage Production in Tanah Laut Regency ……… 22
4.4.2. Availability of Feed ……… 25
V. CONCLUSIONS AND RECOMMENDATION ……… 29
5.1.Conclusions ……… 29
5.2.Recommendation ……… 29
REFFERENCE ……… 31
LIST OF TABLE
Pages
Table 1. Type and Sources of Secondary Data ……… 12 Table 2. Paddy and Maize Planting Patterns in Tanah Laut Regency ……… 17 Table 3. Landcover in Tanah Laut Regency ……… 20 Table 4.Confusion Matrix of Landcover Classification Result in Tanah Laut
Regency
22 Table 5. Forage Area in Tanah Laut Regency ……… 23 Table 6. Forage Production Potential in Tanah Laut Regency ……… 23 Table 7. Carrying Capacity Index of Forage Availability Level in Tanah Laut Regency……….
LIST OF FIGURES
Pages
Figure 1. Tanah Laut Regency ……… 11
Figure 2. Research Framework ……… 13
Figure 3. Error Matrix ……… 16
Figure 4. GCP in Tanah Laut Regency ……… 19
Figure 5. Landcover Distribution in Tanah Laut Regency ……… 21
LIST OF APPENDICES
Pages
1
I.
INTRODUCTION
1.1. Background
Development of animal husbandry is an integral part of agricultural
development and national development in order to improve nutrition, to increase
income and welfare of farmers, to provide employment, to conserve foreign exchange
and to increase food Security State.
Beef cattle are one rumination cattle that have the greatest contribution as a
producer of meat. Up to now, Indonesia has not been able to meet the needs of
domestic beef that tend to increase every year. It is estimated that in 2011 the local
meat production is only about 316.1 thousand tons, whereas the estimation of this
year reached is 424 thousand tons. To meet the needs of meat, the government will
import 140 tons of meat, or about 33% of the total beef demand during 2011
(Direktorat Pangan , 2010).
In order to meet the national needs of meat, the Government of the Republic
of Indonesia launched a program of self-sufficient of National Beef in 2005-2010,
then another program of Accelerating Achievement of Self-sufficient of Beef in
2008-2010. Because by 2010 the program has not been successful, then the
Department of Agriculture re-targets an advanced program to the self-sufficient of beef until 2014. To achieve these targets, the Directorate General of Livestock
establishes the policies of: (1) developing a center for breeding and fattening, (2)
revitalization of the institutional and functional human resources field, and (3)
supporting of facilities and infrastructure. Through the policy, it is expected that the
supply of domestic beef will be projected to increase from 67 percent in 2010 to 90
percent in 2014.
The vision of the Animal Husbandry of South Kalimantan Province is towards
2014 South Kalimantan will become a local source of cows and beef cattle as well as
self-sufficient of meat (Disnak Tala, 2009). This is supported by the potential of
2 land; there are about 166,604 ha for building, 190,039 ha for plantations, 129,254 ha
for fields, and 145,805 hectares for pastures and grazing. By the potential, it can be
said that beef cattle population in South Kalimantan in 2008 were 210,633 cows and
in 2009 there were 218,065 cows with the growth of 5% per year (Disnak KalSel,
2009). Nowadays, South Kalimantan has been able to meet the adequacy of meat for
local people and also has been able to supply the needs of meat, especially beef cattle
into the Province of Central Kalimantan and East Kalimantan. Even the Province of
Central Kalimantan is very dependent on the supply of meat from South Kalimantan.
Achieving the target and the predicate of beef cattle producer will be realized
if it is supported by the resources. Gunadi (1998) explains that in developing
livestock sector in a region, it needs to measure the potential of the available
resources. These resources include the availability of land, feed, labor and the
potential of the developed livestock. The potential is determined by the availability of
agricultural land, soil fertility, climate, topography, water availability, and the
existing agricultural patterns. Susetyo (1980) adds that in improving livestock
production rumination there is the triangular relationship exists between lands,
livestock, and livestock feed which is an organic unity. If one of them did not exist
then the generated production will not be satisfactory and may cause failure in
business. Land is the main capital as a place for rumination cattle to live as well as
producing forage. Therefore, it is required quality land in producing forage to achieve
the optimal improvement of livestock production.
On the other hand it should be recognized that one of the factors inhibiting the
development of beef cattle is increasingly narrowing the area of livestock grazing
allotment from time to time whether it is field acreage for grazing or forage crop
development and availability of forage feed which is greatly influenced by the
seasons. The lack of dry season and the abundant of rainy season cause the
availability of forage feed are unstable throughout the year. Not to mention the lack
3 marketing, can also take a negative influence on the development of animal
husbandry. Surely, it is necessary to find appropriate solution.
Feed for ruminants has been obtained and derived from pasture which
provides forage of pasture grasses and legume as a source of ruminant feed. The last
few years there is a tendency in decreasing productivity of grazing land as a provider
of food due to the change of land use. Land as grazing land has been converted into
agricultural land for rice fields, plantations and settlements. As a result, pasture
ecology as a base for cattle, especially for ruminant livestock, become diminishing
(Syamsu, 2006).
The Regency of Tanah Laut is known as cattle-producing areas in South
Kalimantan Province. Almost 40% of meat in South Kalimantan is supplied from
Tanah Laut. Every week at least 250 cows of Tanah Laut head out the regions in
South Kalimantan Province as well as to Central Kalimantan. In 2009 the population
of beef cattle reached 80 533 cows as compared to the year 2008 as many as 79,191
cows, and this population continues to be increased to 100,000 cows in the next year
(Disnak Tala, 2009).
Based on statistical data of the Regency of Tanah Laut in 2007, the total area
of pasture land was 13,755 ha and in 2008 the number was reduced to 13,205 ha
(BPS, 2007 and 2008). Thus the potential for grazing land as forage provider is also
decreased. If each head of cattle is assumed to require about 20 kg of fodder per day,
the need for animal feed is estimated to 1610.66 tons per day and need of 19327.92
tons in a year, not including other ruminants.
The development of beef cattle in the Regency of Tanah Laut in the future
faced with the problem of limited natural resources as the basis for the provision of
fodder. To ensure the availability of green fodder which remains all year round, then
it is needed another alternative such as agricultural waste (rice straw and maize straw)
4 1.2. Scope of Study
Animal feed is all that can be eaten by livestock in a form that can be digested
in part or entirely and does not interfere with the respective of animal health.
Generally, the ingredients of animal feed can be eaten, but not all the components in
the feed material can be digested by livestock. The ingredients of feed consist of
crops, crop yields, and also originating from livestock or animal. Almost 90% of the
main feed of herbivore cattle comes from forage, includes the remains of agricultural
produce such as rice straw, maize straw, rice bran, sugarcane tops, and peanut hay.
This study focuses on identifying areas of potential as a source of beef cattle
feed based on carrying capacity.
1.3. Objectives
The goal of this research is to identify the potential land for fodder and to
5
II.
LITERATURE REVIEW
2.1. Cattle Feed
Animal feed is all that can be eaten by livestock in a form that can be digested
in part or entirely and does not interfere with the respective of animal health. Animal
feed is the material that can be eaten, digested, and used by livestock. Generally, the
ingredients of animal feed can be eaten, but not all the components in the feed
material can be digested by livestock (Tilman et al. 1989).
The ingredients of feed consist of crops, crop yields, and also originating from
livestock or animal. (Tilman et al. 1989). Generally, livestock depends on the plant as
a source of feed. Almost 90% of the main feed of herbivore cattle comes from forage,
includes the remains of agricultural produce such as rice straw, maize straw, rice
bran, sugarcane tops, and peanut hay. Grass has a very important position as fodder
and cannot be replaced entirely by concentrate (Sutardi, 1980).
Feed has an important role for livestock, either for the growth of young
animals and to maintain life and to produce the products of cows (milk, calf, meat)
and energy for adult cattle. Another function of the feed is to maintain the immune
system and health. In order to grow as expected, the type of feed given to livestock
must be of good quality and in sufficient quantities. Food that is often given to
livestock work such as: forage and concentrates.
The source of livestock feed depends on the farming sector in a region. In an
area that has a farm field food the sources derive from agricultural-by-product,
otherwise in the area that has a system of dry land farming or moor animal feed
derive from natural grass. So far, most of the feed given to livestock in Indonesia are
local grass or natural grass, both originating from grazing land, agricultural waste,
6 2.2. Land Feed
Land plays an important role in farming systems. Land serves as a place of
production activities and is a factor of production in the livestock business, especially
as a source of fodder. The interaction of livestock with the land consists of three
aspects: (a) biological adaptations of livestock, (b) the ability of land to produce
forage, and (c) the patterns of maintenance and capacity of the available area
(Suharyanto, 2006).
Land is a major limiting factor for the development of ruminants. Utilization
of land for farming is based on the preposition that: (a) the land is a source of animal
feed, (b) all types of land is suitable for feed resources, (c) the use of land for
livestock is defined as the harmonization effort between the allotment of land with
agricultural production systems, (d) the relationship between land and livestock are
dynamic (Dirjennak, 1995).
Livestock industry in Asia is highly dependent on soil resources as a major
input for the bulk high-crude-fiber feeding forages required can only be supplied
economically from local sources (Lasmanawati, 2006). Potential sources of forage
land in Indonesia comes from the moor land, land in the rice field, annual crops,
fields, land that is overgrown with forage, grassland, and extemporary cultivated land
(Nitis, 1995).
Farm are intimately associated with the land, as beef cattle which are highly
dependent on the material and feed quality, feed quality livestock forage is largely
determined by soil fertility. According to Suratman et al. (1998), based on the needs
of land, livestock enterprises can be divided into two operating systems; namely
land-based agriculture farm and the non-land-base agriculture farm. Land-base agriculture
farm is the cattle with feed component comprise the bulk of forage crops; land is an
important factor as the environmental and food advocates.
Land resources which can be exploited by breeders such as: paddy fields,
grazing land, forest plantations and the people, with the level of density and intensity
depending on the diversity of plants, water availability and types of beef cattle. The
7 integration pattern which is a process of mutual support and mutual benefit, through
the use of cattle to cultivate the soil and manure as organic fertilizer. While the
wetland and land produce feed crops of rice straw and crop by-products that can be
treated as cattle feed. While the gardens and forests contribute in the form of natural
grass and other plant species. Utilization patterns of integration are expected to
increase the availability of fodder throughout the year, so it can increase production
and productivity of livestock (Riady, 2004).
2.3. Supporting resources
The supporting resources show the magnitude of the carrying capacity of the
environment to support animal life, which is stated in the number of union tail of the
area. The number of animals, which life can be supported, depends on biomass (the
organic plant material) available to the animal (Soemarwoto, 1983).
The levels of forage availability in a region is one of the most important factor
influencing population dynamics and contribute in the successful development of
livestock, especially cattle herbivores. According to Natasasmita and Murdikdjo
(1980), in calculating the potential of a region to develop livestock technically, it is
necessary to see the existing livestock population in the region associated with the
potential of forage produced by the region concerned.
2.4. Geography Information System
Aranoff (1989) describes the Geographic Information System (GIS) as a
computer-based system used to store and manipulate the geographic information. GIS
is designed to collect, to store, and to analyze the objects and phenomena where
geographic location is an important or critical characteristic to the analysis while Star
(1990) defines GIS as an information system designed to work with data spatially
referenced or geographic coordinates. Or in the other words, GIS is a database system
with special abilities in handling the spatial data referenced; in addition to a set of
8 GIS as a system composed of several components; namely hardware,
software, data and geographic information, and management.
2.5. Remote Sensing
Remote sensing is a technique to gather information of the object and its
environment from a distance without physical touch. The main purpose of remote
sensing is to collect data on natural resources and environment. This technique
usually produces some forms of the image further processed and interpreted to
produce useful data for applications in agriculture, archeology, forestry, geography,
geology, planning and other fields (Lo, 1995).
According to Lilesand and Keifer (1994) in Wijaya (2005) remote sensing
involves two main processes of data collection and data analysis. The elements of the
data collection process include: a) source of energy, b) energy traveling through the
atmosphere, c) the interaction between energy with the appearance on the earth, d) the
sensor aircraft and spacecraft or satellite, and e) the results in the establishment of
data and pictorial form or shape numeric. The use of sensors to record a variety of
electromagnetic energy emitted and reflected by the appearance on the earth. The
process of data analysis involves the testing data by using interpretation tools and
observation tools for analyzing pictorial data and computer to analyze sensor data
with the numeric data assisted by the reference of the resource studied.
2.6. Remote Sensing and GIS Applications
Needs of remote sensing technology combined with GIS for the purpose of
inventory and monitoring is very important, especially when associated with the
collection of data quickly and accurately. Besides collecting data by remote sensing
technology can reduce or even eliminate the influence of subjectivity. Remote
sensing and GIS can be combined to enhance the capabilities in terms of data
collection, data manipulation, data analysis and provides integrated spatial
9 Application of remote sensing is used to obtain information relating to the
condition of vegetation cover and/or current land use obtained by interpretation of
satellite imagery. By such process it was obtained the information of distribution and
the condition of permanent land cover and vegetation. Remote sensing is a
technology that can be utilized to provide the latest maps with time, effort and costs
which are relatively smaller for a very wide area (Sulistyo, 2004)
GIS has an important role in various aspects of our recent life. Through GIS,
a variety of information can be processed and analyzed and then linked to its location
on the earth's surface. GIS can be used to help in managing agricultural and
plantation resources such as in expanting the area of plants, trees, or waterways. In
addition, GIS could also be used to establish the crop, to develop the rotation of
cropping systems, and to perform the calculations on an annual basis against soil
degradation occurs due to differences in seeding, planting, or the techniques used in
the harvest. GIS is also used for mapping areas and farmland. By the mapping we can
10
III.
METHODOLOGY
3.1. Time and Location
The research was conducted in Tanah Laut Regency, consisting of 11
counties, from December 2010 up to May 2011. Data processing and analysis
performed at the Laboratory of Remote Sensing and GIS Master of Science in
Information Technology (MIT), Bogor Agricultural University, while the data
collection and field surveys was conducted in the Regency of Tanah Laut.
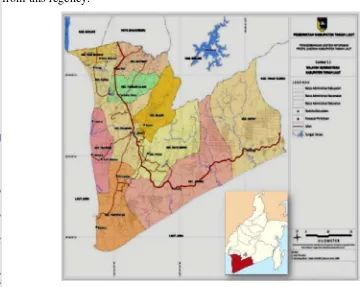
Tanah Laut Regency, is situated 114o 30’20 - 115o 23’31 East and 3o 30’33- 4o
11’38 South and has an area of 3,631.35 km2. Average temperature is 20,1o C – 34o C
and humidity is 80-83%. The area is dominated by low-sloping plains that stretched
from West to East and undulating to mountainous areas in land from the south. Tanah
Laut Regency is known
as a center for cattle because nearly 40% of meat in South Kalimantan is supplied
from this regency.
11 3.2. Data and Tools
Secondary data was collected from various sources including the Livestock
Office of Tanah Laut Regency and South Kalimantan Provincial Livestock Office.
Other data used are Indonesia Topographical Map (scale 1: 50.000) and Landsat TM
7 imagery of 2010.
The Landsat TM 7 imagery was processed by using ER Mapper 6.4, and
visualization of the availability of animal feed using ArcGIS 9.2 (ESRI Inc.). All
vector data were projected to the Universal Transverse Mercator (UTM) coordinate
system. The 50S zone with the World Geodetic System (WGS) 1984 datum was
selected and applied.
Tabel 1. Types and Sources of Secondary Data
No Data Types Scale Year Form Data Data source 1. 2. 3. Tanah Laut Regency (RBI Map)
Landsat TM 7
Livestock population data
1 : 50.000
30x 30 m
2007
April 16th 2010
2010 Digital Digital Tabular Bakosurtanal BTIC-landsat imagery provider Animal Husbandry Office of Tanah Laut Regency
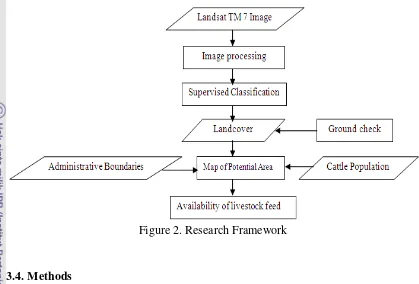
3.3. Research Framework
This study was commenced with the processing of Landsat TM7 using
supervised classification, and then was validated by using the ground check data. The
results were used as a reference for mapping potential areas and determine the level
12 Figure 2. Research Framework
3.4. Methods
3.4.1. Ground Check
Ground check was conducted to verify the classification results, and to
measure the errors related to digitally classification based on the radiometric
properties of object. Errors could be, caused by the presence of objects that have
similar radiometric characteristics but different physical objects on the earth. Infield
survey was conducted to capture GCP and information of objects using GPS.
3.4.2. Image Processing
Image processing is a way to manipulate image data or processing an image
into an output data in accordance with what we expect. The image-processing used
ER Mapper 6.4 Software. Landsat TM 7 imagery was used in this study consisted of
six bands of band 1, band 2, band 3, band 4, band 5, and band 7 which was obtained
from BTIC. The image processing was consisted of geometric correction, radiometric
13 3.4.2.1. Geometric Correction
Geometric correction on the image aims to reduce the geometric error, so that
the resulting geometric corrected image. In this study, geometric correction is done
by a method based on the Ground Control Point (GCP). Reference data used for the
selection was Indonesia Topographical Map Tanah Laut Regency, year 2007 of GCP
with the scale 1: 50.000. GCP sought is spread evenly and relatively permanent, such
as roads, rivers, bridges. Interpolation was performed using nearest neighborhood
interpolation method. This method is most efficient and does not change the digital
value of the original number. GCP elimination was performed to get Root Mean
Squared Error (RMSE) value <1.0 pixels.
RMSE is expressed by the formula:
RMSE = 2 with - (P1-P)2 + (L1-L)2
Where P 'and L' are the estimated coordinates, P and L are the original coordinates of
GCP (Jaya, 1997).
3.4.2.2. Radiometric Correction
The aim of radiometric correction to make correction of the bias in the
digital/pixel brightness values measured on the histogram data channels of spectral
imagery, which is caused by the atmospheric disturbances or due to an error detector
response. Radiometric correction to use the minimum histogram method. At a
minimum histogram method, the atmospheric disturbance allegedly some of the
smallest value measured on each channel plot histograms of multi channel digital
image. To eliminate the atmospheric interference from multi-channel data it is done
by subtracting the smallest digital value to each digital pixel value measured in each
14 3.4.2.3. Cropping
Study area should be cropped to avoid any disturbance influence of other
objects beyond the concern area and to reduce size data processing can be made
shorter. The administrative boundary of Tanah Laut Regency was used area of
interest (aoi).
3.4.2.3. SupervisedClassification
Image classification is useful to obtain landcover from remote sensing
imagery. Supervised classification with Maximum Likelihood method. This
classification is aimed to classify pixel values in the image into several classes based
on the training area. Classes were determined namely pastures, corn fields, forests,
settlements, water body, paddy field, palm plantations, and rubber plantations. This
process is resulted land cover Tanah Laut regency.
3.4.2.4. Validation Results of Classification
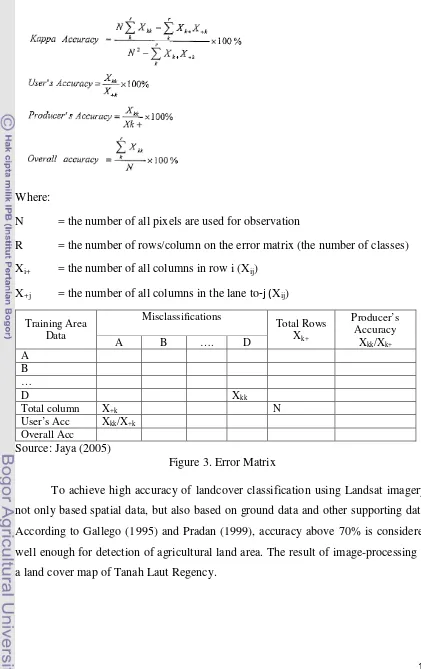
Accuracy evaluation was conducted to calculate the classification errors.
Accuracy assessment was performed by using a confusion matrix/contingency matrix.
Accuracy assessment includes the number of pixels that are classified into right or
wrong classes and misclassified, percentage in each class and the percentage of total
errors. The error matrix show in Figure 3. Accuracy is calculated using user's
accuracy, procedure's accuracy, overall accuracy, and kappa accuracy. The formula
15 Where:
N = the number of all pixels are used for observation
R = the number of rows/column on the error matrix (the number of classes)
Xi+ = the number of all columns in row i (Xij)
X+j = the number of all columns in the lane to-j (Xij)
Training Area Data
Misclassifications
Total Rows Xk+
Producer’s Accuracy
Xkk/Xk+
A B …. D
A B …
D Xkk
Total column X+k N
User’s Acc Xkk/X+k
Overall Acc
[image:33.612.98.519.69.738.2]Source: Jaya (2005)
Figure 3. Error Matrix
To achieve high accuracy of landcover classification using Landsat imagery,
not only based spatial data, but also based on ground data and other supporting data.
According to Gallego (1995) and Pradan (1999), accuracy above 70% is considered
well enough for detection of agricultural land area. The result of image-processing is
16 3.4.3. Potential forage
Based on the classification results from image processing, it obtained a land
cover that could potentially as a source of cattle feed such as pastures, rice, corn, and
rice fields then area of each was calculated.
Pasture availability is influenced by the season, while paddy straw and maize
straw are affected by the cropping pattern in each area/region. Cropping pattern of
rice and maize in Tanah Laut Regency is shown in Table 2.
Table 2. Paddy and Maize Planting Patterns in Tanah Laut Regency
Wet season Dry season
Nov Des Jan Feb Mart Apr May June July Agt Sept Oct
Paddy Paddy (terrestrial)
Maize 1 Maize 2 Maize 3
Availability of forage (dry matter) can be calculated based on the following
formula:
No. Land Type Formulas
1. Land Pastoral = (7.5 tons x land area x 0.23) tons/year DM
2. Paddy straw = (2.5 tons x land area x 0.70) tons/year DM
3. Maize straw = (6.0 tons x land area x 0.75) tons/year DM
(Source: Santoso, at al (1997) and Muller (1974))
Visualization of forage production used ArcGIS 9.2.
3.4.4. The Availability of Forage Level
Identification of the forage availability level was done by calculating the
Carrying Capacity (CC) and Carrying Capacity Index (CCI) of forage fodder. CC of
forage fodder is the ability of an area to produce the feed mainly forage that can
accommodate the needs a number of population of beef cattle in the form of fresh or
dry matter, without processing, and any treatment, and are assumed to be used for
17 Carrying capacity of feed potential is calculated based on the production of
dry material (DM) divided by the needs of one animal unit (1 AU) of beef cattle in
one year, where the requirement is 6.25 kg of dry material/day or 2.28 tons/year
(NRC, 1984). Livestock population is calculated based on the standard of animal unit
(AU). According to Ashari et al, (1999), the standard unit of ruminants are cattle (0.7
AU), buffalo 0.8 AU), sheep (0.07 AU) and goats (0.08 AU). Carrying capacity of
feed potential was calculated by using the following equation (Hariyanto et al, 2002):
Carrying capacity (AU) = Production of dry material (ton/year) the needs of dry material for livestock (ton/AU)
Carrying capacity index (CCI) forage was calculated from the total production
of available forage to the needs of forage for ruminant livestock population in some
areas. Index of the carrying capacity is calculated based on of the dry ingredients with
the following equation (Ashari et al, 1995):
Carrying Capacity Index
=
Carrying Capacity (AU)
Σ Population of cattle (AU)
Based on the average value of CCI and the standard deviation (SD) then the area can
be grouped according to three categories of indices, namely:
1. Category of low-CCI is less than the average value minus standard deviation
CCI (<mean-SD).
2. Category of average-CCI is where the CCI value in the range between the CCI
average value minus of standard deviation to the average value plus of
standard deviation (mean - SD to mean + SD).
3. Category of high CCI is more high than the CCI average value plus of
standard deviation (> mean + SD).
18
IV.
RESULT AND DISCUSSION
4.1. Ground Check
Fifty seven ground check point coordinates were taken on various object in11
sub districts. Those objects were consisted of mining, rubber, palm oil, pasture,
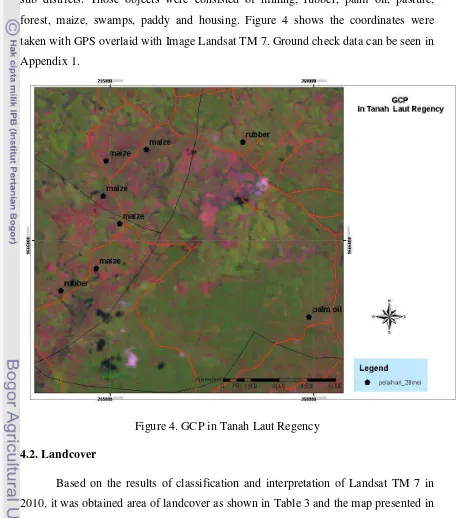
forest, maize, swamps, paddy and housing. Figure 4 shows the coordinates were
taken with GPS overlaid with Image Landsat TM 7. Ground check data can be seen in
[image:36.612.93.549.164.682.2]Appendix 1.
Figure 4. GCP in Tanah Laut Regency
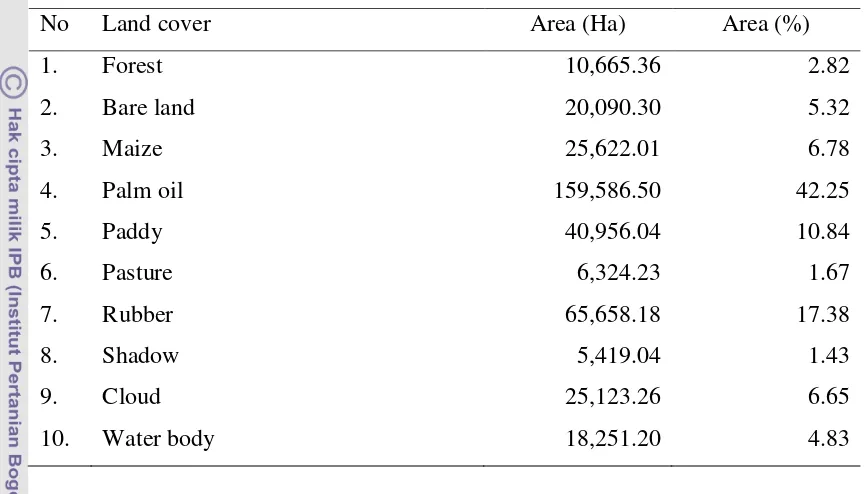
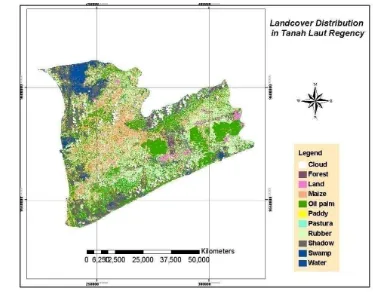
4.2. Landcover
Based on the results of classification and interpretation of Landsat TM 7 in
2010, it was obtained area of landcover as shown in Table 3 and the map presented in
19 of the total landcover, while the smallest area is shadow with total of 5,419.04 ha
[image:37.612.99.531.150.397.2](1.43%).
Table 3. The Landcover type in Tanah Laut Regency
No Land cover Area (Ha) Area (%)
1. Forest 10,665.36 2.82
2. Bare land 20,090.30 5.32
3. Maize 25,622.01 6.78
4. Palm oil 159,586.50 42.25
5. Paddy 40,956.04 10.84
6. Pasture 6,324.23 1.67
7. Rubber 65,658.18 17.38
8. Shadow 5,419.04 1.43
9. Cloud 25,123.26 6.65
10. Water body 18,251.20 4.83
Based on the classification result, the most potential area and become a
priority for the feed sources are paddy field lands with an area of 40,956.04 hectares
(10.84 %), maize with an area 25,622.01 ha (6.78 %), and pastures with an area of
6,324.23 hectares (1.67 %). In accordance with the statement of Nitis (1995), land the
potential area as feed classification as sources are: 1) cropland, 2) plantations, 3)
forest, 4) grassland, 5) fallow land, and 6) the critical oil. Data on feed production
capability for each of the land is still difficult to obtain, using remote sensing
methods we can identify, measure and analyze every object of interest, and classify
20 Figure 5. Landcover Distribution in Tanah Laut Regency
4.3. Validation of the Landcover Classification Results
Base on confusion matrix in Table 4, at all classes can be mapped very well,
unless the source of feed pasture (40%) of the procedure’s accuracy. There are three
classes sample are removed from pasture (omission) and inserted into another class
(commission that is entered into the Land and rubber class. Errors in identifying this
possibility because there is some pasture land as open land is barren, while the rubber
was due to because rubber plantation is still a young state so it has a pixel color that is
almost equal to pasture.
The calculation result shows that the overall accuracy of 84.3% and kappa accuracy
80.0%. According to Gallego (1995) and Pradan (1999), the accuracy of satellite
imagery analysis for the detection of the agricultural land area above 70% is
21 using Landsat imagery, it is not only based spatial data, but also on field data (ground
data) and other supporting data.
Table 4. Confusion Matrix of Landcover Classification Result in Tanah Laut Regency
Pasture Paddy Land Palm oil Forest Swamp Rubber Maize Total PA (%)
Pasture 2 0 2 0 0 0 1 0 5 40
Paddy 0 8 0 1 0 0 1 0 10 80
Land 0 0 4 0 0 0 1 0 5 80
Palm oil 0 0 0 6 0 0 0 0 6 100
Forest 0 0 0 0 2 0 2 1 5 40
Swamp 0 0 0 0 0 2 0 0 2 100
Rubber 0 0 0 0 1 0 12 3 16 75
Maize 0 0 0 0 0 0 1 7 8 87.5
Total 2 8 6 7 3 2 18 11 51
UA (%) 100 100 66.67 85.71 66.67 100 66.67 63.64
OA 84.3
Note: UA (use’s accuracy), OA (Overall accuracy) and PA (producer’s accuracy)
The calculation result shows that the overall accuracy of 84.3% and kappa
accuracy 80.0%. According to Gallego (1995) and Pradan (1999), the accuracy of
satellite imagery analysis for the detection of the agricultural land area above 70% is
considered good enough. To achieve good results in the classification of landcover
using Landsat imagery, it is not only based spatial data, but also on field data (ground
data) and other supporting data.
4.4. Potential Feed
4.4.1. ForageProductioninTanah Laut Regency
The total area and production of each feed source in Tanah Laut Regency can
be seen in Table 5 and Table 6. The area that has potential as a feed source of the
mostly located feeds in Penyipatan sub-district (16.28 %), Jorong sub-district (15.13
%), and Pelaihari district (12,60 %). The smallest area is Bumi Makmur
sub-district (3.85 %).
The most extensive area of maize land is Batu Ampar sub-district with an area
22 11.58 ha. The most extensive area of pastures land is Jorong sub-district with an area
of 2,577.85 ha, and the smallest is Bumi Makmur sub-district with an area of 0.05
Ha. The most extensive paddy field is Penyipatan sub-district with an area of
8,632.29 ha, and the smallest is Bajuin with an area of 558.01 ha.
Table 5. Forage Area in Tanah Laut Regency
Sub-district Area (Ha)
Maize Paddy Pasture Number (%)
Bati-bati 1,347.66 2.778.88 178.69 4,305.23 5.91
Bajuin 3,077.52 558.01 360.75 3,996.28 5.48
Bumi Makmur 11.58 2.795.08 0.05 2.806.71 3.85
Batu Ampar 4,554.12 669.24 928.97 6,152.33 8.44
Jorong 3,130.84 5,320.25 2,577.85 11,029.12 15.13
Kintap 3,785.84 954.45 1,553.59 6,293.88 8.63
Kurau 94.06 5101.58 4.06 5,199.70 7.13
Pelaihari 4,325.33 4,666.45 194.01 9,185.79 12.60
Takisung 924.50 6,645.75 63.85 7,634.10 10.47
Tab. Ulang 1,529.31 2,833.88 69.49 4,432.68 6.68
Penyipatan 2,841.25 8,632.29 392.93 11,866.46 16.28
[image:40.612.98.497.447.691.2]Number 25,622.01 40,956.04 6,324.24 72,902.29 100.00
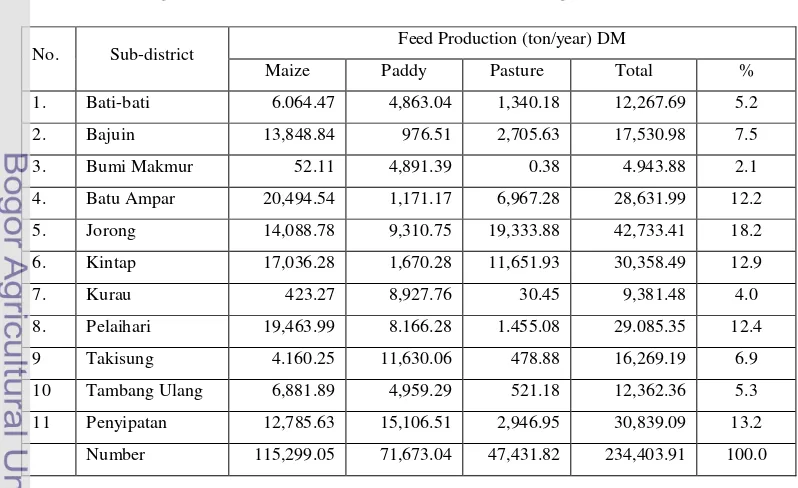
Table 6. Forage Production Potential in Tanah Laut Regency
No. Sub-district Feed Production (ton/year) DM
Maize Paddy Pasture Total %
1. Bati-bati 6.064.47 4,863.04 1,340.18 12,267.69 5.2
2. Bajuin 13,848.84 976.51 2,705.63 17,530.98 7.5
3. Bumi Makmur 52.11 4,891.39 0.38 4.943.88 2.1
4. Batu Ampar 20,494.54 1,171.17 6,967.28 28,631.99 12.2
5. Jorong 14,088.78 9,310.75 19,333.88 42,733.41 18.2
6. Kintap 17,036.28 1,670.28 11,651.93 30,358.49 12.9
7. Kurau 423.27 8,927.76 30.45 9,381.48 4.0
8. Pelaihari 19,463.99 8.166.28 1.455.08 29.085.35 12.4
9 Takisung 4.160.25 11,630.06 478.88 16,269.19 6.9
10 Tambang Ulang 6,881.89 4,959.29 521.18 12,362.36 5.3
11 Penyipatan 12,785.63 15,106.51 2,946.95 30,839.09 13.2
23 The total production of dry matter of feed in Tanah Laut Regency was
234,403.91 tons. Overall, the highest feed production is in sub-districts of Jorong that
has 42,733.41 tons of dry matter production or (18.2 %) of the total production of dry
feed material in Tanah Laut Regency. This is consist of maize straw as much as
14,088.78 tons (12.22 %), pasture as much as 19,333.88 tons/year (24.57%), and
9,310.75 tons/year of paddy straw (12.99 %) while the rest scattered is in other
places. This is because the vast land area of maize, rice, and pasture is much higher
compared with other places, while the lowest production of feed resources is in the
sub-district of Bumi Makmur with total production reach 4,943.88 tons (2.1 %). This
is caused by most area in the sub-district of Bumi Makmur is marshes. There fare the
source of feed maize straw (52.11ton/year DM) and pasture (0.38 ton/year DM) is
lower than the paddy straw (4,891.39 11ton/year DM).
The distribution of potential feed production in Tanah Laut shows that sub
district Jorong, Penyipatan and Kintap have the highest production potential
compared with other places. Those area have highest area of feed, especially maize
field. The vast area of maize crop in some sub district is because of the availability of
facilities and infrastructure such as banking partners to support farmers through the
Credit of Food Security and Energy/Kredit Ketahanan Pangan dan Energi,
cooperation with the feed mill, and the availability of maize drying machines as well.
The potency of pasture production is smaller because the pasture land turned into
palm oil plantation and rubber plantation.
Syamsul et al, (2007) the feed source of residual feed of the crop obtained
from commodity crops, and the availability influenced by cropping patterns and crop
land. Generally, maize farming in Tanah Laut Regency planted three times a year i.e.
November to March, April to July, and August to November. However, to avoid the
crop failure mean farmers grow maize twice a year and rice is planted once a year.
Meanwhile, pasture production is influenced by the seasons. The availability of
pasture is not continuous throughout the year because of the lack of drought and an
24 By the area of feed land associated with the livestock population it will be
known the livestock density in a region. According to Dirjennak and Balitnak (1995),
the criteria used for the category are very dense >2, the densely >1-2, moderate 0.25 -
1, and low <0.25. Based on land area associated with livestock feed, Tanah Laut
Regency is medium density (0.7 AU/ha) area. There are two sub district with very
dense category, i.e. Takisung and Bumi Makmur. Seven sub district with moderate
category that consist of Pelaihari, Kintap, Tambang Ulang, Penyipatan, Bajuin,
Jorong and Bati-bati. There are two sub district with low category, i.e. Bumi Makmur
and Kurau sub district. Region with category moderate and low category shows that
farm land managed by farmer’s still support livestock development. Agriculture land
has potential as feed source from pastures and agriculture by product.
4.4.2. Availability of Feed
The carrying capacity of feed availability is the ability of a region to produce
or to provide feed in the form of pasture forage, paddy straw, and maize straw that
can accommodate the needs of a population of beef cattle without any treatment.
Analysis of the availability of forage based on the status of forage carrying capacity
and Carrying Capacity Index (CCI).
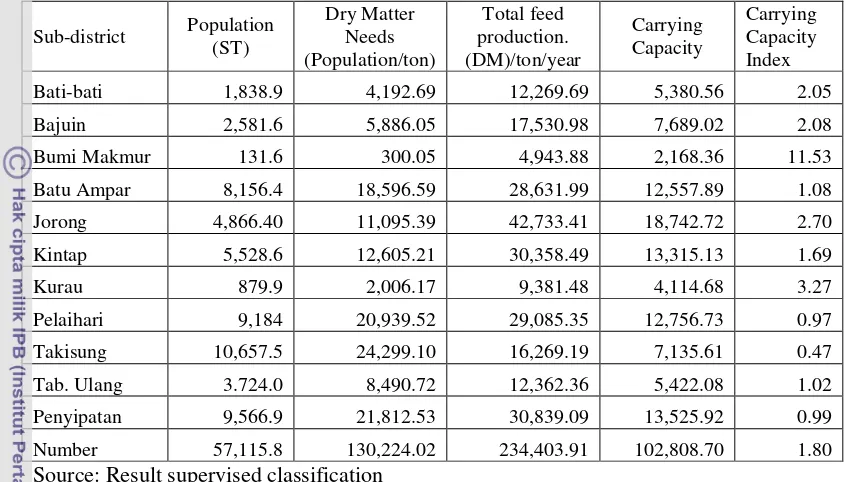
Table 7 shows that the total carrying capacity of feed availability in Tanah
Laut Regency was 102,808.70 AU, the population is 57.115.8 AU, stock while the
feed requirements were 130.224.02 AU. Overall Tanah Laut Regency was able to
meet the needs of livestock feed.
The sub-districts that have the highest carrying capacity were sub-district of
Jorong (18,742.72 AU), Penyipatan (13,525.92 AU), Kintap (13,315.13 AU), and the
sub-district of Pelaihari (12,756.73 AU) and the areas with the low carrying capacity
was sub-district of Bumi Makmur (2,168.36 AU). The sub-districts with the highest
level of carrying capacity of feed availability have an opportunity as a center for
livestock development. While the feed requirements in Bumi Makmur sub-district
that has the lowest carrying capacity of (2,168.36 AU), with a population of livestock
25 Table 7. Carrying Capacity Index of Forage Availability Level in Tanah Laut Regency
Sub-district Population (ST) Dry Matter Needs (Population/ton) Total feed production. (DM)/ton/year Carrying Capacity Carrying Capacity Index
Bati-bati 1,838.9 4,192.69 12,269.69 5,380.56 2.05
Bajuin 2,581.6 5,886.05 17,530.98 7,689.02 2.08
Bumi Makmur 131.6 300.05 4,943.88 2,168.36 11.53
Batu Ampar 8,156.4 18,596.59 28,631.99 12,557.89 1.08
Jorong 4,866.40 11,095.39 42,733.41 18,742.72 2.70
Kintap 5,528.6 12,605.21 30,358.49 13,315.13 1.69
Kurau 879.9 2,006.17 9,381.48 4,114.68 3.27
Pelaihari 9,184 20,939.52 29,085.35 12,756.73 0.97
Takisung 10,657.5 24,299.10 16,269.19 7,135.61 0.47
Tab. Ulang 3.724.0 8,490.72 12,362.36 5,422.08 1.02
Penyipatan 9,566.9 21,812.53 30,839.09 13,525.92 0.99
Number 57,115.8 130,224.02 234,403.91 102,808.70 1.80
Source: Result supervised classification
To determine the ratio between the feed carrying capacity and cattle
population, it is done by the calculation of the index of feed carrying capacity. Index
Carrying Capacity Index (CCI) of feed is the ratio between the amounts of feed
available (AU) by the number of beef cattle population (AU) in certain area. This
value shows the ability of area to increase the number of livestock. Feed CCI is
categorized into three criteria: low criteria, which means the area has a relatively low
carrying capacity of the feed and the region can no longer increase the number of
livestock, moderate criteria means that the region can still increase the number of
livestock in the region, and high criteria means the region has a high carrying
capacity of the feed and the region is highly recommended to increase the number of
26
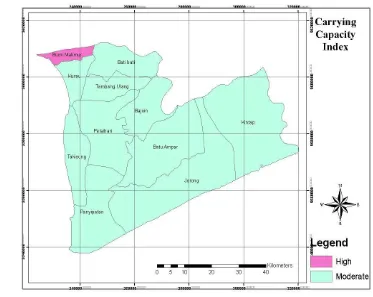
Figure 6. Carrying Capacity Index in Tanah Laut Regency
Based on Figure 6, it is known that the feed CCI with high criteria was Bumi
Makmur sub district (11.53). The moderate CCI were located in sub district of Kurau
(3.27), Jorong (2.70), Bajuin (2.08), Bati-bati (2.05), Kintap (1.69), Batu Ampar
(1.08), Tambang Ulang (1.02), Penyipatan (0.99), Pelaihari (0.97) and Takisung
(0.47).
The CCI of Bumi Makmur sub district illustrates that the region has a high
feed CC and it can be recommended to increase the number of livestock or as a center
for the development of beef cattle in Tanah Laut. Table 8 shows the Bumi Makmur
sub district has 131.6 AU, while the CC 2,168.36 AU. Sub district that have high CCI
can supply feed to the sub district with medium or low CCI. From the total of the 11
sub district in Tanah Laut Regency, 10 sub district showed the moderate CCI, i.e.
27 Pelaihari and Takisung. They are able to increase the number of livestock. In table 7,
the sub district Bajuin with feed CC (19,820.71 AU) associated with the livestock
population (1,312.00 AU) still allows an increase of population (18,508.71 AU).
Generally this explains that the potential feed source in Tanah Laut Regency is
sufficient.
Based on the analysis of the CC with cattle population, it is known area that
has ability to increase the number of beef cattle population. Tanah Laut Regency with
the feed CC of 102,808.70 AU and cattle population of 57,115.8 AU is able to
28
V.
CONCLUSIONS AND RECOMMENDATIONS
5.1. Conclusions
The conclusions of this study can be drawn as follow:
a. The potential land and which become a priority for the source of animal feed in
Tanah Laut Regency consists of 72,902.29 ha of pasture (6,324.24 ha), maize field
(25,622.01 ha), and paddy field (40,956.04 ha). The highest areas for feed source
are Penyipatan (16.28%), Jorong (15.13%), and Pelaihari (16.28%). The smallest
area Bumi Makmur (3.85%).
b. The highest carrying capacity (CC) was Jorong sub district (18,742.72 AU),
Penyipatan (13,525.92 AU) and Kintap (13,315.13 AU). While the lowest CC was
Bumi Makmur (2,168.36 AU).
c. Based on the carrying capacity index (CCI) Bumi Makmur was classified as high
CCI (11.53), ten sub-districts with moderate criteria (Kurau sub-district (3.27),
Jorong sub-district (2.70), Bajuin sub-district (2.08), Bati-bati sub-district (2.05),
Kintap district (1.69), Batu Ampar district (1.08), Tambang Ulang
sub-district (1.02), Penyipatan sub-sub-district (0.99), Pelaihari sub-sub-district (0.97), and
Takisung sub-district (0.47).
d. Tanah Laut Regency with a CC of 102,808.70 AU and cattle population of
57,115.80 AU, it still allows for the addition of beef livestock populations of
45,692.90 animal unit in Tanah Laut Regency.
5.2. Recommendations
The advice can be given in this study are:
a. To achieve the vision of Tanah Laut Regency as a center of local
resource-based livestock production and agribusiness-oriented, a number of beef cattle
population in some sub district is possible to improve.
b. Availability of crop by products, palm oil by-product during one year period
is needed to be evaluated to guarantee the development of beef cattle
29
REFFERENCE
Aronoff, S. 1991. Geographic Information Systems: A Management Perspective
WDL Publications, Ottawa. Canada.
Ashari, F. et al. 1995. Pedoman Analisis Potensi Wilayah Penyebaran dan
Pengembangan Peternakan. Balai Penelitian Ternak dan Direktorat Bina
Penyebaran dan Pengembangan Peternakan. Jakarta
[BPS] Badan Pusat Statistik Kabupaten Tanah Laut. 2007. Tanah Laut dalam Angka. Badan Pusat Statistik Kabupaten Tanah Laut.
______. 2008. Tanah Laut dalam Angka. Badan Pusat Statistik Kabupaten Tanah Laut.
[Disnak Tala] Dinas Peternakan Kabupaten Tanah Laut. 2009. Laporan Tahunan 2009. Dinas Peternakan Kabupaten Tanah Laut.
[Disnak KalSel] Dinas Peternakan Provinsi Kalimantan Selatan. 2009. Laporan Tahunan 2009. Dinas Peternakan Provinsi Kalimantan Selatan.
[Dirjennak] Direktorat Jenderal Peternakan. 2008. Pedoman Analisis Potensi Wilayah
Penyebaran dan Pengembangan Peternakan. Direktorat Jenderal
Peternakan. Jakarta.
[Dirjennak and Balitnak] Direktorat Jenderal Peternakan dan Balai Penelitian Ternak. 1995. Pedoman Analisis Potensi Wilayah Penyebaran dan Pengembangan
Peternakan. Direktorat Jenderal Peternakan dan Balai Penelitian Ternak.
Jakarta
Direktorat Pangan dan Pertanian. 2010. Strategi dan Kebijakan dalam Percepatan
Pencapaian Swasembada Daging Sapi 2014 (Suatu Penelaahan Konkrit).
Direktorat Pangan dan Pertanian. Bappenas. Jakarta.
Gallego, J. 1995. Sampling Frames of Square Segment. Institute for Remote Sensing Application, MARS. Joint Research Centre. Italy.
Gunadi, E. 1998. Livestock development in Indonesia. Makalah Seminar Nasional Pengembangan Peternakan di Indonesia, Jakarta
30 Hariyanto, B., Ismeth , I., Budi, A., Kusumo, D. 2002. Panduan Teknis Sistem
Intergrasi Padi-Ternak. . Balai Penelitian dan Pengembangan Pertanian.
Departemen Pertanian. Jakarta.
Jaya. I. N. S. 1996. Monitoring Forest Cover Change Using Multitemporal Landsat
TM Data. Thesis. Graduate School of Science and Technology. Japan
University. Niigata.
Lillesand and Kiefer. 1994. Remote Sensing and Image Interpretation, third edition. John Wiley and Sons, Inc. United States of America.
Lo, C. P. 1994. Pengindraan Jauh Terapan. Penerbit Universitas Indonesia. Jakarta
Lubis, D. A. 1963. Ilmu Makanan Ternak. PT. Pembangunan. Jakarta.
Muller, Z. O. 1974. Livestock Nutrition in Indonesia. Rome: UNDP FAO.
Natasasmita, A., Murdikdjo, K. 1980. Beternak Sapi Pedaging, dalam Rangka
Penataran Rural Credit Project_BRI Angkatan II. Unit Penataran Credit
Project-BRI. Jakarta.
Nitis, I. M. 1995. Sistem Penyediaan Pakan Hiajuan Menunjang Industri Peternakan
yang Berkesinambungan. Prosiding Seminar Nasional Peternakan dan
Veterinary, Cisarua Bogor 7 – 8 Nopember 1995. Puslitbangnak. Badan Penelitian dan Pengembangan Pertanian. Departemen Pertanian. Bogor.
[NRC] National Research Council K. 1984. Nutrient Requirement of Beef Cattle 6th rev. ed. National Academy Press. Washington DC.
Prawiradiputra, Bambang, R. 2000. Pasang Surut Penelitian dan Pengembangan
Hijauan Pakan Ternak di Indonesia. Lokakarya Nasional Tanaman Pakan
Ternak. Balitnak. Bogor.
Riady M. 2004. Tantangan dan Peluang Peningkatan Produksi Sapi Potong Menuju 2020. Prosiding Lokakarya Nasional Sapi Potong. Strategi Pengembangan Sapi Potong dengan Pendekatan Agribisnis dan Bekelanjutan. Yogyakarta 8 – 9 Oktober 2004. Puslitnak, Balitbang, halaman 3 – 6. Bogor.
31 di Dua Kabupaten Tingkat II Purwakarta dan Indramayu. LPM UNPAD. Bandung.
Suharyanto. 2006. Strategi Pengembangan Kerbau Berbasis Perkebunan Kelapa Sawit Rakyat di Provinsi Bengkulu. Jurusan Peternakan Fakultas Pertanian. Universitas Bengkulu. Bengkulu.
Sulistyo, B. 2004. Pengaruh Pemilihan Ukuran Pixel pada Saat Koreksi Geometris pada Citra Satelit Landsat Thematic Mapper terhadap Hasil Klasifikasi. Fakultas Pertanian . Universitas Bengkulu. Bengkulu.
Soemarwoto I. 1983. Pengelolaan Sumberdaya Alam, Bagian II. Sekolah Pasca Sarjana, Jurusan Pengelolaan Sumberdaya Alam dan Lingkungan. Institut Pertanian Bogor. Bogor.
Star, Jeffrey and Estes John. 1990. Geographic Information Systems: An Introduction. NJ. Prentice-Hall. Englewood Cliffs.
Sugeng, Y. Bambang. 1998. Sapi Potong. Cetakan VI. Penebar Swadaya. Jakarta.
Suratman, Ritung, S. Djaenudin. 1998. Potensi Lahan untuk Pengembangan Ternak Ruminansia Besar di beberapa Propinsi di Indonesia. Dalam Karama AS (Editor). Prosiding Pertemuan Pembahasan dan Komunikasi Hasil
Penelitian Tanah dan Agroklimat. Bidang Pedologi Cisarua 4 – 6 Maret
1997. Pusat Penelitian Tanah dan Agroklimat, halaman 169 – 182. Bogor.
Susetyo, S. 1980. Padang Penggembalaan. Departemen Ilmu Makanan Ternak Fakultas Peternakan. Institut Pertanian Bogor. Bogor.
Sushill, Pradan. 1999. Integration of Remote Sensing and GIS for Crop Acreage Estimation: An Information System Development Approach. International Centre for Integrated Mountain Development. Isses in Mountain Depelopment. ICOMOD. Nepal. Katmender.
32 Syamsu, Jasmal, Ahmari. 2006. Analisis Potensi Limbah Tanaman Pangan sebagai
Sumber Pakan Ternak Ruminasia di Sulawesi Selatan. Thesis. Institut
Pertanian Bogor. Bogor
Tilman AD, Hartadi H, Reksohadiprojo S, Prawirokusumo S, Lebdosoekojo S. 1989.
Ilmu Makanan Ternak. Yogyakarta : Gajah Mada University Press.
Wahyunto. 2007. Peranan Citra Satelit dalam Penentuan Potensi Lahan. Penelitian dan Pengembangan Departemen Pertanian. Departemen Pertanian .
Wijaya, C. I. 2005. Analisis Perubahan Penutupan Lahan Kabupaten Cianjur
JawaBarat Menggunakan Sistem Informasi Geografis. Skripsi. Departemen
33 Appendix 1. Coordinate Points of Landcover
Page 1 of 2
Coordinate Points of Landcover, Tanah Laut regency May 28, 2011
Class Ident Latitude Longitude Altitude
Mining 169 -3.83489261 114.75330477 55
Mining 170 -3.8348953 114.75330502 55
Rubber 171 -3.84503279 114.75057654 54
Oil Palm 172 -3.85999382 114.75140266 47
Oil Palm 173 -3.86126493 114.75025501 45
Pasture 174 -3.88058505 114.72887118 29
Paddy 175 -3.90359899 114.72909389 28
Paddy 176 -3.9178359 114.71273920 22
Pasture 177 -3.9189134 114.71319661 21
Forest 178 -4.02881901 114.69688743 33
Rubber 179 -3.96377645 114.74129777 38
Rubber 180 -3.94369592 114.78281585 44
Maize 181 -3.93877004 114.79061195 51
Maize 182 -3.92888342 114.79577210 49
Maize 183 -3.92271459 114.79217098 60
Maize 184 -3.91486226 114.79285402 60
Maize 185 -3.91243938 114.80168218 51
Rubber 186 -3.91083098 114.82296458 57
Rubber 187 -3.93897515 114.84757352 33
Rubber 188 -3.93897506 114.84757335 33
Oil Palm 189 -3.9496542 114.83755882 44
Rubber 190 -3.9634415 114.89204840 47
Oil Palm 191 -3.96143127 114.92360576 39
Rubber 192 -3.98104065 114.96518629 31
Forest 193 -3.97119267 114.97682079 28
Forest 194 -3.97250393 114.98816058 9
34 Page 2 of 2
Class Ident Latitude Longitude Altitude
Rubber 197 -3.8596209 115.24912938 23
Forest 198 -3.85325384 115.25387932 27
Rubber 199 -3.85318302 115.27765702 25
Forest 200 -3.85538419 115.26380961 26
Oil Palm 201 -3.73248068 114.75212250 1
Rubber 202 -3.65638498 114.76524219 41
Rubber 203 -3.64388748 114.77357556 30
Rubber 204 -3.66960324 114.74381050 24
Oil Palm 205 -3.67262291 114.67048637 49
Paddy 206 -3.68018808 114.64408119 18
Paddy 207 -3.68046996 114.63816633 21
Paddy 208 -3.65339139 114.62928001 11
Paddy 209 -3.63443672 114.65282301 16
Pasture 210 -3.64792488 114.66180925 22