(Batanghari, Sarolangun and Tebo Regency)
RAKHMA MELATI SUJARWO
GRADUATE SCHOOL
BOGOR AGRICULTURAL UNIVERSITY
BOGOR
STATEMENT OF THESIS, SOURCE OF INFORMATION
AND COPYRIGHT*
I hereby declare that master thesis entitled “Marketing System of Smallholder Rubber in the Jambi Province, Indonesia (Batanghari, Sarolangun and Tebo Regency)” is my work under the direction of the advisory committee and has not been submitted in any form to any other universities. Sources of information derived or quoted from works published and unpublished by other authors have been mentioned in the text and listed in the References at the end of this master thesis.
I hereby assign the copyright of my master thesis to the Bogor Agricultural University.
Bogor, August 2015
Rakhma Melati Sujarwo
H451110581
SUMMARY
RAKHMA MELATI SUJARWO. Marketing System of Smallholder Rubber in the Jambi Province, Indonesia (Batanghari, Sarolangun and Tebo Regency). Supervised by RITA NURMALINA and RATNA WINANDI.
Rubber remains an important commodity in international trade, and is the main raw material for many industries. World rubber production is dominated by Asian countries, with Indonesia being the second largest producer after Thailand. With the third largest plantation area, the Jambi province is one of the largest
contributors to Indonesia’s rubber production (10.66 %). In order to develop the Indonesian rubber industry further, the rubber marketing system needs to be taken into account which is strongly impacted by the rubber marketing efficiency, the performance of marketing functions and the choice of the marketing channel.
The aims of this research are: 1) to analyse the role and function of marketing institutions in rubber market in the Jambi province, 2) to evaluate the rubber marketing efficiency by observing the marketing margin, farmer share and Li/Ci ratio in the Jambi province, and 3) to characterize and to analyse factors affecting the marketing channel choice by rubber farmers in the Jambi province.
In order to analyse those objectives, descriptive and quantitative analysis were conducted. Marketing efficiency analyses through marketing margin,
farmer’s share and ratio of profit to cost is required. Also, a Multinomial Logistic Regression Model is employed to determine the factors affecting the channel choice.
Results show that each marketing institution performs marketing functions which are necessary affect the marketing performance. Those three functions are Exchange Function (buying, and selling), Physical Function (storage, processing, and transportation), and Facilitating Function (sortation, grading, risk, finance, and information). Auction markets become the most influential institution along the channel, where they provide support to farmers and buyers in order to find the most beneficial bidding price. Auction markets reduce constraints faced by farmers and facilitate a place for buyers and seller to meet where it is hard to be conducted normally.
There are 6 marketing channels found in the Jambi province. Those channels consists of marketing institutions including farmers. Later are the existing channels along with all marketing actors which are mentioned in accordance with the order from farmers to the intermediate consumers: Channel 1: Rubber Farmers, Collectors / Small Traders, Big Traders / Warehouse, Factories (intermediate consumers); Channel 2: Rubber Farmers, Collectors / Small Traders, Factories (intermediate consumers); Channel 3: Rubber Farmers, Collectors / Small Traders, Auction Market, Factories (intermediate consumers); Channel 4: Rubber Farmers, Big Traders / Warehouse, Factories (intermediate consumers); Channel 5: Rubber Farmers, Auction Market, Factories (intermediate consumers); and Channel 6: Rubber Farmers, Factories (intermediate consumers).
Considering the analysis of marketing margin, farmer’s share and Li/Ci ratio, channel 6 is revealed as the most efficient channel in comparison with other existing rubber marketing channels in the Jambi Province. The result delineates
high Li/Ci ratio (6.54). Another essential point is that the channel requires the lowest amount of marketing cost, which is 131.08 IDR/kg. However, even though based on the quantitative data of marketing efficiency analysis, channel 6 becomes the most efficient, the channel could not be mentioned as the most efficient in on the field. Yet, channel 5, where auction market taken part, becomes the more realistic channel to be mentioned as the most efficient one, by considering marketing functions which are performed by auction market. Thus, by analyzing the marketing functions and efficiency, channel 5 is the most efficient channel which is the most possible to be implemented in the field by rubber farmers
Factors significantly affecting decision of channel choice by farmers are (1) Location, represented by distance, (2) Information Access, represented by participation in any related village organization, (3) Profitability Aspect, represented by quantity total in the log-form and average price, and (4) Traders Characteristics, represented education. Farmers tend to choose the more beneficial channel when the distance is farther, the buying price is higher, the quantity of rubber is higher, and the education is higher, where the comparison channel needs to be considered by looking to the analysis result.
RINGKASAN
RAKHMA MELATI SUJARWO. Sistem Pemasaran Karet Rakyat di Provinsi Jambi, Indonesia (Kabupaten Batanghari, Sarolangun and Tebo). Dibimbing oleh RITA NURMALINA dan RATNA WINANDI.
Karet rakyat merupakan komoditas penting dalam perdagangan internasional, dan merupakan bahan baku utama bagi banyak industri. Dunia produksi karet didominasi oleh negara-negara Asia, dengan Indonesia menjadi produsen terbesar kedua setelah Thailand. Dengan areal perkebunan terbesar ketiga, provinsi Jambi adalah salah satu kontributor terbesar untuk produksi karet di Indonesia (10,66%). Dalam rangka mengembangkan industri karet Indonesia efisiensi sistem pemasaran karet perlu diperhitungkan yang selannjutnya sangat dipengaruhi oleh pilihan saluran pemasaran.
Tujuan dari penelitian ini adalah: 1) untuk menganalisis peran dan fungsi lembaga-lembaga pemasaran di pasar karet di Provinsi Jambi, 2) untuk mengevaluasi efisiensi pemasaran karet dengan mengamati margin pemasaran, farmer share dan rasio Li / Ci di provinsi Jambi, dan 3) untuk mengkarakterisasi faktor-faktor yang mempengaruhi pilihan saluran pemasaran oleh petani karet di provinsi Jambi.
Untuk menganalisis tujuan tersebut, analisis deskriptif dan kuantitatif dilakukan. Analisis efisiensi pemasaran melalui marjin pemasaran, farmer share dan rasio keunntungan terhadap biaya (Li/Ci) diperlukan. Selanjutnnya Multinomial Logistic Regression Model digunakan untuk menentukan faktor yang mempengaruhi pilihan saluran.
Hasil penelitian menunjukkan bahwa setiap masing-masing lembaga pemasaran melakukan fungsi pemasaran yang mempengaruhi kinerja pemasaran, yaitu ketiga fungsi pertukaran (pembelian, dan penjualan), fisik (penyimpanan, pengolahan, dan transportasi), dan fasilitas (sortasi, grading, risiko, keuangan, dan informasi). Pasar lelang menjadi lembaga paling berpengaruh sepanjang saluran, di mana mereka memberikan dukungan kepada petani dan pembeli untuk menemukan harga penawaran yang paling menguntungkan. Pasar lelang mengurangi kendala yang dihadapi petani dan memfasilitasi pembeli dan penjual untuk bertemu di mana sulit untuk dilakukan secara nyata.
Terdapat 6 saluran pemasaran yang ditemukan di provinsi Jambi. Saluran-saluran terdiri dari lembaga-lembaga pemasaran dan termasuk petani. Berikut ini adalah saluran-saluran yang ada bersama dengan semua aktor-aktor pemasaran yang disebutkan sesuai dengan alur dari petani ke konsumen menengah: Saluran 1: Petani karet, Kolektor / Pedagang kecil, Pedagang besar / Gudang, Pabrik (konsumen antara); Saluran 2: Petani karet, Kolektor / Pedagang Kecil, Pabrik (konsumen antara); Saluran 3: Petani karet, Kolektor / Pedagang kecil, Pasar Lelang, Pabrik (konsumen antara); Saluran 4: Petani Karet, Pedagang Besar / Gudang, Pabrik (konsumen antara); Saluran 5: Karet Petani, Pasar Lelang, Pabrik (konsumen antara); dan Saluran 6: Karet Petani, Pabrik (konsumen antara).
yang rendah sejumlah 131,08 Rp / kg. Namun, saluran 5, dimana terdapat pasar lelang, menjadi saluran yang lebih realistis untuk disebutkan sebagai yang paling efisien, dengan mempertimbangkan fungsi-fungsi pemasaran yang dilakukan oleh pasar lelang. Dengan demikian, dengan menganalisis fungsi pemasaran dan efisiensi, saluran 5 menjadi saluran yang paling efisien yang paling mungkin untuk dilaksanakan di lapangan oleh petani karet
Faktor-faktor yang mempengaruhi secara signifikan keputusan pilihan saluran pemasaran oleh petani karet adalah (1) Lokasi, diwakili oleh jarak, (2) Akses Informasi, diwakili oleh partisipasi dalam organisasi desa terkait, (3) Aspek keuntungan, diwakili oleh kuantitas total dan harga, dan (4) Karakteristik Pedagang, diwakili pendidikan. Petani cenderung memilih saluran yang lebih memberikan keuntungan bila jaraknya lebih jauh, harga beli lebih tinggi, kuantitas karet lebih besar, dan pendidikan yang lebih tinggi, dimana hasil analisis saluran pemasaran yang satu dengan acuan perlu diperhatikan.
© All Rights Reserved by Bogor Agricultural University, 2015
Copyright Reserved by Law
It is prohibited to quote part or all of this paper without including or citing the source. Quotations are only for purposes of education, research, scientific writing, preparation of reports, critics, or review an issue; and those are not detrimental to the interests of the Bogor Agricultural University.
MARKETING CHANNEL ANALYSIS
OF SMALLHOLDER RUBBER IN THE JAMBI PROVINCE,
INDONESIA
(Batang Hari, Sarolangun and Tebo Regency)
RAKHMA MELATI SUJARWO
Master thesis
as one of the requirements to obtain a degree of
Magister Sains
in an Agribusiness Study Program
GRADUATE SCHOOL
BOGOR AGRICULTURAL UNIVERSITY
BOGOR
External Examiner: Dr Ir Suharno, MADev
Thesis Title : Marketing System of Smallholder Rubber in the Jambi Province, Indonesia (Batanghari, Sarolangun and Tebo Regency)
Name : Rakhma Melati Sujarwo Student ID : H451110581
Approved by Advisory Committee
Prof Dr Ir Rita Nurmalina, MS Dr Ir Ratna Winandi, MS.
Chairman Member
Agreed by
Head of Agribusiness Study Program Dean of Graduate School
Prof. Dr. Ir. Rita Nurmalina, MS. Dr. Ir. Dahrul Syah, MScAgr
ACKNOWLEDGMENT
Praise to Allah the Almighty for all His blessings. Having the opportunity to study in Bogor Agricultural University, Indonesia and Georg-August University Göttingen, Germany gave me one of the most precious experiences in my life. I feel grateful to finally finish my thesis with all the efforts and supports I received from all parties.
I would like to express my deepest appreciation to my 1st supervisor Prof. Dr. Ir. Rita Nurmalina, MS. Without her guidance and full support, this thesis would not have been possible. It also gives me great pleasure in acknowledging the support and help of Dr. Ir. Ratna Winandi, MS, as my 2nd supervisor. My gratitude also goes to my supervisors in Georg-August University Göttingen, Germany, Prof. Dr. Bernhard Brümmer and Jun.-Prof. Dr. M. Wollni. Moreover, I cannot find words to express my gratitude to Dr. Thomas Kopp for his continuously advice. I wish to extend special thanks to Prof. Dr. Matin Qaim and Dr. Vijesh Khrisna for their assistance in my data collection.
I would like to thank both Georg August Universität Göttingen Germany and Bogor Agricultural University Indonesia which played a big role in assisting and giving me the opportunity to partake in the joint degree master program in Agribusiness. The program was initiated and advised by Dr. Ir. Nunung Kusnadi, MS, Dr. Ir. Suharno, M.ADev, and Dr. Ir. Andriyono Kilat Adhi from Indonesia and Prof. Dr. Stephan v. Cramon-Taubadel and Grete Thinggaard-ter Meulen, M.Sc from Germany. My financial support was provided by the Directorate General of Higher Education Indonesia.
Furthermore, my deepest gratitude goes to my lovely parents who always support and encourage me with their dedication. Last, but not least, I am indebted to my many friends and colleagues who supported and gave me invaluable relationships. They consist of all Indonesians “Göttinger zwölf” year of 2012, SIA-Uni Gö students 2012, MSA-IPB students 2011, and all my new international friends in Germany.
Bogor, August 2015
CONTENTS
Scope and Limitation of the study 8
2 LITERATURE REVIEW 9
Rubber Marketing System in Indonesia 9
Marketing Functions 10
Factors Affecting the Choice of Marketing Channels 11
Analysis of Marketing Efficiency 13
Analysis of Role and Function of Marketing Institutions 27
Analysis of Rubber Marketing Efficiency 28
5 DESCRIPTION OF RUBBER FARMER IN THE JAMBI PROVINCE 33
Characteristic of Rubber Farming in the Jambi Province 33
Characteristic of Rubber Farmers in the Jambi Province 35
6 RESULTS AND DISSCUSSION 39
Analysis of Role and Function of Marketing Institutions 39
Analysis of Rubber Marketing Efficiency 46
Analysis of Factors Influencing Marketing Channel Choices by Rubber
7 CONCLUSIONS AND RECOMMENDATIONS 57
Conclusions 57
Recommendations 58
REFERENCES 59
APPENDICES 62
BIOGRAPHY 67
LIST OF TABLES
1 World rubber production growth ('000 Tons) 2
2 Rubber production according to the type of plantation, in Indonesia
('000 Tons) 3
3 Rubber production and area in the Jambi Province 4
4 Rubber plantation area, production, and productivity in the Jambi
Province by Regency (2011) 5
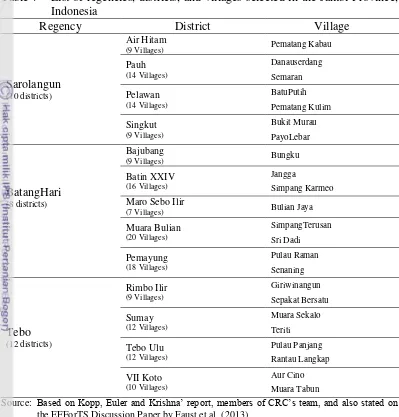
5 Marketing functions performed by salt farmers in Sumenep Regency. 10 6 Review of studies of determinants in choice of marketing channels 12 7 List of regencies, districts, and villages selected in the Jambi Province,
Indonesia 27
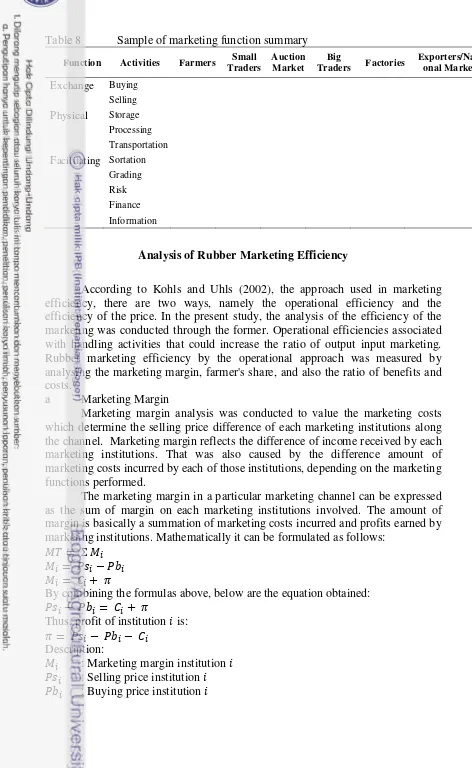
8 Sample of marketing function summary 28
9 Variables in This Study 31
10 Data of area, production and productivity of rubber in the Jambi Province
in 2011 and 2012 34
11 Descriptive statistics of rubber buying price (000 IDR) 34
12 Descriptive statistics of rubber buying price 35
13 Quantity of rubber per year 40
14 Marketing function of all rubber marketing institutions 41
15 List of existing auction market in Batanghari, Sarolangun and Tebo
Regency 44
16 Marketing margin analysis of rubber in the Jambi Province 49
17 Farmer’s share analysis of rubber marketing channel in the Jambi Province 50 18 Ratio of profit to cost of rubber marketing channel in the Jambi Province 51 19 Value of marketing efficiency on each marketing channel in the Jambi
Province 53
20 Result of analysis of factor affecting channel choice by rubber farmers in the
LIST OF FIGURES
1 Trend of world natural rubber (NR) production and consumption 1
2 Trend of Indonesian rubber trade balance in between 2008 and 2011 2
3 Shares of rubber production and area in Sumatra in 2011 3
4 Rubber price fluctuations at farmer and exporter level, 2008-2012 7
5 Rubber marketing channels in the Jambi Province 10
6 General industrial marketing channel 16
7 Marketing channel of distribution 16
8 Marketing flows in the marketing channel 17
9 The general flow of the agricultural product distribution 18
10 The marketing functions 19
11 Graphic of marketing margin 22
12 Operational framework 25
13 Map of the Jambi province 33
14 Age of rubber farmers in the Jambi Province 36
15 Experience of rubber farmers in the Jambi Province 36
16 Education of rubber farmers in the Jambi Province 37
17 Ethnic of rubber farmers in the Jambi Province 38
18 Rubber tapping in the Jambi Province 39
19 Channel chosen by rubber farmers 40
20 Selling rubber (farmer to collector) in the Jambi Province 41
21 Age of traders 42
22 Education of traders 42
23 Ethnic of trader 43
24 Auction market in the Jambi province 44
25 Rubber marketing channels in the Jambi Province 47
LIST OF APPENDICES
1 Sum of Average Price 62
2 Sum of Dry and Rainy Seasonal Price 63
3 Number of Household Member 63
4 Position in Any Village Organization 64
5 Ethnic of Rubber Farmers 64
6 Rubber Quantity per Year Produced by Farmers 65
7 Descriptive Statistics of Variables Included in the Model 65
LIST OF ABBREVIATIONS
CBS : Badan Pusat Statistik (Centre Board of Statistics)
FAO : Food and Agriculture Organization of the United Nations
GAPKINDO : Gabungan Perusahaan Karet Indonesia (The Rubber Association of
Indonesia)
IDR : Indonesian Rupiah
IRSG : International Rubber Study Group
MLR : Multinomial Logistic Regression
NR : Natural Rubber
OLS : Ordinary Least Square
SIR : Standard Indonesian Rubber
TR : Tobit Regression
1 INTRODUCTION
Background
Rubber remains an important commodity in international trade. It gives high contribution as the main raw material for many industries. Most of rubber production is processed to produce tyre for many types of vehicles in the world, while the rest may be processed to be developed into home and industrial appliances. The increasing demand and production of different types of vehicles and other processed rubber products lead to the increase in rubber consumption (Rubber World Magazine, 2012).
Malaysian Rubber Board (2014) reported an upward trend of rubber production and consumption worldwide. In 2011, the production of natural rubber reached 11,230 thousand tons, while consumption reached 10,997 thousand tons (Figure 1). Based on Figure 1 below, it can be identified that rubber producers has managed production according to consumer demand. It also shows that the rubber market has interacted dynamically.
Figure 1 Trend of world natural rubber (NR) production and consumption
Source: Malaysian Rubber Board (2014)
World rubber production is dominated by countries in the continent of Asia. Among those countries, Indonesia is the second largest rubber producer after Thailand. Based on data from FAO (2013), in 2011, Indonesia is responsible for 2,990 thousand tons of rubber production. Indonesia contributes 27.11% to the
world’s rubber production market. Indonesia has a promising potency to be one of
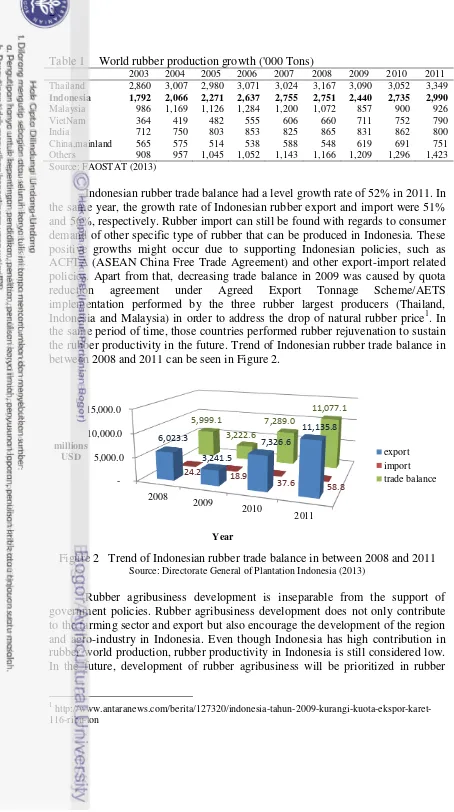
the leading producers to meet the growing demand, considering the increasing trend in rubber production in the past 10 years (Table 1).
Table 1 World rubber production growth ('000 Tons)
Indonesian rubber trade balance had a level growth rate of 52% in 2011. In the same year, the growth rate of Indonesian rubber export and import were 51% and 56%, respectively. Rubber import can still be found with regards to consumer demand of other specific type of rubber that can be produced in Indonesia. These positive growths might occur due to supporting Indonesian policies, such as ACFTA (ASEAN China Free Trade Agreement) and other export-import related policies. Apart from that, decreasing trade balance in 2009 was caused by quota
reduction agreement under Agreed Export Tonnage Scheme/AETS
implementation performed by the three rubber largest producers (Thailand, Indonesia and Malaysia) in order to address the drop of natural rubber price1. In the same period of time, those countries performed rubber rejuvenation to sustain the rubber productivity in the future. Trend of Indonesian rubber trade balance in between 2008 and 2011 can be seen in Figure 2.
Figure 2 Trend of Indonesian rubber trade balance in between 2008 and 2011
Source: Directorate General of Plantation Indonesia (2013)
rehabilitation and rejuvenation in order to improve the productivity and to expand the rubber plantation2.
Apart from that, most of rubber production in Indonesia is dominated by smallholder plantation (Table 2). Estates or larger types of plantation production contribute only about a quarter of the smallholder plantation production. That is also positively correlated with the total area of both plantation types. Smallholder plantations and estates had 2,913.80 and 524.3 thousand Ha of total area respectively in 2011 (CBS, 2013). Both production and total area of rubber plantation show an upward trend, which indicates a positive growth of rubber production in Indonesia.
Table 2 Rubber production according to the type of plantation, in Indonesia ('000 Tons)
2007 2008 2009 2010 2011
Smallholder 2176.7 2,148.7 1,918.0 2,193.4 2,359.8
Estates 578.5 586.1 522.3 541.5 630.40
*) provisional figure; Source: CBS (2013)
There are several provinces in Indonesia that have greater contribution in rubber production than the rest of the country. Sumatra island, consisting of 10 provinces, had the largest contribution of 66% to the total Indonesian rubber production in 2011 (Ministry of Agriculture Indonesia, 2014). Among those provinces, the Jambi province is one of the largest contributors in rubber production. It has the third largest rubber plantation area among others, after South Sumatra and North Sumatra in 2011 (Ministry of Agriculture Indonesia, 2014).
Figure 3 Shares of rubber production and area in Sumatra in 2011
Source: Ministry of Agriculture Indonesia (2014
Rubber plantation is expected to be the most important commodity. In the Jambi province, rubber has the largest plantation exceeding palm oil (CBS - the Jambi Province, 2011). The growth of rubber production and its plantation in the Jambi province can be seen in Table 3. In addition, CBS - Jambi (2011) stated that the volume and value of exported rubber and its products in the Jambi province
2
reached 242,818.80 tons and 1,129,142.81 USD in 2011. The value of exported rubber was 47% of the total value of all exported products in the Jambi province (Table 3).
Table 3 Rubber production and area in the Jambi Province
2008 2009 2010 2011
Production (tons) 305,828 273,173 306,313 319,948
Area (Ha) 442,341 440,866 444,170 444,533
Source: Ministry of Agriculture Indonesia (2014)
Explanation above has obviously explained that in the Jambi province, rubber is considered as a strategic commodity which is able to give a boost to the
rubber farmers’ income and to the regional economic growth. Rubber in the Jambi
province has a great development supported by the government policies. With bright prospect in the free market, rubber is noted as one of the leading commodity in the Jambi province.
Currently, almost 100% of Indonesian exported rubber is in the form of upstream industrial products (semi-finished) such as rubber sheet (Ribbed Smoked Sheet, RSS), rubber crumb (Standard Indonesian Rubber, SIR), and concentrated latex, while the downstream industry products are still very limited3. Rubber factories, mostly the exporters, in the Jambi province, mainly produce rubber in the form of rubber crumb (SIR 20). Nonetheless, most of Indonesian rubber farmers, especially Jambi rubber farmers, produce nothing else but rubber in the form of lump or bokar (rubber lump compound)4. Rubber latex still can be found sold by farmers with very low price which then will be distributed to the bigger factory in order to upturn its quality, while rubber sheet still also can be discovered produced by farmers with high technology.
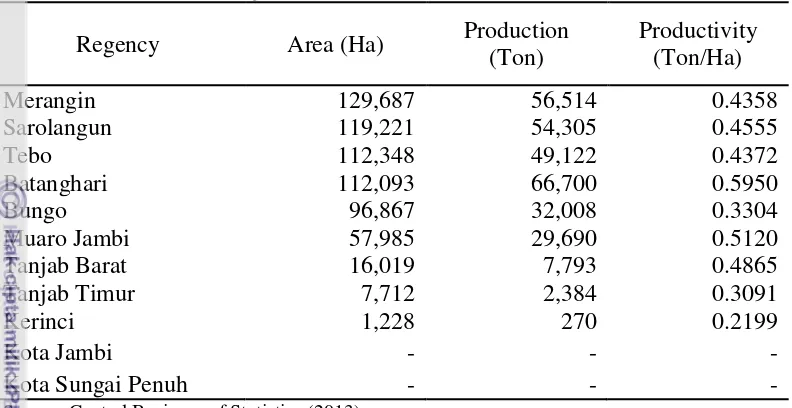
Table 4 Rubber plantation area, production, and productivity in the Jambi
Merangin 129,687 56,514 0.4358
Sarolangun 119,221 54,305 0.4555
Tebo 112,348 49,122 0.4372
Batanghari 112,093 66,700 0.5950
Bungo 96,867 32,008 0.3304
Directorate General of Plantation Indonesia (2013) recorded that in 2011, the average national price of rubber sheet was 16,793 IDR/kg and rubber lump was 12,814 IDR/kg. Those are considerably high in comparison with the average price of rubber latex which was 8,406 IDR/kg (Ministry of Agriculture, 2013). However, even though there were an increase in those prices over the previous year, the average export value of processed rubber was extremely high at 4.35 USD/kg or approximately 39,207 IDR/kg (1 USD = 9,000 IDR, year 20115) Directorate General of Plantation Indonesia (2013). CBS - Jambi (2011) stated that rubber crumb (SIR 20) in the Jambi province was exported in the price level of 3.83 USD/kg or approximately 34,470 IDR/kg (1 USD = 9,000 IDR, year 2011).
According to the data, it can be recognized that the price received by the farmer was relatively low in comparison with price in exporter market. Most of rubber price information flows from the exporters to several intermediaries before it reaches the rubber farmers, which may become one of the reason why there is a big difference between those prices. Other factors are also plausible to affect this disadvantage position. Furthermore, previous studies showed that less access of price and market information, farmer dependence on village trader (collector), and also ill-functioning auction market, facilities and infrastructures were responsible for farmers in the Jambi province to be unable in controlling the rubber price development continuously (Masduki, 1996; Amalia, 2013). Thus, the role and function of each marketing institution need to be addressed further.
The efficiency of marketing system can be observed by analysing the price levels and stability (Amstrong and Kotler, 2013, p. 285ff). Incentive towards rubber production or trading activities is improved when rubber price is stable or better yet goes up. The higher the selling price of rubber, the more motivated farmers will be to increase the production. Price level and its stability indicate the efficiency of marketing system (Amstrong and Kotler, 2013, p. 285ff).
5
Improvements in the rubber marketing system are required to be intended to enhance the marketing efficiency by increasing the value received by farmers, decreasing the marketing cost and creating a relevant selling price to the consumer purchasing power. Hence, the rubber marketing efficiency is evaluated in this study by examining the marketing margin, farmer share and Li/Ci ratio.
Additionally, marketing efficiency is affected by decision in choice of marketing channels. Amstrong and Kotler (2013, p. 321) mentions that channel choice plays a big role in the marketing decision of marketing system. Considering choice in marketing channels will also lead to the enhancement of marketing efficiency. As mentioned earlier, marketing channel in rubber marketing system consists of several intermediaries between farmers and exporters. Those are village traders, district traders, warehouse (big traders), auction market, and factories (exporters) (Kopp et al., 2014).
Each intermediary performs different marketing function and behaviour
which influence the rubber farmers’ channel choice. Obviously, farmers will
choose the most profitable channel. Nonetheless, farmers are still found choosing unsuitable channel which possibly cause inefficiency in rubber marketing. To overcome the hurdle, it is required a marketing channel analysis of rubber farmer in the Jambi province, which is performed in this study.
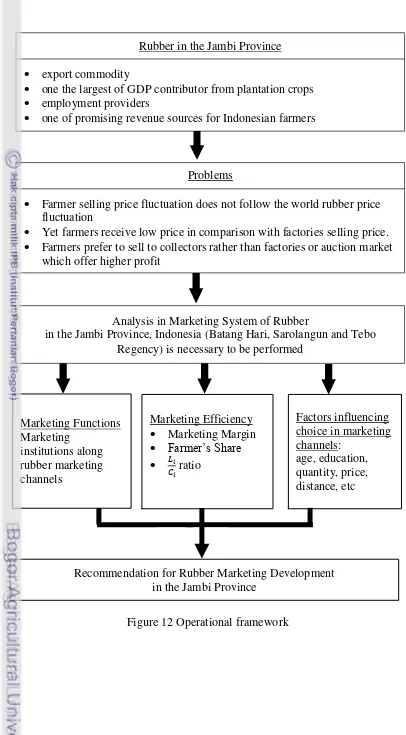
Problem Statement
The tendency of global trade, which is increasingly open and competitive, becomes opportunities and challenges to all business players, including institutions/actors in the rubber market. Marketing of Indonesian rubber has emerged towards international market. Moreover, the development of Indonesian rubber has relatively showed an enhancement from year to year, which then become a prospective opportunity for Indonesia in obtaining high foreign exchange income from this commodity. Encountering these liberalisation and free market, marketing obviously plays an important role in furtherance of escalating rubber competitiveness. Weakness in rubber competitiveness will diminish the income of business players, as well as farmers.
The development of rubber in the Jambi province, as one of the biggest rubber producers in Indonesia, is not spared from many issues both of production
and marketing aspects, where those are able to affect the farmers’ welfare.
Researched conducted by Balitbangda of the Jambi Province (2009) revealed problems occurring in rubber plantation, those are: 1) low implementation level of new high quality (prima) rubber seed use, 2) low productivity, 3) collectors which have tendency to press the rubber price, and 4) production technique which applied out of the rubber production rules. Also, low quality of rubber due to its high water content lengthens production issues within rubber plantation in the Jambi province.
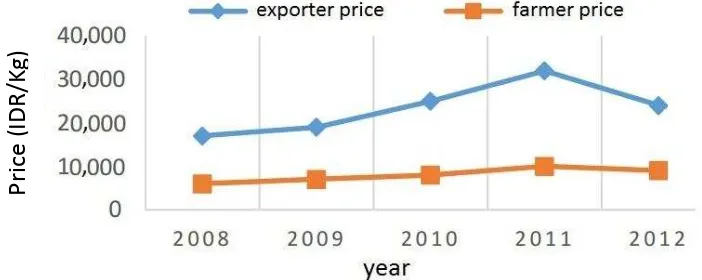
Figure 4 Rubber price fluctuations at farmer and exporter level, 2008-2012
Source: Herdiyansyah (2014)
The pair of rubber productivity and quality becomes the main issues in production aspect. On the other hand, the big difference between Indonesian rubber export price and farmer price may lead to a concern in marketing aspect. Both production and marketing aspect are related to each other. Farmers are possibly not interested to increase the productivity, especially the quality because of the low price. Thus, rubber marketing system is required to be taken into account.
Farmers’ lack of information, and financial and education constrain are
plausible to be the reason behind this issue. Most rubber farmers in the Jambi province acquire less information regarding current price and bokar quality required by market. Those give farmers a low bargaining power on price determination which is then determined by collectors as intermediaries. In other words, rubber farmers become a price taker. Explanation above becomes the illustration of the issue occurred in the rubber marketing system in the Jambi province, which leads to a research question; how is the overview of the marketing institutions which are available in the Jambi province and also their
role in escalating farmers’ welfare?
In addition, all rubber marketing actors in rubber marketing channel have each own role many marketing channel are available where some of channels are considered inefficient. This may lead to uncompetitive rubber market. Thus, another question is raised; how is the rubber marketing efficiency in the Jambi province?
Research Objectives
The objectives of the study conducted in the Jambi province (Batanghari, Sarolangun, and Tebo regency) are:
1. To analyse the role and function of marketing institutions in rubber market in the Jambi province.
2. To evaluate the rubber marketing efficiency by observing the marketing margin, farmer share and Li/Ci ratio in the Jambi province.
3. To characterize and to analyse factors affecting the marketing channel choice by rubber farmers in the Jambi province.
Benefits of the Study
This study provides information about the situation in the rubber marketing system in the Jambi province, Indonesia. It is expected that this study will identify problems occurring in the rubber marketing channel system. Broadly, this information will be beneficial for students, researchers, farmers, expertise, and policy maker who are concerned to the rubber market. This information will be useful as a reference for those who will conduct research related to the supply chain, marketing efficiency and marketing channel choice.
The result is peculiarly expected to provide policy recommendations to support the development of rubber agribusiness to improve the welfare of Indonesian rubber farmers. Results from this study will contribute in the development of the Indonesian rubber industry that indirectly leads to the sustainability of economic growth in Indonesian agriculture. Moreover, it will raise the competitiveness level of rubber both nationally and internationally.
Scope and Limitation of the study
This study analyses the rubber marketing system in the Jambi province, Indonesia. Three regencies, Batanghari, Sarolangun and Tebo regency, were chosen to be observed as they are considered as influential rubber producers. Specifically, this study focuses on the role of marketing institutions in rubber marketing, the rubber marketing efficiency and the marketing channel choice by rubber farmers. Rubber produced by Jambi rubber farmers is natural rubber, which then processed to be exported outside the country as semi-finished product (rubber crumb) or to be processed inside the country as a mixture of finished rubber product.
Qualitative approach is accounted as the appropriate tool to be applied for analysing the role of rubber marketing institutions in rubber industry. Marketing efficiency is further observed by calculating rubber marketing margin, farmer’s share and ratio of benefit and cost. Interconnection between all rubber marketing actors in rubber marketing, which are rubber farmers to rubber crumb exporters in the Jambi province, is reckoned in this analysis.
choice of marketing channels. Some of those factors are farmer’s characteristics,
size of business, profitability aspects and location.
At last, explanation above describes the scope of this research. Other assessments on rubber marketing performance, which are not stated above, are not included in this study.
2 LITERATURE REVIEW
In this chapter, the previous studies related to this study will be depicted. Those will be further employed as references in the methodology and result of this study. The recent condition of market and marketing channel of rubber in Indonesia, factors affecting the choice of farmer marketing channels, and marketing efficiencies will be discussed here.
Rubber Marketing System in Indonesia
There are numerous studies discussing the condition of the rubber market in Indonesia (Arifin, 2005, USAID, 2007, Fathoni, 2009, Arifin, 2013, and Kopp et al., 2014). Those studies explain the bigger picture about the roles of each marketing institutions/actors in the distribution of rubber. The latest rubber market condition is also being reported.
Arifin (2005& 2013) and Fathoni (2009) concluded that the rubber market is not yet efficient. Changes in the world market price are not well transmitted towards the domestic price (Fathoni, 2009). Even more, this price information may not well informed through the rubber marketing channel down to the farmer. Thus, the motivation of farmer to produce more and better rubber may change.
Arifin (2013) further explained that rubber quality needed to be achieved in order to fulfil factory demands. When all criteria of rubber are accomplished, the competitiveness level of rubber would increase, thus increasing the efficiency of the rubber market (Arifin, 2013). This indicates that the role of the marketing channel actors, in fulfilling factory demands leads to the efficiency of the rubber market.
Based on the description above, the rubber marketing channel becomes an essential part in the marketing system. Particularly in the Jambi province, Fathoni (2009) described several channels which can be chosen by farmers, namely traders, auction markets and exporters (Fathoni, 2009).
There are several factors that may affect the decision of farmers or producers to sell their products, including the quality of rubber, the price offered, location, capital and access to information (Fathoni, 2009 and Kopp et al., 2014).There are around 251,000 rubber farmers in the Jambi province, whereby 61% of them sell their products to the village traders (Kopp et al., 2014).The current rubber marketing channels in the Jambi province can be seen in Figure 5. In addition, Kopp et al. (2014) recorded that most of rubber quality produced in the Jambi province is SIR20, known internationally as Technically Specified Rubber (TSR).
Figure 5 Rubber marketing channels in the Jambi Province
Source: Kopp et al. (2014)
Marketing Functions
Alham (2013) mentioned in her thesis of the Analysis of Salt Marketing in Sumenep Regency East Java that salt farmers performed three marketing functions, which are exchange, physical, and facilitating function. Her thesis was about analysing the structure, conduct and performance of salt marketing in Sumenep Regency, where those function analysis was described to support her observation. Those marketing functions are described in Table 5.
Table 5 Marketing functions performed by salt farmers in Sumenep Regency.
Marketing Institution Marketing Functions Description
Farmers Exchange Function Selling
Physical Function Storage
Facilitating Function Risk
Financing
function, physical function, and facilitating function. His thesis was about the Marketing System of Smallhoder Farmer in Tebo Regency, in the Jambi Province by Supply Chain Approach.
Factors Affecting the Choice of Marketing Channels
The decision to choose certain marketing channels describes the behaviour of marketing actors. Further recommendation and policy to increase marketing efficiency could use this information as reference. Related to that, there are studies discussing the choices of marketing channels of different commodities
(FertőandSzabó, 2002; Zúñiga-Arias, 2007; Bignebatet al., 2009; Chirwa, 2009; Xaba and Masuku, 2013). Most studies analyzed the choice of marketing channels
on the producer’s level. Many determinants were found to significantly influence the decision of channel choice. The review of studies of determinants in Choice of Marketing Channel can be seen in Table 6.
Fertő and Szabó (2002) discussed the effect of transaction cost, described
by the information, monitoring and negotiation costs, on the choice of marketing channels by the Hungarian vegetable farmers. The characteristics of farmers are also taken into account by observing their age, education and investment
background (Fertő and Szabó, 2002). The result of the study suggested that determinants effects of channel choice vary between channels.
Another study found that the effect of experience, production, location and
distance are significant influences in the producers’ choice to sell mangos in Costa
Rica (Zúñiga-Arias, 2007). Moreover, Chirwa (2009) divided the determinants into the characteristics of farmer, crop and market. Contracts or agreements and
participation in a certain organization are also being considered as farmers’
Table 6 Review of studies of determinants in choice of marketing channels
Another study found that the effect of experience, production, location and
distance are significant influences in the producers’ choice to sell mangos in Costa
Rica (Zúñiga-Arias, 2007). Moreover, Chirwa (2009) divided the determinants into the characteristics of farmer, crop and market. Contracts or agreements and
participation in a certain organization are also being considered as farmers’
channel choice decision (Xaba and Masuku 2012). Bignebat et al., 2009 also explained that car ownership and technical assistance are also influential.
Another study found that the effect of experience, production, location and
distance are significant influences in the producers’ choice to sell mangos in Costa Rica (Zúñiga-Arias, 2007). Moreover, Chirwa (2009) divided the determinants into the characteristics of farmer, crop and market. Contracts or agreements and participation in a certain organization are also being considered as farmers’ channel choice decision (Xaba and Masuku 2012). Bignebat et al., 2009 also explained that car ownership and technical assistance are also influential.
and Bignebat et al., 2009). On the other hand, Logistic Regression Model will be 2002, Chirwa, 2009, and Xaba and Masuku, 2013).
Based on those studies, there are groups of explanatory variables that need
to be taken into account. First is the producers’ characteristics, including age,
education and experience. Second is the scale of business, described by the car ownership, and production area. Third is profitability aspect, illustrated by price. Fourth is information access. Fifth is negotiation aspect, described by the existence of agreement. The last is location, explained by distance and location.
Analysis of Marketing Efficiency
Narulita (2008) performed a Marketing Efficiency Analysis research on Star fruit in Pancoran Mas, Depok, West Java. The purposes of the research are 1) to analyze the functions of marketing channels and functions conducted by marketing agencies of sweet Star fruit commodity in Depok, 2) to analyze the structure and behavior market of sweet star fruit in Depok, 3) to analyze the marketing efficiency of star fruit to specify an alternate of its marketing channel. The method used was qualitative and quantitative analysis. Qualitative analysis aims to analyze marketing channels, marketing agencies, marketing functions, structure and market behavior. Quantitative analysis is used to analyze the marketing margin, farmer's share, the ratio of benefits and costs. Sampling method used is random sampling, with 40 farmer respondents, while sampling for marketing agencies conducted by the method of snowball sampling.
Prihatiningsing (2007) performed a research on Supply Chain Efficiency Analysis Commodities Onion. This study aims to 1) analyze the management of the supply chain (Supply Chain) onion commodity circulating in Bogor and 2) analyze the efficiency of commodity supply chain of onion in Bogor. The primary members of the onion supply chain in the city of Bogor consists of the sender, wholesalers, retailers and consumers, including industries, while the secondary member consists of the transportation agencies engaged in transportation, packaging manufacturers, transport workers, and providers of onion slicing machines. Transshipment models produce allocations that minimize the cost of red onion red onion supplies to markets in the city of Bogor.
cocoa farmers, 18 collectors, two large cocoa trader and one processed industry. He performed marketing efficiency measurement by analyzing the margin, farmer's share, the ratio of benefits and costs.
3 FRAMEWORK
Theoritical Framework
The underlying theories and concepts of this study are addressed in this chapter. However these explanations were not aimed to prove how the theories and concepts work in detail, but to indicate the relevancy of this empirical study to the theories and concepts. The theories and concepts in respect of marketing, marketing efficiency, marketing function, marketing channel, and logistic are explained below.
Marketing System
Kohls and Uhl (2002) explained that as a system, marketing of agricultural products include commutual parts which contribute to all firms, industries and social goals. They further described that the marketing system covers all agricultural products processes performed from producers until consumers together with the price-setting processes in the market system. Kohls and Uhl (2002:7) specifically defined that marketing for agricultural products is “the performance of all business activities involved in the flow of products and services from the point of initial agricultural production until they are in the hands of consumers”.
Levens (2010:3) further explained that “marketing is a set of a process and a function of organization made in order to plan, create and communicate and deliver value to customers, and to develop effective relationships with customers with the benefits obtained by the organization and its stakeholders”. It is expected
that profit gained by marketing actors is achieved by gratifying consumers in the form of demand fulfilment. In accordance to the marketing definition, Kotler and
Keller (2012:27) also stated that marketing is “a societal process by which individuals and groups obtain what they need and want through creating, offering, and freely exchanging products and services of value with others”. In a
way, as the marketing concept, the purpose of marketing is to understand and satisfy consumer needs by creating, communicating and distributing value, are build (Levens, 2010:4).
agricultural products from primary producers to end consumers, where currently, the marketed agricultural products are not only in the form of agricultural raw products but also agricultural semi-finished and finished products. Concept of agrimarketing was also appointed by Asmarantaka (2014), where agrimarketing is
the sum of the process, functions, and services performed in connection with food and fiber from the farms on which they are produced until their delivery into the hands of the consumers (Ricketts and Rawlins in Asmarantaka, 2014:3).
Moreover, marketing can be viewed from aspects of economics and aspects of management science. In the aspect of economic science - macro aspect - marketing is a system that consists of marketing functions sub-systems. Those are function of exchange, physical and facilities, where those functions constitute productive activities in the flow of products from agricultural producers to end consumers (Asmarantaka 2012). In the product distribution system, farmers are considered as the primary producers, where collectors, processor, factories and consumers are also taken into account.
In its management aspect, marketing is defined as a social process and managerial process where individuals and organizations get what they need and want through creating and exchanging value with others. In a narrow context, marketing covers creating value exchange relationships with the profitable customers. Therefore, marketing, is defined as the process by which companies create value for customers and build strong relationships with customers, with the aim of capturing value from customers in return (Kotler and Armstrong, 2008 and Asmarantaka, 2014). Yet marketing management is considered as an approach from micro or managerial aspect; a process of how a company develops plan, price determination, promotion which is further called as marketing strategies.
Marketing Channel
Coughlan et al. (2006:3) defined that “a marketing channel is a set of interdependent organization involved in the process of making a product or service available for use or consumption”. A set of interdependent organization
explains the existence of marketing actors which are interconnected and interdependent to each other (Coughlan et al., 2006:3). Kotler and Keller
(2012:437) and Amstrong and Kotler (2013, p. 321) also use the term of “a set of interdependent organization”, in their marketing channel definitions, to explain
the marketing actors’ connection in the process of distributing products. In addition, Levens (2010:151) explained that the marketing channel is “a network of all those involved in the flow of products or services from producers to consumers”.
Levens (2010) further explained that the marketing channel is a network of all those involved in the flow of products or services from producers to consumers. Marketing channels are divided into 2 channels, namely direct and indirect channels, depends on the existence of intermediaries. Intermediaries in
marketing channels cover “any channel member other than the manufacturer or the end-user” (Coughlan et al., 2006:15). The numbers of intermediaries signify
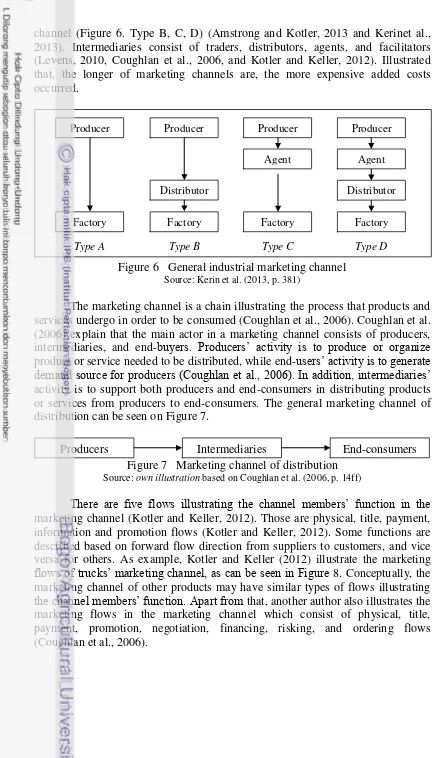
channel (Figure 6. Type B, C, D) (Amstrong and Kotler, 2013 and Kerinet al., 2013). Intermediaries consist of traders, distributors, agents, and facilitators (Levens, 2010, Coughlan et al., 2006, and Kotler and Keller, 2012). Illustrated that, the longer of marketing channels are, the more expensive added costs occurred.
Figure 6 General industrial marketing channel
Source: Kerin et al. (2013, p. 381)
The marketing channel is a chain illustrating the process that products and services undergo in order to be consumed (Coughlan et al., 2006). Coughlan et al. (2006) explain that the main actor in a marketing channel consists of producers, intermediaries, and end-buyers. Producers’ activity is to produce or organize product or service needed to be distributed, while end-users’ activity is to generate
demand source for producers (Coughlan et al., 2006). In addition, intermediaries’
activity is to support both producers and end-consumers in distributing products or services from producers to end-consumers. The general marketing channel of distribution can be seen on Figure 7.
Figure 7 Marketing channel of distribution
Source: own illustration based on Coughlan et al. (2006, p. 14ff)
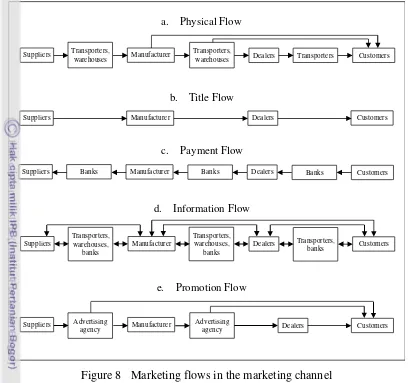
There are five flows illustrating the channel members’ function in the
marketing channel (Kotler and Keller, 2012). Those are physical, title, payment, information and promotion flows (Kotler and Keller, 2012). Some functions are described based on forward flow direction from suppliers to customers, and vice versa for others. As example, Kotler and Keller (2012) illustrate the marketing
flows of trucks’ marketing channel, as can be seen in Figure 8. Conceptually, the marketing channel of other products may have similar types of flows illustrating
the channel members’ function. Apart from that, another author also illustrates the marketing flows in the marketing channel which consist of physical, title, payment, promotion, negotiation, financing, risking, and ordering flows (Coughlan et al., 2006).
Producers Intermediaries End-consumers
Producer Producer Producer Producer
Factory Factory Factory Factory
Agent Agent
Distributor Distributor
Figure 8 Marketing flows in the marketing channel
Source: Kotler and Keller (2012, p. 441)
Bovee and Thill (1995) stated that the marketing channel is a system designed to move goods and services from producers to consumers, which is made up of people and organizations that are supported by a wide range of facilities, equipment, and information resources. Marketing channels is the basis of company operational and administrative office location that has strategic value to facilitate the smoothness of products delivery from producers to consumers through trade transactions (Hasan, 2008).
Figure 9 below is the general flow of the distribution of agricultural products based on Harianja and Hasibuan (2009). Processors are necessary to be available in a channel regarding processing requirement which might be needed for some agricultural products in order to meet consumer demand.
e. Promotion Flow
Suppliers Advertising Manufacturer Dealers Customers
agency
Advertising agency Transporters,
warehouses, banks
Suppliers Manufacturer Dealers Customers
Transporters, warehouses,
banks
Transporters, banks
d. Information Flow
Suppliers Banks Manufacturer Banks Dealers Banks Customers
c. Payment Flow
Suppliers Manufacturer Dealers Customers
b. Title Flow
Transporters,
warehouses Manufacturer
Suppliers Transporters,
warehouses Dealers Transporters Customers
Figure 9 The general flow of the agricultural product distribution
Source: Harianja and Hasibuan (2009)
Marketing Channel Choice
Channel choice is an essential decision in marketing channels (Kerinet al., 2013). The decision in channel choice can influence the effectiveness and efficiencies of channel structures (Coughlan et al., 2006). Moreover, other marketing decisions are influenced by channel choice decision, such as the decision of pricing and communication (Amstrong and Kotler, 2013, and Kotler and Keller, 2012).
Marketing actors need to consider marketing channel strategies that describe the type of marketing channels and the number of marketing agencies involved, the management of marketing channel and the distribution intensity performed (Levens 2010). Type of marketing channel strategy is determined by considering the selection of marketing channel which can be a direct or indirect channel. Marketing channel strategy in the form of distribution intensity includes intensive, selective and exclusive distribution. Intensive distribution strategy is performed by selling products in many locations in order to obtain the products with ease, while selective distribution strategy is performed by selling products to certain specified retailers which were determined selectively, where consumers need a longer period of time to buy the product (Levens 2010).
In addition, another channel can be chosen due to its adversity, expense, or ineffectiveness in dealing with the previous channel selected (Kotler and Keller, 2012). Furthermore, there are 3 considerations in selecting channels, and those are channel which are able to 1) capture the widest coverage of the target market, 2) achieve demand requirements of the target market, and 3) provide the highest profit (Kerinet al., 2013). By considering those explanations, the best channel decision can be achieved.
The Functional Approach to Marketing
According to Limbong and Sitorus (1987), below are the marketing functions performed by marketing actors. Those are:
1. Exchange Function; the activities that facilitate transfer ownership of goods and services marketed. Exchange function consists of purchasing and sales functions.
2. Physical Function; all actions which are able to improve spot, form and time usability. Physical function includes storage, processing, and transportation.
3. Facilitating Function; all actions which are aimed to facilitate the exchange of activities occurred between producers and consumers. Facilitating function consists of the function of standardization and grading, use of risk, finance and market information, including the government services in preventing conflict between supply chain components.
Kohl and Uhl (2002) also stated those three functions which can be seen in Figure 10. The functional approach is necessary in recognizing the divergence of marketing costs of various agricultural products. As an example, perishable product is generally more costly to market than one that is less perishable in accordance to their transportation, storage and risk bearing functions.
Figure 10 The marketing functions
Source: Kohl and Uhl (2002)
There are three crucial attributes related to those marketing functions Kohl and Uhl (2002) and Asmarantaka (2014). First, the functions influence not only the marketing cost but also products value to consumers. The value added by a marketing function is possibly more than the cost of performing that function. Second, middlemen elimination may cause marketing functions elimination which is not efficient to be performed. The cost of performing a marketing function can be reduced while the functions need to be maintained. Lastly, the third, characteristics of marketing functions are able to be conducted by any other marketing actors in the marketing system, where an actor can perform more functions than previous functions complied. The functions may be essential, but those can be complied by anyone in various places within the industry.
Levens (2010) explained that marketing functions are activities conducted within actors that create value for specific product or service. Similar to what was mentioned before, Levens also stated that there are three categories of marketing function, namely exchange functions, physical functions and facilitating functions.
Exchange function describes the activity supporting the product’s transfer, while
physical function describes the activity of distribution from producers to consumers (Levens, 2010, p. 7). Moreover, facilitating function describes the activity of assisting both exchange and physical functions (Levens, 2010).
The Institutional Approach to Marketing
This institutional approach assists to address the existence of marketing
confronted at the same situation with consumers, where middlemen are often found to bridge the connection. This approach deliberates the nature and characters of the various middlemen and related marketing actors and also the arrangement and organization of the agricultural marketing activities (Kohl and Uhl, 2002).
Adding to the explanation above, the general role of middlemen or intermediaries is to perform some or all activities associated with of marketing functions. As an exchange/transactional function, intermediaries perform activities
such as “buying, selling and risk taking”, while as a physical/logistical function,
intermediaries may undertake “assorting, storing, sorting, and transporting”
(Kerinet al., 2013:379). Moreover, as a facilitating function, intermediaries are
able to implement “financing, grading, and marketing information and research”
(Kerinet al., 2013:379).
Based on the demand-side, there are 2 advantages to the existence of
intermediaries’. One benefit is its ability to facilitate demand connections between
producers and end-users, while another benefit is to fulfill the demand requirement of end-buyers by sorting products (Coughlan et al., 2006). Moreover, Kerinet al. (2013) explained that there are 4 benefits obtained by consumers from the existence of intermediaries, namely time, place, form and possession utilities. On the other hand, based on the supply-side, there are also two advantages provided by intermediaries, which are 1) to support producers in reducing distribution costs, by arranging frequent transactions, and 2) to assist producers in reducing transaction or contact costs obtained by producers (Coughlan et al., 2006). It can be seen that intermediaries may profit both the demand-side and supply-side in accordance to the functions complied in the industry.
Asmarantaka (2014) explained that the institutional approach consists of middlemen (assemblers/collectors, retailers and wholesalers), intermediary agents (brokers and commissioners), speculators, processors and manufacturers, facilitative organizations. Wholesalers often provide credits or capital to the collectors and retailers. Intermediary agents obtain their revenue from fee or commission from the selling activities. Meanwhile, speculators get their revenue by gaining from price fluctuation occurred in the market. On the other hand, processors and manufactures handle products and innovates the form of raw products into semi-finished and finished products. Lastly, facilitative organization facilitates marketing activities or the marketing function implementation by creating regulations, policies, auctions, association, and other institutions.
There might be bias in observing benefits of the existence of middlemen and other related marketing actors. Analyzing relevant comparison, such
middlemen’s costs versus farmer or consumer costs for performing the same
marketing function, will lead to equitable judgment in order to meet the efficient market system. There are many situations where farmers and consumers can
efficiently perform the middlemen’ functions (Kohl and Uhl, 2002).
Concept of Marketing Efficiency
Efficiency in marketing system will be created if the entire marketing actors are involved in activities to obtain satisfaction with the marketing activities (Limbong and Sitorus 1987). Efficiency in the agricultural industry is often applied to evaluate its market performance (Kohl and Uhl, 2002). Efficiency in marketing is able to be achieved when the marketing activities are undertaken by optimizing input without reducing consumer satisfaction.
Marketing efficiency indicators of agricultural products can be classified into two types, namely operational and price efficiency (Kohl and Uhl, 2002 and Asmarantaka, 2014). Operational efficiency correlates with the implementation of marketing activities which is able to increase or to maximize the output-input ratio of marketing. Labor productivity or output per labor hour in able to measure operational efficiency (Kohl and Uhl, 2002). Moreover it can also be measured by an analysis of marketing margin and farmer's share (Asmarantaka, 2014) which indicate the minimum cost that can be achieved by the implementation of the basic functions of marketing, namely the collection, transport, storage, processing, distribution and physical activity, and facilities.
The second type, price efficiency, emphasizes to the ability of marketing system in allocating resource, and coordinating all agricultural production and
marketing process so that the efficiency will meet the consumers’ satisfaction (Asmarantaka, 2014). Moreover, marketing firms compete for the consumer’s
favor by descending marketing costs and rising operational efficiency (Kohls and Uhls, 2002).
The efficiency of the price indicates the ability of price and signs of price to the seller and gives a signal to consumers as a guide on the use of production resources in terms of production and marketing (Dahl and Hammond 1977). According to Kohls and Uhls (2002), the efficiency of the price measure how strong the market price describing production systems and marketing costs. Price efficiency is usually measured from the same correlation in commodity prices at different market levels.
Asmarantaka (2014) added that price efficiency will be achieved if; 1) each party involved is satisfy or responsive to the prevailing price, 2) the utilization of resource flows from the low-value to the high-value utilization, and 3) there is coordination of activities between sellers and buyers, from farmers, marketing institutions and consumers. Price efficiency is a thoroughly concept of marketing system where the most efficient price may occur if there is a high coordination between marketing institutions in the system. Market integration analysis becomes the indicator of price efficiency.
Both operational and price efficiency are expected to move in the same direction, even though contradiction is often occurred. Overall, according to Asmarantaka (2014) agribusiness marketing will be efficient if these following indicators are available, namely:
1) Creating or developing high value added of agricultural products
2) Generating profit for each marketing actors/institutions involved according to cost expensed
3) Marketing margin is relatively in accordance with functions or business activities which increase the consumer satisfaction.
Thus, agribusiness marketing is efficient if there is equitable share or contribution along the marketing channel, from farmers to consumers followed by consumer satisfaction.
Marketing Margin
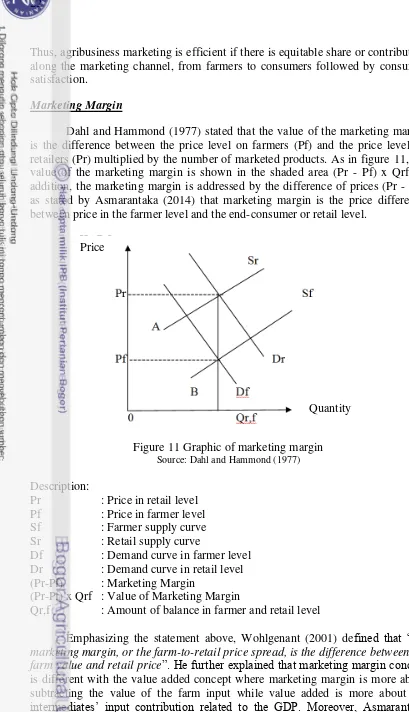
Dahl and Hammond (1977) stated that the value of the marketing margin is the difference between the price level on farmers (Pf) and the price level on retailers (Pr) multiplied by the number of marketed products. As in figure 11, the value of the marketing margin is shown in the shaded area (Pr - Pf) x Qrf. In addition, the marketing margin is addressed by the difference of prices (Pr - Pf), as stated by Asmarantaka (2014) that marketing margin is the price difference between price in the farmer level and the end-consumer or retail level.
Figure 11 Graphic of marketing margin
Source: Dahl and Hammond (1977)
Description:
Pr : Price in retail level
Pf : Price in farmer level
Sf : Farmer supply curve
Sr : Retail supply curve
Df : Demand curve in farmer level
Dr : Demand curve in retail level
(Pr-Pf) : Marketing Margin
(Pr-Pf) x Qrf : Value of Marketing Margin
Qr,f : Amount of balance in farmer and retail level
Emphasizing the statement above, Wohlgenant (2001) defined that “the marketing margin, or the farm-to-retail price spread, is the difference between the farm value and retail price”. He further explained that marketing margin concept
is different with the value added concept where marketing margin is more about subtracting the value of the farm input while value added is more about the
intermediates’ input contribution related to the GDP. Moreover, Asmarantaka
(2014) explained that the margin is able to be applied between marketing institution, where it counts the deviation between selling price in a marketing institution and its buying price. On the other hand, the total of Marketing Margin is the result of all marketing margin in each institution level along a marketing channel. In analyzing marketing margin, marketing functions need to be considered, otherwise, the result may mislead to different assumption.
Marketing margin is often used as a criterion for the assessment of whether the market is efficient or not, but the level of marketing margins are not always able to be used as a measure of the efficiency of marketing activities. Low marketing margin is not directly usable as a measurement of efficiency of marketing patter on an agricultural product. The high margins can be caused by various factors that influence the process of marketing activities, such as transportation, storage, management, risk of damage, and others (Limbong and Sitorus, 1987).
Farmer’s Share
Farmer's share is often used as an indicator in looking at the efficiency of marketing activities. Farmer’s share is a ratio of price in the farmer level to price in the consumer or retail level. The amount of the farmer's share is usually influenced by: (1) the level of processing, (2) transportation costs, (3) durability, and (4) the amount of the product.
When the value of farmer's share is high, it is not absolutely indicate that marketing is running efficiently. This relates to the size of the benefit is added to the product (value added) conducted an intermediary institution or processing to meet the needs of consumers. Important factor to consider is not the size but the farmer's share of total revenue earned by the producers from the sale of its products. The higher the marketing margin, the lower the share received by farmers is (Limbong and Sitorus, 1987). Farmer's share has a negative relationship with the marketing margin. So the higher marketing margin, the share received by farmers is getting low. The farmer's share can be written by the following formula:
( )
Description:
FS : Percentage received by farmer Pf : Price in farmer level
Pc : Price in consumer level
Profit and Cost Ratio