STRUCTURAL EQUATION MODELING IN
DETERMINING FACTORS THAT INFLUENCE USER
SATISFACTION OF KRS ONLINE IPB
MARIZSA HERLINA
DEPARTMENT OF STATISTICS
FACULTY OF MATHEMATICS AND NATURAL SCIENCE INSTITUT PERTANIAN BOGOR
THE BACHELOR THESIS STATEMENT AND
SOURCES OF INFORMATION AND COPYRIGHT
DEVOLUTION
I hereby declare that the bachelor thesis entitled Structural Equation Modeling in Determining Factors that Influence Online User Satisfaction of KRS IPB is my work under the guidance of the supervising committee and it has not been submitted in any form to any college. Resources derived or quoted from works published and unpublished from other writers are mentioned in the text and listed in the Bibliography at the end of this bachelor thesis.
I hereby bestow the copyright of my papers to the Bogor Agriculture University.
ABSTRACT
MARIZSA HERLINA. Structural Equation Modeling in Determining Factors that Influence User Satisfaction of KRS Online IPB. Supervised by ASEP SAEFUDDIN and YANI NURHADRYANI.
Nowadays, Information and Communication Technology (ICT) cannot be separated in our lives, it becomes a basic necessity to us whether in daily life and even in organization or institution. Bogor Agricultural University (IPB) as one of the top five universities in Indonesia, uses one of ICT’s form which is Infomation System (IS) Services for their organizational activities. One of the IS Services in IPB is KRS Online IPB. KRS Online IPB is a website that facilitates academic study plan registration for students and it is a very important website for students in IPB. In order to maintain the good quality and the satisfaction of KRS Online, Structural Equation Model is used to analyze the factors that influence satisfaction and the relationship between indicators and construct based on EGOVSAT model. The result shows that utility and flexibility are the factors that influence user satisfaction of KRS Online IPB significantly.
Bachelor Thesis
as one of the requirements to received statistics bachelor degree
in
Department of Statistics
STRUCTURAL EQUATION MODELING IN
DETERMINING FACTORS THAT INFLUENCE USER
SATISFACTION OF KRS ONLINE IPB
MARIZSA HERLINA
DEPARTMENT OF STATISTICS
FACULTY OF MATHEMATICS AND NATURAL SCIENCE INSTITUT PERTANIAN BOGOR
Title : Structural Equation Modeling in Determining Factors that Influence User Satisfaction of KRS Online IPB
Name : Marizsa Herlina
NIM : G14090064
Approved by
Prof. Dr. Ir. Asep Saefuddin, M. Sc Advisor I
Yani Nurhadryani, Ph. D Advisor II
Acknowledged by
Dr. Ir. Hari Wijayanto, M.Si Head of Department
PREFACE
All best praise and regards to Our Mighty God, Allah Subhanahu Wata’ala,
Because of Allah Subhanahu Wata’ala’s bless, this research and bachelor thesis could be done. This research theme is about structural equation modeling in KRS Online IPB and it is conducted from May 2013 until June 2013.
Thank you for Prof. Asep Saefuddin and Yani Nurhadryani, Ph. D as the advisor of this research. Besides I also want to thank you to all of the respondent, and also the contact person in eight departments (from year 2009-2011) in Faculty of Mathematics and Natural Science IPB, without all of you, the data would not be collected and this research could never be done. Also thank you for both of my dearest parents, my siblings, all of my family, all of my friends, statistics 46 and all of the the staff in department of statistics, your support has always been my encouragement. I hope that this research will give a benefit especially for IPB and also for academics.
TABLE OF CONTENTS
TABLE LIST vi
TABLE OF FIGURE vi
TABLE OF APPENDIX vi
INTRODUCTION 1
Background 1
Objectives of The Study 1
METHODOLOGY 2
RESULTS 7
Exploration of the Data 7
Structural Equation Modeling in KRS Online Satisfaction 9
CONCLUSION 13
REFERENCES 14
APPENDIX 15
TABLE LIST
1 The Construct and indicator variables of KRS Online IPB user
satisfaction 2
2 Notation for structural model 3
3 Notation for measurement model 4
4 KRS Online System Suggestions 9
5 Standardized loading factor and t-values for indicators before and
after modification (measurement model) 10
6 Goodness-of-fit measurement model before and after modification 11 7 Estimated path coefficient of construct relationship 12 8 Goodness-of-fit structural model of KRS Online IPB 12 9 Variance extracted and construct reliability values for each construct
in structural model after modification 12
10 Direct effect and indirect effect to satisfaction 13
TABLE OF FIGURE
1 Structural Model of E-government Satisfaction (Horan A et al.
(2006) and Abichandani T et al. (2005)) 2
2 Percentage of respondent based on Semester (a) and Department (b) 7 3 Percentage of students who agree, neutral, disagree in KRS Online
performance satisfaction of each indicators 8
4 Percentage of students who agree, neutral and disagree in each
indicators of emotional satisfaction 8
TABLE OF APPENDIX
1 Percentage of students who agree, neutral, disagree in KRS Online
performance satisfaction of each questions 15
2 Standardized loading factor of structural model for each indicators 16
3 Measurement model before modification 17
4 Measurement model after modification 17
INTRODUCTION
Background
The development of Information and Communication Technology (ICT) is increasing rapidly in the past 10 years and it also brings significant impact in our daily life. ICT may increase the efficiency and effectivity of institutional management. Information system (IS) is a combination among people, hardware, software, communication networks, data resources, policies and procedures that stores, retrieves, transforms, and disseminates information in organization. In theory, IS can be a paper based, but now ICT is taking part of the IS. IS is all the components and resources necessary to deliver information and functions to the organization while ICT is the hardware, software, networking and data management, so it becomes Computer-based Information System. Bogor Agricultural University (IPB) also uses Computer-based information system for organizational activities.
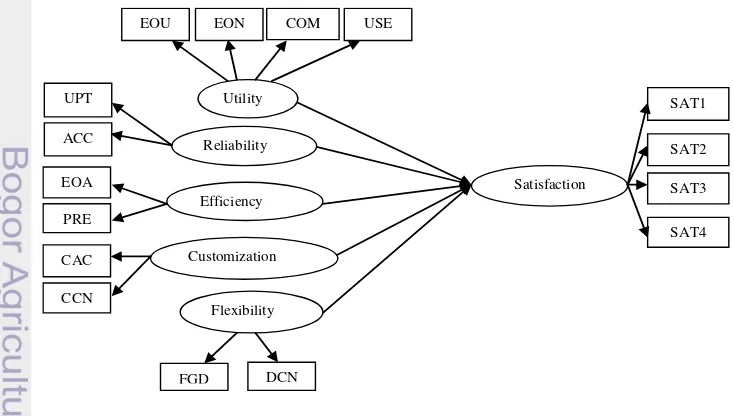
The Computer-based IS in Bogor Agricultural University is managed by Direktorat Komunikasi dan Sistem Informasi (DKSI) IPB. DKSI IPB provides IS services in Bogor Agricultural University. One of the IS services that has been very popular is Kartu Rencana Studi (KRS) Online. KRS Online is a website that allows students to fill their study plan by choosing the course that they planned to take in current semester. Students have to fill their study plan between the period time given by IPB, usually before (KRS A) and one week after (KRS B) the new semester begins. Because all of the students are required to fill their study plan by using KRS Online, KRS Online is considered as the most important website for all the students in IPB so it needs good maintenance in order to keep the students (users) satisfied. In order to maintain the best quality and performance of KRS Online in IPB, continuous evaluation is required. The evaluation of the services can be interpreted by measuring the user satisfaction of the services. Horan A et al.(2006) stated that they have defined the list of indicators to measure user satisfaction on e-government initiatives which is similar to KRS Online in IPB. The indicators are utility, reliability, efficiency, customization, and flexibility. These five variables is used as the latent variables in this study. User emotional composition of satisfaction is also defined by pleasantness, frustrated, and confidence. In order to know both the factors that influence user satisfaction and the relationship between them, Structural Equation Modeling is implemented. Hair et al.(2010) stated that Structural Equation Modeling (SEM) is a family of statistical models that seek to explain the relationships among multiple variables. The researcher used SEM to explain the causal relationship between latent and measured variables and also between latent variables to see which factors influence user satisfaction.
Objectives of The Study
2
METHODOLOGY
The procedures of this study are:
1. Defining the variables (construct and indicators) based on theory of the previous study, i.e utility, reliability, efficiency, customization, flexibility, and satisfaction (Table 1). Based on Hair et al. (2010) Construct is a variable that cannot be observed directly so it will be measured by indicators or
construct Indicator variables Item name
Notation
Exogen Efficiency Ease of Access Presentation
EOA PRE
x7
x8
Exogen Customization Customized Access Customized Content
CAC CCN
x9
x10
Exogen Flexibility Flexibility Guidance Dynamic Content
3 The model in Figure 1 is a combined model from Horan A et al. (2006) and Abichandani T et al. (2005). Satisfaction is the dependent factor in this study while utility, reliability, Efficiency, customization, and flexibility are performance construct that considered to be the factor that influences satisfaction positively.
In the measurement model, Confirmatory Factor Analysis is used, Kusnendi (2008) stated that the main goal of CFA is to confirm or test the measurement model which is formulated based on a theory. Path analysis is used in the structural model, path analysis will show the strength of path or relationship between construct (Hair et al. 2010). The overall structural model used in this study can be seen in Figure 1. The Structural Equation for Structural Model (Bollen 1989):
Assumptions:E( ) = 0, E( ) = 0, E( ) = 0; uncorrelated with and (I-B) non singular. The definition of notation can be seen in table 2.
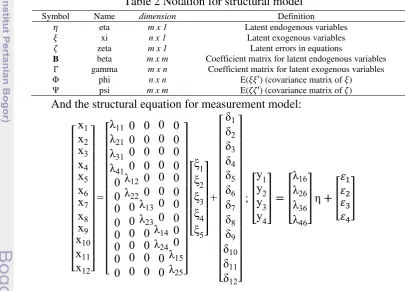
Table 2 Notation for structural model
And the structural equation for measurement model:
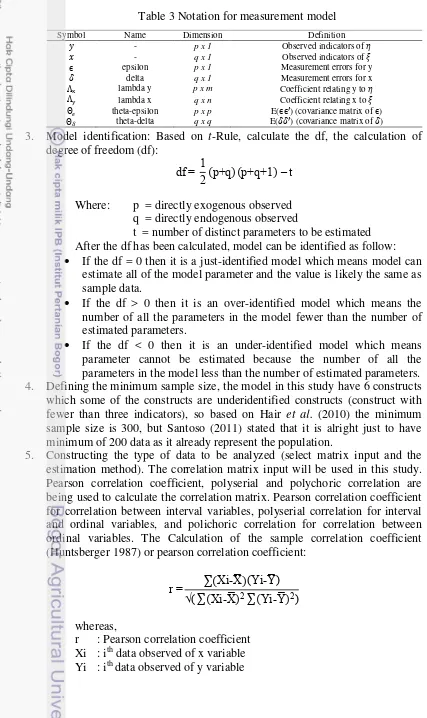
[
Symbol Name dimension Definition
eta m x 1 Latent endogenous variables
xi n x 1 Latent exogenous variables
zeta m x 1 Latent errors in equations
B beta m x m Coefficient matrix for latent endogenous variables gamma m x n Coefficient matrix for latent exogenous variables
Φ phi n x n E( ) (covariance matrix of )
4
Table 3 Notation for measurement model
3. Model identification: Based on t-Rule, calculate the df, the calculation of degree of freedom (df):
df p q p q t
Where: p = directly exogenous observed q = directly endogenous observed
t = number of distinct parameters to be estimated After the df has been calculated, model can be identified as follow: If the df = 0 then it is a just-identified model which means model can
estimate all of the model parameter and the value is likely the same as sample data. parameters in the model less than the number of estimated parameters. 4. Defining the minimum sample size, the model in this study have 6 constructs which some of the constructs are underidentified constructs (construct with fewer than three indicators), so based on Hair et al. (2010) the minimum sample size is 300, but Santoso (2011) stated that it is alright just to have minimum of 200 data as it already represent the population.
5. Constructing the type of data to be analyzed (select matrix input and the estimation method). The correlation matrix input will be used in this study. Pearson correlation coefficient, polyserial and polychoric correlation are being used to calculate the correlation matrix. Pearson correlation coefficient for correlation between interval variables, polyserial correlation for interval and ordinal variables, and polichoric correlation for correlation between ordinal variables. The Calculation of the sample correlation coefficient (Huntsberger 1987) or pearson correlation coefficient:
r ∑ Xi X̅ Yi Y̅ ∑ Xi X̅ ∑ Yi Y̅
whereas,
r : Pearson correlation coefficient Xi : ith data observed of x variable Yi : ith data observed of y variable
Symbol Name Dimension Definition
5
̅ : Sum of observed data x per sample size
̅ : Sum of observed data y per sample size
In order to know that the estimation is close as possible, we need a minimized function, the estimation method will be Unweighted Least Square (ULS) fitting function (Bollen 1989):
U S ( )tr[(S ) ]
S is the sample covariance matrix and ∑ is the implied covariance
matrix. As in OLS the sum of square is minimized, minimize each element of the residual matrix sum of square and this leads to a consistent
estimator of .
6. Making questionnaire based on the defined variables. In this research, the content of the questionnaire is adopted from a research about e-government satisfaction by Abichandani et al. (2005). There are two types of questionnaire, online and offline questionnaire. The online questionnaire is made by using google drive questionnaire form and sent via email or social media straight to the respondent. The offline questionnaire is just using usual paper and the questionnaire paper was sent straight to the respondent. The questionnaire can be seen in appendix 6.
7. Choosing the respondents using simple random sampling. Faculty of Mathemathics and Natural Sciences IPB which includes eight departments i.e Statistics, Geophysics and Meteorology, Biology, Chemistry, Mathematics, Computer Science, Physics, and Biochemistry is the biggest stakeholder in IPB since it has most students than any other faculties in IPB, so the researcher decides to conduct the research in Faculty of Mathematics and Natural Science IPB. The population in this research is KRS Online Users (students) in Faculty of Mathematics and Natural Sciences IPB in the year of 2009-2011, only students enroll in the year of 2009-2011 in IPB who have been using KRS Online when this research is conducted.
8. Distributing the questionnaire to the respondents.
9. Collecting and exploring the data using descriptive statistics.
10. After sufficient data is collected, then estimate the parameter model.
11. Assessing measurement model validity. If the measurement model is valid, then test the structural model. If the measurement model is not valid then revise the measures and design a new study. The validity of measurement model depends on goodness of fit of the model and constructs validity. Goodness of fit is used to indicate how similar covariance matrix of the sample data and covariance matrix from the model estimation are. The goodness of fit used in this study are:
Root Mean Square Error (RMSEA)
MS A √
6 indicates a better fit model (Hair et al. 2010).
Goodness of Fit Index (GIF)
G IU S
tr[ S ∑̂ ]
tr S
GFI’s value greater than 0.90 are already considered as a good fit model and higher values of GFI means better fit model (Hair et al. 2010).
Adjusted Goodness of Fit Index (AGFI)
AG IU S [q df q ] [ G IU S]
The reliability of construct defined by (Kusnendi 2008): Construct Reliability (CR):
: ith indicator’s standardized loading factor ei : ithindicator’s measurement error
7 CR’s value greater than 0.70 and or variance extracted values greater than 0.50 indicates that the indicator simultaneously reliable to measure the construct (latent variables) (Hair et al. 2010 in Kusnendi 2008).
12. Specifying the structural model (convert the measurement model to structural model).
13. Assessing structural model validity. If the structural model is valid then draw substantive conclusions and recommendations, if the structural model is not valid then revised the model.
RESULTS
Exploration of the Data
There are 1914 students who enroll in Faculty of Mathematics and Natural Science in year of 2009-2011. By implementing simple random sampling, 400 students has been chosen as the respondent, but only 248 students give a response to fill in the questionnaire. Figure 2.a. explain that the students in the 6th semester has the highest percentage (37%) while the rests are almost similar, it means the questionnaires are quite fair distributed. Figure 2.b. shows that Chemistry Department has the highest percentage of respondents (16%) from the total sample and it also shows just a slight difference between the eight departments, so based on departments, the questionnaires are also quite fair distributed. Most of the respondents is female (62%).
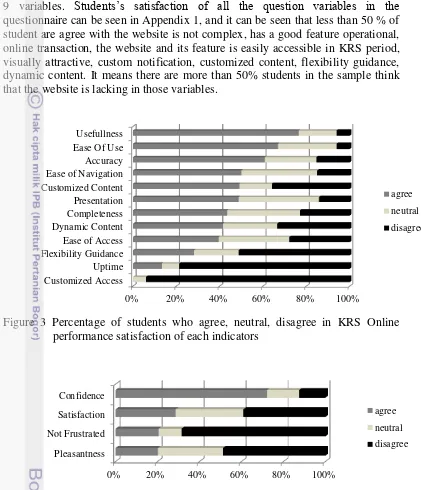
8
Navigation to Customized Access which the agree rate is less than 50%, it means less than 50% student in the sample is not satisfied with the performance in those 9 variables. Students’s satisfaction of all the question variables in the questionnaire can be seen in Appendix 1, and it can be seen that less than 50 % of student are agree with the website is not complex, has a good feature operational, online transaction, the website and its feature is easily accessible in KRS period, visually attractive, custom notification, customized content, flexibility guidance, dynamic content. It means there are more than 50% students in the sample think that the website is lacking in those variables.
Figure 3 Percentage of students who agree, neutral, disagree in KRS Online performance satisfaction of each indicators
Figure 4 Percentage of students who agree, neutral and disagree in each indicators of emotional satisfaction
Figure 4 shows that most of the students agree to confidence in using KRS Online (72.2%), it means that 72.2% of total sample confidence using the website because they feel save when their KRS Online are already filled. It also shows that 68.5 % of total sample frustrated in using the KRS Online, this probably because of the difficult access to KRS Online in the period of KRS Online itself. Most of the students disagree in pleasantness (48.8%) and it means that 48.8% of the sample having an unpleasant experience while using KRS Online. Less than 30 %
9 students in the sample agree with satisfaction, not frustrated, and pleasantness, it means more than 70% student do not feel satisfy with the KRS Online system.
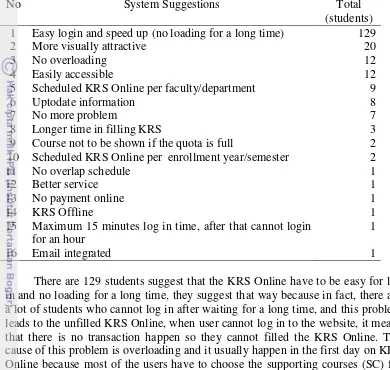
Table 4 KRS Online System Suggestions
No System Suggestions Total
(students) 1 Easy login and speed up (no loading for a long time) 129
2 More visually attractive 20
3 No overloading 12
4 Easily accessible 12
5 Scheduled KRS Online per faculty/department 9
6 Uptodate information 8
7 No more problem 7
8 Longer time in filling KRS 3
9 Course not to be shown if the quota is full 2
10 Scheduled KRS Online per enrollment year/semester 2
11 No overlap schedule 1
12 Better service 1
13 No payment online 1
14 KRS Offline 1
15 Maximum 15 minutes log in time, after that cannot login for an hour
1
16 Email integrated 1
There are 129 students suggest that the KRS Online have to be easy for log in and no loading for a long time, they suggest that way because in fact, there are a lot of students who cannot log in after waiting for a long time, and this problem leads to the unfilled KRS Online, when user cannot log in to the website, it means that there is no transaction happen so they cannot filled the KRS Online. The cause of this problem is overloading and it usually happen in the first day on KRS Online because most of the users have to choose the supporting courses (SC) for completing their credits to graduate. SC can be freely taken by any students and has a limited quota so the students have to choose and take the SC as fast as possible before the quota is full, some students who are late to fill the KRS Online has to give up and ended picks a courses that they do not want because they have no choice. So the “cannot log in” problem and “long time loading” problem basically a critical problem needs to be solved in order to help the students fill their KRS Online. The students also suggest some feature that need to be included in the website such as course description, help centre, etc (Appendix 2).
Structural Equation Modeling in KRS Online Satisfaction
10
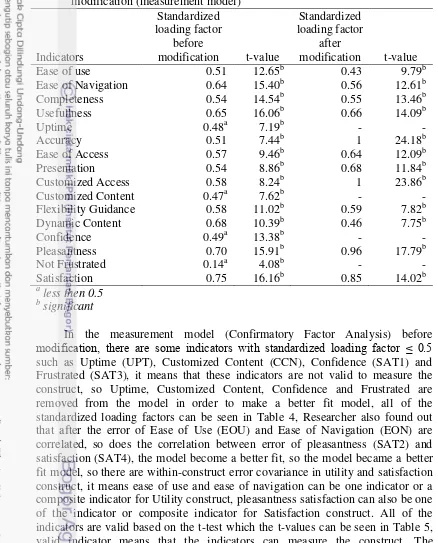
Table 5 Standardized loading factor and t-values for indicators before and after modification (measurement model)
Flexibility Guidance 0.58 11.02b 0.59 7.82b
Dynamic Content 0.68 10.39b 0.46 7.75b
In the measurement model (Confirmatory Factor Analysis) before
modification, there are some indicators with standardized loading factor ≤ .
such as Uptime (UPT), Customized Content (CCN), Confidence (SAT1) and Frustrated (SAT3), it means that these indicators are not valid to measure the construct, so Uptime, Customized Content, Confidence and Frustrated are removed from the model in order to make a better fit model, all of the standardized loading factors can be seen in Table 4, Researcher also found out that after the error of Ease of Use (EOU) and Ease of Navigation (EON) are correlated, so does the correlation between error of pleasantness (SAT2) and satisfaction (SAT4), the model become a better fit, so the model became a better fit model, so there are within-construct error covariance in utility and satisfaction construct, it means ease of use and ease of navigation can be one indicator or a composite indicator for Utility construct, pleasantness satisfaction can also be one of the indicator or composite indicator for Satisfaction construct. All of the indicators are valid based on the t-test which the t-values can be seen in Table 5, valid indicator means that the indicators can measure the construct. The measurement model before and after modification can be seen in Appendix 4 and Appendix 5.
11 covariance matrix than before modification model. The value of RMSEA, RMR, GFI and AGFI is in the criteria of a good fit model, which means the estimated covariance matrix is close fit to the observed covariance matrix.
Table 6 Goodness-of-fit measurement model before and after modification
Goodness-of-fit
Good fit criteria based on Hair et
al. (2010)
Values before modification
Values after modification
RMSEA < 0.080 0.112 0.049*
RMR ≤ . 0.076* 0.059* GFI ≥ . 0.960* 0.980*
AGFI ≥ . 0.930* 0.950*
*good fit
Figure 5 Structural model of KRS Online IPB
12
Table 7 Estimated path coefficient of construct relationship Relationship between exogen to
endogen contruct
Estimated path
coefficient t-value Conclusion Flexibility to Satisfaction 0.96 1.96 Significant Utility to Satisfaction 0.24 0.28 Not Significant Realibility to Satisfaction -0.15 -0.86 Not significant Efficiency to Satisfaction -0.34 -0.30 Not significant Customization to Satisfaction -0.07 -0.36 Not significant
The negative relationship can happen because in the case of KRS Online, most of the user score the reliability quite high, but when they score the satisfaction is not as high as the reliability score, as for the case of customization, most of the users score customization really low and they score the satisfaction so-so (not too high and not too low), not as low as the customization and it is the same case for efficiency. Based on the phenomenon happen in KRS Online, researcher assumed that there is another indicator that needs to be added in efficiency construct which is speed of the system, because most of the student complained that KRS Online is low for its system speed that caused by the lack of server and overflowing user who access KRS Online at the same time, so most of the student is not satisfied with the system. RMSEA, RMR, GFI, and AGFI shows a good fit value for the model as it can be seen in Table 8.
Table 8 Goodness-of-fit structural model of KRS Online IPB Goodness-of-fit (GOF)
Reability 1.00 reliable 1.00 reliable
Customization 1.00 reliable 1.00 reliable
Satisfaction 0.86 reliable 0.92 reliable
Utility 0.31 not reliable 0.64 not reliable
Efficiency 0.44 not reliable 0.61 not reliable Flexibility 0.28 not reliable 0.43 not reliable
Table 9 shows that utility’s, efficiency’s, and flexibility’s construct
reliability values ≤ . it means that those construct are not reliable. The
13
efficiency, and customization ≤ . . It means that the indicators in utility’s, efficiency’s, and flexibility’s construct are also not individually reliable to
measure the construct itself, and vice versa for reliability, customization, and satisfaction.
From Table 10 It is shown that satisfaction is influenced by flexibility positively as much as 0.9216 and flexibility indirectly influenced satisfaction because it relationship with realibility, efficiency, customization, and utility as much as 0.219 so the total effect of flexibility influenced satisfaction is 0.7026 which is the highest total effect of the model. Utility influenced satisfaction as much as 0.0576 and and indirectly utility influenced satisfaction because it relationship with realibility, efficiency, customization, and flexibility as much as 0.0212, so total effect of utility influenced satisfaction is 0.0788. Efficiency influenced satisfaction negatively as much as 0.1156 and effected by it relationship with utility, reliability, customization, and flexibility, it also influenced satisfaction indirectly as much as -0.2668 so the total effect of reliability influenced satisfaction is -0.1512. Realibility and customization influenced satisfaction negatively respectively as much as 0.0225 and 0.044 also because it relationship with each other construct, reliability and customization indirectly influenced satisfaction as much as -0.0618 and -0.0393 respectively, so the total effect of reliability and customization influenced satisfaction are -0.0393 and -0.02.
Table 10 Direct effect and indirect effect to satisfaction
Relationship between construct
After the structural model is modified flexibility are proved to be the factors that influence the satisfaction significantly based on Faculty of Mathematics and
14
performance, especially their flexibility which includes flexibility guidance and dynamic content to improve the user satisfaction in KRS Online IPB.
REFERENCES
Abichandani T, Horan TA, Rayalu R. 2005. EGOVSAT: Toward a Robust Measure of E-Government Service Satisfaction in Transportation. Inside: Remeyi D, editor. International Conference on e-Government; 2005 October 27-28; Ottawa, Canada. London (UK): Academic Conferences Limited.
Bollen KA. 1989. Structural Equations with Latent Variables. Canada (US): John Wiley & Sons, Inc.
Hair JF, Black WC, Babin BJ, Anderson RE. 2010. Multivariate Data Analysis 7th Edition. New Jersey (US): Prentice Hall.
Horan TA, Abhichandani T. 2006. Evaluating User Satisfaction in an E-Government Initiative: Results of Structural Equation Modeling and Focus Group Discussing. Virginia (US): Maximilian Press Publishing Company. Huntsberger DV, Billingsley P. 1987. Elements of Statistical Inference Sixth
Edition. Massachusetts (US): Allyn and Bacon, Inc.
Kusnendi. 2008. Model – Model Persamaan Struktural Satu dan Multigroup Sampel dengan Lisrel. Bandung (ID): ALFABETA, cv.
Santoso S. 2011. Structural Equation Modeling. Jakarta (ID): PT Elex Media Komputindo.
Appendix 1 Percentage of students who agree, neutral, disagree in KRS Online performance satisfaction of each questions
0% 10% 20% 30% 40% 50% 60% 70% 80% 90% 100%
disagree
neutral
agree
16
Appendix 2 KRS Online Feature Suggestions
No Feature Suggestions Total
(students) 1 Course description (course description, to be taken in what
semester, total class, books and lecturer)
23
2 Help center (online chatting, phone call) 20
3 Course reccomendation to be taken in the current semester
7 Minor/SC reccommendation 5
8 Total of cumulative credits 4
9 Online consultation with Academic advisor 3
10 Exams schedule 2
11 Chatting with other user 2
12 Midterm score, final exams score, laboratorium score 2
13 Course coordinator email 1
14 Profile photo 1
15 Recapitulation of payment 1
16 Suggestion box 1
17 Confirmation of payment 1
18 Print transcript 1
19 Phone notification 1
20 Total online user 1
21 How to pay 1
22 KRS integrated with EPBM 1
23 The course that has been completed doesn’t have to be shown 1
24 Scholarship information 1
25 Course search based on day and time 1
Appendix 3 Standardized loading factor of structural model for each indicators Indicators
Customized Access 1 23.01
Flexibility Guidance 0.59 8.19
Dynamic Content 0.46 8.21
Pleasantness 0.98 7.83
17 Appendix 4 Measurement model before modification
18
Appendix 6 User Satisfaction of KRS Online Questionnaire
KUISIONER KEPUASAN MAHASISWA DALAM
PENGGUNAAN KARTU RENCANA STUDI ONLINE
IPB
No Responden : (diisi oleh pewawancara)
Tanggal Pengisian :
BIODATA RESPONDEN
NIM :
Semester :
Jenis Kelamin : (1) Laki-laki (2) Perempuan Fakultas dan Departemen :
Program Studi yang sedang dijalani di IPB :
Apakah pernah mengisi KRS Online? (1) Ya (2) Tidak Contoh Tingkat Kesetujuan:
1 2 3 4 5 6 7 Tidak Setuju Setuju
Di bawah ini ada beberapa pernyataan tentang KRS Online IPB, lingkari nomor yang paling sesuai dengan pendapat anda.
No. Pernyataan Tingkat Kesetujuan
Ease of Use (Kemudahan Penggunaan Website)
1 Saya mengganggap KRS Online mudah
digunakan 1 2 3 4 5 6 7
2 Saya menganggap KRS Online kompleks
(rumit) 1 2 3 4 5 6 7
3
Saya memerlukan bantuan teknis (download driver, software, dll) untuk menggunakan KRS Online
1 2 3 4 5 6 7
4
Saya perlu mempelajari tentang KRS Online terlebih dahulu baru bisa menggunakan KRS Online dengan lancar
1 2 3 4 5 6 7
5 Saya menganggap penggunaan KRS
Online sulit dipahami 1 2 3 4 5 6 7
6 Mahasiswa dapat mempelajari cara
menggunakan KRS Online dengan cepat 1 2 3 4 5 6 7
7
Saya dapat menggunakan banyak fitur
(memilih mata kuliah, melihat jadwal kuliah, melihat nilai, dll) di KRS Online dengan mudah
1 2 3 4 5 6 7
Ease of Navigation (Kemudahan Petunjuk Website)
8
Saya dapat berpindah ke berbagai fitur (memilih mata kuliah, melihat jadwal, melihat nilai, melihat total biaya SPP) dengan mudah
1 2 3 4 5 6 7
9
Saya mengalami kesulitan ketika mengoperasikan suatu fitur (memilih mata kuliah serta jadwal dan ruang kuliahnya)
1 2 3 4 5 6 7
19
10
Saya merasa informasi yang diberikan sudah lengkap untuk mengisi KRS Online (daftar mata kuliah, kuota mahasiswa, jadwal dan ruang kuliah)
1 2 3 4 5 6 7
11
Saya dapat melakukan transaksi pembayaran SPP di KRS Online (via kartu kredit, ATM/transfer, e-banking)
Saya merasa setiap langkah (login, jumlah SKS, kuota mata kuliah) berguna sebelum mengisi KRS Online disajikan oleh website KRS Online akurat (dapat dipercaya)
1 2 3 4 5 6 7
17
Saya merasa informasi dari fitur pemilihan mata kuliah di KRS Online sudah sesuai dengan keperluan pengisian KRS (misal. Informasi kuota mahasiswa dibutuhkan untuk memilih matkul)
1 2 3 4 5 6 7
Ease of Access (Kemudahan Mengakses Isi Website)
18
Saya menganggap fitur yang penting dalam pengisian KRS Online mudah digunakan periode pengisian KRS Online
1 2 3 4 5 6 7
Saya menganggap bahwa isi/konten website KRS Online terstruktur dengan baik
1 2 3 4 5 6 7
21 Saya bingung karena website menyediakan
terlalu banyak informasi 1 2 3 4 5 6 7
22 Saya menganggap desain website menarik
secara visual 1 2 3 4 5 6 7
Customized Access (Kostumisasi Akses Website)
23
Saya dapat mengakses informasi sesuai dengan cara yang saya inginkan (lewat handphone/laptop/PC) pada waktu yang saya inginkan
1 2 3 4 5 6 7
24
Saya dapat memilih untuk dikirimkan pemberitahuan (notification) tentang KRS Online (contoh: pemberitahuan pengumuman pengisian KRS lewat email/hp)
20
Customized Content (Kostumisasi Konten Website)
25
KRS Online menyediakan informasi tentang mata kuliah apa saja yang dianjurkan untuk diambil semester ini
1 2 3 4 5 6 7
Flexibility Guidance (Fleksibilitas Bantuan untuk Operasional Website)
26
Saya dapat menghubungi administrator KRS Online untuk meminta bantuan dalam menggunakan KRS Online (contoh: adanya telepon khusus yang bisa dihubungi atau tempat pelayanan KRS Online)
1 2 3 4 5 6 7
Dynamic Content (Konten Dinamis)
27
Isi/konten (misal: daftar mata kuliah, jadwal dan ruangan kuliah serta jumlah kuota mata kuliah yang tersisa) yang ada dalam website selalu up-to-date dengan informasi terbaru
1 2 3 4 5 6 7
Satisfaction (Kepuasan terhadap Website)
28
Saya merasa aman setelah menggunakan KRS Online (misal: merasa lega/aman setelah mendapat mata kuliah yang diinginkan di KRS)
1 2 3 4 5 6 7
29
Saya mengalami pengalaman yang menyenangkan saat menggunakan KRS Online
1 2 3 4 5 6 7
30 Terkadang KRS Online membuat saya
frustasi 1 2 3 4 5 6 7
31 Saya puas dengan KRS Online 1 2 3 4 5 6 7
Fitur/fungsi apa yang menurut anda penting untuk ditambahkan pada website KRS Online:
Saran untuk perbaikan website KRS Online IPB:
Isilah pertanyaan di bawah ini di dalam kotak yang diberikan:
21
BIOGRAPHY
The author was born in Garut, West Java on March 26, 1992 as the second child of Dadi Adam H. and Ida Farida S. M. couple. The author began her education in Asri kindergarten and continue to Bina Insani Bogor Elementary School in 1997, then she moved to Cipta Dharma Denpasar Elementary School in 2004, graduated from elementary school of Cipta Dharma, the author continued her education at SMP 9 Denpasar, then the 2nd year, author moved to SMPN 5 Bandung and in the 3rd year of junior high school, the author moved to SMPN 1 Bogor. Graduated from SMPN 1 Bogor in 2006, the author continued his education to SMAN 5 Bogor. After graduating from SMAN 5 Bogor in 2009, author directly continue her education to a higher level, the author is accepted in the Department of Statistics, Institut Pertanian Bogor via USMI.