www.elsevier.nlrlocateraqua-online
Replacement of fish meal in diets for Australian
silver perch, Bidyanus bidyanus
V. Least-cost formulation of practical diets
G.L. Allan
a,), S.J. Rowland
b, C. Mifsud
b, D. Glendenning
a,
D.A.J. Stone
a, A. Ford
ca
NSW Fisheries, Port Stephens Research Centre, Taylors Beach, NSW, 2316, Australia
b
NSW Fisheries, Grafton Research Centre, Locked Bag 3, Grafton, NSW, 2460, Australia
c
Centre for Food Technology, QDPI, 19 Hercules St., Hamilton, Qld, 4007, Australia
Accepted 30 November 1999
Abstract
Ž . y1
Silver perch fingerlings 80.7"1.2 g were stocked at a density of 15,000 fish ha in earthen
Ž . y1
ponds 0.1 ha and cultured for six months to a market size of )350 g fish . Fish were fed a
Ž .
reference diet SP35; 27% fish meal or one of two test diets formulated using a least-cost linear feed formulation program and digestibility coefficients for a range of Australian agricultural
Ž . Ž . Ž .
products meat meal and plant proteins . In the test diets, all but 5% 95LC2 or 10% 95LC1 of
Ž .
the fish meal was replaced. Survival was high )95% in all ponds. There was no significant difference between the performance of silver perch fed the two test diets. The mean weights
Ž . Ž y1. Ž .
431.9 g and 439.8 g , daily growth rates 2.5 g fish and FCRs 2.0 and 1.9 of fish fed 95LC1
Ž . Ž .
and 95LC2, respectively, were significantly different P-0.05 from the weight 395.4 g , daily
Ž y1 y1. Ž .
growth 2.2 fish day and FCR 2.2 of fish fed SP35. The diet ingredient cost to produce 1 kg fish was significantly lower for 95LC2 than the costs of the other diets AUD$:1.06 vs. 1.52;
Ž .
P-0.05. Diet did not significantly affect body composition nitrogen, fat, ash or energy or sensory quality of the fish. These results show that least-cost diets containing meat meal and plant
Ž .
proteins as replacements for all but 5% fish meal are suitable for silver perch grown to market size in earthen ponds.q2000 Elsevier Science B.V. All rights reserved.
Keywords: Bidyanus bidyanus; Nutrition; Least-cost; Fish meal replacement
)Corresponding author. Tel.:q61-249-821232; fax:q61-249-821107.
Ž .
E-mail address: [email protected] G.L. Allan .
0044-8486r00r$ - see front matterq2000 Elsevier Science B.V. All rights reserved. Ž .
1. Introduction
Silver perch is an omnivorous, native Australian, freshwater finfish with high
Ž .
potential for aquaculture Rowland and Barlow, 1991 . They readily accept pelleted Ž
diets, tolerate crowded conditions and perform well in earthen ponds Rowland et al., .
1994, 1995 . Large-scale commercial culture depends on the development of cost-effec-tive diets. The major constraints in formulating cost-effeccost-effec-tive diets are a lack of information on nutritional requirements of fish and the digestibility of suitable feed
Ž .
ingredients Tacon, 1994; McGoogan and Reigh, 1996 . While a large number of fish species are cultured throughout the world, only the nutritional requirements of rainbow
Ž .
trout and channel catfish, have been extensively studied Lall, 1991 . One of the consequences of this lack of information is a heavy reliance on high-quality fish meal as
Ž .
a protein base for most intensively farmed aquaculture species Lovell, 1989 .
Unfortunately, more than 90% of the fish meal used in animal feeds in Australia is
Ž .
imported ABARE, 1998 . However, large quantities of agriculture protein sources are
Ž Ž ..
produced locally Allan et al., in press a .
Although there is little information on nutritional requirements of silver perch, data for other species, especially other omnivorous species such as channel catfish and
Ž . Ž
tilapia, were used to formulate an experimental diet for silver perch SP35 Allan and
. Ž y1 y1.
Rowland, 1992 . This diet has produced fast growth )2 g fish day and high
Ž y1 y1 y1. Ž
production ;10 t ha yr in large-scale farming experiments Rowland, 1995a; .
Rowland et al., 1994, 1995 and forms the basis for several commercially manufactured diets now available to the industry. Additional nutritional research with silver perch has evaluated a large number of Australian agricultural protein sources for use in formulated diets. This evaluation has included the determination of digestibility coefficients for dry matter, energy, nitrogen, amino acids and phosphorus for approximately 60 ingredients,
Ž Ž ..
including some processed in different ways Allan et al., in press b . Growth studies to determine maximum inclusion levels for several protein sources considered to have high
Ž
potential to replace fish meal have also been completed Allan et al., 1999; in press Ž . Ž .a , b ; Allan et al., unpublished data ..
Some knowledge of nutritional requirements, information on digestibility coefficients for a wide range of ingredients, and data on the maximum inclusion levels for key ingredients provides the basis for the use of least-cost programming to formulate diets ŽCho and Kaushik, 1985; NRC, 1993 ..
In this experiment we evaluated the performance and sensory properties of silver
Ž .
perch fed diets with minimal fish meal 5 or 10% , containing Australian agricultural ingredients selected on a least-cost basis using data on ingredient digestibility and
Ž Ž . Ž .
maximum inclusion levels from previous research Allan et al., 1999; in press a , b ; .
Allan et al., unpublished data . The two ‘‘least-cost’’ or test diets, which differed in fish meal content and nutrient specifications, were compared with a commercially available
Ž . Ž .
2. Materials and methods
2.1. Experimental diets
The test diets were formulated using the linear least-cost computer program
‘‘Feed-Ž .
mania’’ Mania Software, Brisbane, Australia . With least-cost diet formulation, nutrient Ž
concentrations and ingredient contents are specified minimum andror maximum levels .
or unrestricted and then the cheapest mix of ingredients to supply the specified nutrients
Ž .
are selected. For the least-cost diets formulated for this study 95LC1 and 95LC2 , nutrients were specified in relation to the available nutrient profile in the successful SP35. We intended 95LC1 to be similar in nutrient profile to the successful SP35 reference diet. Fish meal content was set at 10% and minimum digestible protein, energy, essential amino acids and phosphorous and linolenic series fatty acids were restricted to within about 5% of the concentrations in SP35. In contrast, we relaxed specifications for 95LC2 to achieve a cheaper formulation. Fish meal was set at 5% and minimum digestible protein, energy, essential amino acids and phosphorous and linolenic series fatty acids were restricted to within 15% of the concentrations in SP35. Peanut and canola meals were excluded from 95LC1 and restricted to 5% in 95LC2. Ingredients and composition of the experimental diets are shown in Tables 1 and 2. Ingredient prices were obtained from NSW Agriculture, Sydney Retail Feed Ingredient Prices or directly from ingredient suppliers or feed manufacturers. They do not include freight charges, although clearly all feed mills will have to pay costs of freight for some ingredients.
The least-cost diets, 95LC1 and 95LC2, were manufactured by Ridley Agriproducts ŽNarangbar, Qld, Australia . The diets were ground to. F500 mm particle size, steam
Ž conditioned and were manufactured to give 3 or 6 mm diameter sinking pellets Table
. Ž .
1 . The control diet, SP35 Diet 1, Table 1 was a commercial diet, widely used by
Ž .
industry, and was manufactured by Janos Hoey Forbes, NSW, Australia using a pellet press, without steam conditioning, and was also pressed into 3 or 6 mm diameter sinking pellets.
2.2. Experimental fish
Ž .
Silver perch Bidyanus bidyanus were artificially bred at the Grafton Research Centre and the fingerlings were raised in earthen ponds using techniques described by
Ž . Ž .
Rowland 1995a and Thurstan and Rowland 1995 . Before the experiment, fingerlings were fed SP35 and treated with 5 g ly1 NaCl for 5 days to ensure they were free of
Ž .
ectoparasites and to prevent fungal infection Rowland and Ingram, 1991 . Immediately
Ž y1.
prior to stocking, fish were anaesthetised using ethyl r-aminobenzoate 20 mg l , weighed and distributed among the nine ponds by systematic interspersion. A total of 1
Ž . Ž y1.
500 silver perch mean weight 80.7 g were stocked density of 1500 fish ha into
Ž .
each 0.1 ha earthen pond Table 3 . Three replicate ponds were used for each diet.
2.3. Experimental facilities and procedures
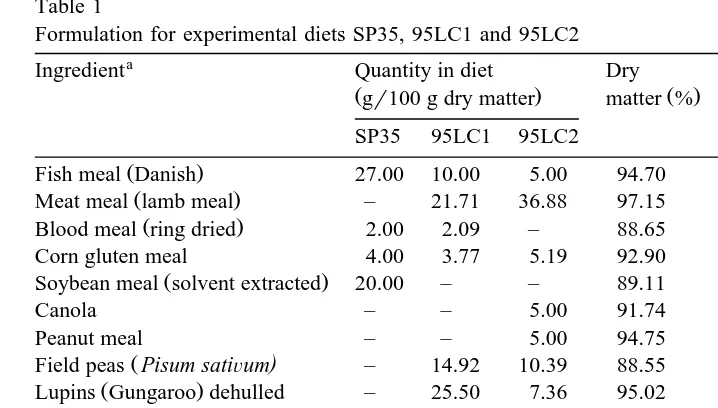
Table 1
Formulation for experimental diets SP35, 95LC1 and 95LC2
a b
Ingredient Quantity in diet Dry Protein Assumed cost
Žgr100 g dry matter. matter %Ž . content %Ž . ŽAUD$rt.
SP35 95LC1 95LC2
Ž .
Fish meal Danish 27.00 10.00 5.00 94.70 65.86 1500
Ž .
Meat meal lamb meal – 21.71 36.88 97.15 52.75 325
Ž .
Blood meal ring dried 2.00 2.09 – 88.65 85.32 800
Corn gluten meal 4.00 3.77 5.19 92.90 57.68 700
Ž .
Soybean meal solvent extracted 20.00 – – 89.11 45.55 479
Canola – – 5.00 91.74 40.00 295
Peanut meal – – 5.00 94.75 39.00 325
Ž )
Field peas Pisum satiÕum – 14.92 10.39 88.55 24.44 350
Ž .
Lupins Gungaroo dehulled – 25.50 7.36 95.02 43.61 350
Wheat 26.85 – – 90.78 13.70 180
Sorghum 11.00 4.70 – 89.59 14.62 180
Millrun 2.00 10.00 17.70 89.67 19.62 150
Ž .
Fish oil cod liver oil 1.00 2.91 3.21 100.00 – 800
DL-methionine 0.15 0.40 0.27 100.00 78.60 5120
c d
Vit rmin premix 4.00 4.00 4.00 100.00 – 4000
Di-Calcium phosphate 2.00 – – 100.00 – 610
a
More information on the ingredients used here, including details of processing, nutrient composition and
Ž . Ž .
digestibility are given in Allan et al., 1999; in press a , b . b
Based on prices published by NSW Agriculture, Sydney Retail Feed Ingredient Prices, NSW Agriculture,
.
Orange, NSW, 2800, Australia , or from commercial feed manufacturers, 1998. c
ŽIUrkg diet : retinol A , 8000; cholecalciferol D3 , 1000;. Ž . Ž . a-tocopherul acetate E , 125; mgŽ . Ž rkg diet :.
Ž . Ž .
ascorbic acid C , 1000; biotin 2% , 1; calcium pantothenate, 55; calcium propionate, 250; choline chloride,
Ž . Ž .
1500; cyanocobalamin B12 , 0.02; ethoxyquin, 150; folic acid, 4; menadione sodium bisulphite K3 , 16.5;
Ž . Ž . Ž .
myo-inositol, 600; nicotinamide, 200; pyridoxine B6 , 15; riboflavin B2 , 25.2; thiamin HCl B6 , 10.
dŽ .
Mgrkg diet : calcium carbonate, 7500; manganese sulphate, 300; zinc sulphate, 700; copper sulphate, 60; ferrous sulphate, 500; sodium chloride, 7500; potassium iodate, 2.
least 13 h each day during the culture period, between 1700 and 0800 h. The ponds were static and water was added every four to five weeks to account for evaporative loss and seepage. Up to 50% of the water in each pond was exchanged during January because of
Ž y1.
relatively high concentrations of unionised ammonia )0.3 mg l in most ponds.
Ž . Ž
The fish were cultured for 143 days from December Summer 1995 to May Autumn .
1996 . Fish were fed by hand twice a day, seven days a week, until feeding activity appeared to cease. A maximum of 3% body weight dayy1 was delivered in two roughly equal portions at 0800 h and 1500 h. Approximately 100 fish pondy1 were sampled monthly, the mean weight determined, the biomass estimated and the ration adjusted accordingly. Feed rates were also readjusted mid-month based on daily growth rates from previous sampling. Fish were harvested by seine net and draining the ponds. All fish were harvested, counted and weighed. Performances were evaluated by measuring
Ž .
survival, daily growth rate, weight gain, body composition, feed conversion ratio FCR ,
Ž . w
Table 2
Chemical composition and digestible nutrients of the experimental diets SP35, 95LC1 and 95LC2a
Ž .
Nutrient Quantity in diet dry matter basis
SP35 95LC1 95LC2
Ž .
Digestible protein % 36.08 36.41 34.01
Ž .
Digestible energy MJrkg 13.71 14.53 14.00
Ž .
Fat % 6.97 9.18 9.01
Ž .
Linolenic series fatty acids % 1.25 1.19 1.11
Ž .
Available lysine % 2.24 2.10 1.97
Ž .
Available methionineqcys % 1.65 1.53 1.44
Ž .
Available isoleucine % 1.58 1.47 1.39
Ž .
Available leucine % 3.26 3.04 2.86
Ž .
Available arginine % 2.20 3.16 2.74
Ž .
Available histidine % 0.91 0.99 0.86
Ž .
Available phenylqtyro % 2.98 2.90 2.72
Ž .
Available valine % 1.87 1.75 1.64
Ž .
Available threonine % 1.57 1.53 1.39
Ž .
Available phosphorous % 0.68 0.62 0.83
a
Based on previously determined composition and digestibility coefficients for each ingredient in all diets.
Ž .x
by fish dry weight , production per unit pond area and ingredient cost per unit of fish produced.
Ž .
Water quality in each pond was monitored twice daily 0800 and 1500 h at least
Ž .
three days a week using methods described in Rowland 1995a .
2.4. Sensory eÕaluation of silÕer perch
At the completion of the experiment, the silver perch were purged for three weeks in tanks supplied with domestic water. Fish were not fed during this period. Whole silver perch were gutted and frozen at y188C for shipment and holding prior to sensory evaluation. The aim of this component of the experiment was to assess odour, appear-ance, flavour and texture attributes of cooked silver perch to determine if diet
composi-Table 3
Mean performance and diet ingredient cost for silver perch fed the three expermental diets for 143 days Diet Initial Survival Weight Growth rate FCR PER Production Ingredient
y1 y1
Ž . Ž Ž .
weight % increment g fish kg ha cost
y1 y1 Values are means"S.E.M. for 3 replicate ponds. Means in columns which share the same superscript were not
Ž .
Ž
tion affected sensory properties of the flesh. A total of 12 tasters eight male, four
. Ž .
female assessed three samples one from each dietary treatment using a standard rating
Ž .
procedure AS2542.2.3, SAA, 1988 at each of three sessions. All fish from any treatment were from one pond. All samples presented to each taster were matched for position within the fish, and were from fish of the same weight rank. Temperature of the samples served was 758C. Order of tasting the treatments was balanced across the panel. Samples were served to tasters in individual booths illuminated with white light Ždaylight equivalent . Purified water was freely available for palate cleansing prior and. during tasting. Tasters identified and rated the colour of internal flesh, and odour, flavour and texture characteristics on structured graphic line scales. Overall acceptability of the flesh was also rated, and tasters were given the opportunity to record additional descriptors and add any general comments about the samples.
2.5. Biochemical analyses
All chemical analyses were done in duplicate. Fish samples were analysed for dry
Ž . Ž .
matter, ash, crude fat and energy bomb calorimetry by the AOAC 1990 procedures. Ž . Ž
Nitrogen was determined by the method of Havilah et al. 1977 crude proteinsN=
. Ž .
6.25 . Amino acids were determined by the method of Cohen et al. 1989 and analysed following acid hydrolysis using high pressure liquid chromatography and Waters
Ž .
Pico-Tag Waters, Lane Cove, NSW, Australia . Sulphur amino acids were determined separately following performic acid digestion, and tryptophan, which is lost during acid
Ž .
hydrolysis, was not analysed Cohen et al., 1989 .
2.6. Statistical analysis
All experiments were designed for analysis using single-factor ANOVA. Homogene-ity of variance was assessed using Cochrans’ Test, and multiple comparison among means using Student Newman–Keuls procedure. Mean values were considered signifi-cant at P-0.05.
For each of the sensory variables measured, scores for each diet were compared using a randomised block analysis of variance with sessions and panellists as blocking terms.
Ž .
Where a significant P-0.05 F ratio was found then pairwise comparisons of the mean scores were made using the least significant difference procedure.
3. Results
3.1. SurÕiÕal, growth, FCR and production
Ž .
Results for survival, growth performance, feed conversion ratio FCR and fish production rates are presented in Table 3. Survival was above 96.8% in all ponds and there were no significant differences in survival between treatments. Proximate composi-tion of whole fish fed different diets is presented in Table 4. There were no significant
Ž .
Table 4
Proximate body composition of whole silver perch at completion of the nutrition experiment
Fish Dry matter Nitrogen Ash Energy Fat
Ž . Ž . Ž . Ž . Ž .
sample % % dry basis % dyr basis MJrkg dry basis % dry basis
SP35 41.23"0.34 6.18"0.11 7.88"0.05 29.72"0.17 50.92"0.45 95LC1 43.14"0.05 5.39"0.08 6.87"0.20 30.55"0.13 55.04"0.51 95LC2 42.92"1.78 5.68"0.05 7.65"0.67 30.12"0.34 54.40"2.05
Ž .
Values are means"S.E.M. for fish sampled from 3 replicate ponds fish sampled from 2 ponds for SP35 diet .
Ž .
No significant difference was observed in these data P)0.05; ANOVA .
composition of fish fed different diets. The mean weights at harvest and the mean
Ž .
weight increments were significantly higher P-0.05 for fish fed the 95LC1 and
Ž .
95LC2 compared with those fed SP35 Table 3 . FCRs for fish fed LC diets were
Ž .
significantly lower than for those fed SP35 Table 3 .
3.2. Water quality
Ž .
Diet did not have a significant effect ANOVA; P)0.05 on water quality. The ranges of the monthly means for each variable were: water temperature 19.7 to 27.68C; dissolved oxygen 4.9 to 7.7 mg ly1; pH 6.7 to 9.0; and total ammonia nitrogen ranged from 0.3 to 2.2 mg ly1. Unionised ammonia exceeded 0.1 mg ly1 in most ponds during
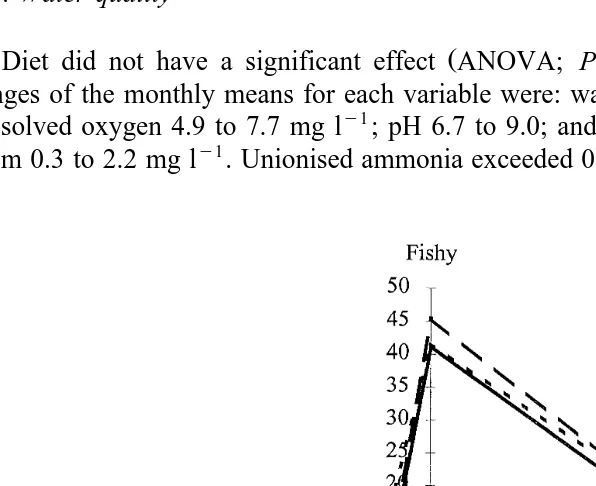
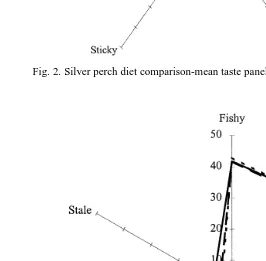
Fig. 2. Silver perch diet comparison-mean taste panel scores: Texture profile.
the December–February period, and concentrations as high as 0.4 mg ly1 were recorded in some ponds during January. On such occasions feeding rates were reduced and the ponds were flushed.
3.3. Sensory eÕaluation
The results from sensory evaluation for odour, texture and flavour of silver perch are presented in Figs. 1–3. Sensory evaluation results showed that fish from all dietary treatments were highly acceptable. Analysis of flesh appearance indicated fish fed
Ž .
95LC2 were significantly whiter less yellow than fish fed the other diets. There were
Ž .
no significant differences P)0.05 in odour or flavour characteristics of the flesh ŽFigs. 1 and 3, respectively , although a slightly stronger weedy. rherbaceous flavour was detected in fish fed diet 95LC1. This diet also produced flesh which was rated
Ž . Ž .
significantly P-0.05 more flaky in texture Fig. 2 . None of these differences significantly altered overall liking scores.
4. Discussion
Ž .
The high survival 96.8% of silver perch achieved in the current study is characteris-tic of this species when good fish husbandry and pond management techniques are used ŽRowland, 1995b . The mean daily growth rate of 2.2 g fish. y1dayy1 of silver perch fed
Ž y1 y1.
SP35 was very similar to growth rates 2.0–2.3 g fish day achieved using this diet
Ž . Ž .
in previous studies by Rowland 1995a and Rowland et al. 1995 . The significantly
Ž y1 y1. Ž .
faster growth 2.5 g fish day of fish fed 95LC1 and 95LC2 Table 3 indicates that the least-cost diets used here were superior to SP35. This growth rate is the fastest yet reported for silver perch, confirming the suitability of the 95LC1 and 95LC2 diets. The slower growth over the last 28 days may have been due to decreasing water tempera-tures during autumn andror a discrepancy between the last monthly sample, in which only ;10% of the fish were collected using a seine net to estimate mean weight, and the final mean weight which was calculated using the actual biomass and total number of fish harvested from each pond.
FCR of 95LC1and 95LC2 were significantly lower than SP35, and were comparable to those achieved in previous production trials with silver perch fed with SP35 which
Ž .
ranged from 1.6 to 2.0:1 Rowland et al., 1994 , and commercial catfish ponds which
Ž .
are near to 2.0:1 Lovell, 1992 . The lower FCRs and increased weight gains for 95LC1 and 95LC2 should lower production costs.
Ž .
Differences in performance weight gain and FCR of fish fed SP35 compared with
Ž .
95LC1 or 95LC2, were significant P-0.05 , and, when the cost of supplying the
Ž .
ingredients for each diet was calculated cost of ingredients=FCR , there were large
Ž .
differences between diets $1.06rkg fish from 95LC2 and $1.79rkg fish from SP35 . During this study, Australian agricultural products were successfully used to replace
Ž .
used as the major protein sources in commercial diets for silver perch and confirms the Ž
potential shown in earlier digestibility and growth studies. Allan et al., 1999; in press Ž . Ž .a , b ; Stone et al., in press; Allan et al., unpublished data ..
Other studies have also shown that meat meal, and meat and bone meal can be successfully used to partially replace fish meal in diets of many fishes, including
Ž barramundi, sea bream, tilapia, yellowtail, channel catfish and rainbow trout Mohsen and Lovell, 1990; Davies et al., 1990, 1991; Aquacop et al., 1993; Shimeno et al., 1993;
. Watanabe et al., 1993; Williams et al., 1997 .
In general, meat meal and meat and bone meal have been used to increase diet
Ž .
attractiveness and or palatability Mohsen and Lovell, 1990; Watanabe et al., 1993 . Fish fed 95LC2, a diet containing only 5% fish meal, with most protein supplied from meat meal, grew more rapidly than fish fed the other diets. These diets were clearly as palatable and, as observed during feeding, just as attractive as the control diet, SP35.
The value of meat products for use in aquaculture diets will increase if protein content is increased and ash content reduced. Aquaculture diets typically contain much
Ž
higher protein:energy ratios than diets for pigs or poultry crude protein contents are .
usually 35–50% for diets compared with 15–22% for pig and poultry diets , as although cold-blooded aquatic animals require similar protein, per kg of growth, they require less energy. For this reason, at least some high protein ingredients are desirable for use in aquaculture diets. Fish meal is a preferred protein source for aquaculture diets as it has a high protein content, excellent amino acid balance, contains essential fatty acids, has no indigestible carbohydrate and, provided it is fresh and well processed, contains no anti-nutritional factors.
Standard meat and bone meal is typically around 50% crude protein,)30% ash and
Ž .
10–20% fat Allan, 1994 . In general, lower fat contents in meat products are desirable,
Ž .
as the lipid tallow or lard in these ingredients consists mainly of saturated fatty acids ŽSFA. and mono-unsaturated fatty acids ŽMUFA. and only small amounts of the
Ž .
nutritionally essential polyunsaturated fatty acids PUFA and no highly unsaturated
Ž .
fatty acids HUFA . SFA and MUFA in tallow or lard are less well utilized than PUFA
Ž .
or HUFA Smith, 1991 and are less desirable to consumers in fish flesh. Low ash, high protein meat meals have shown promise as protein sources to replace fish meal in diets
Ž .
for rainbow trout and yellowtail Shimeno et al., 1993; Watanabe et al., 1993 . Clearly, the value of all meat products in aquaculture diets will depend upon consistency of
Ž
composition and absence of deleterious compounds such as hair or wool which tend to .
clog feed manufacturing equipment . Heat damage in rendering plants can also reduce the availability of certain amino acids, e.g., lysine, and reduce the value of meat meal for use in aquaculture diets.
Lupins and field peas have been used as feed ingredients in the pig and poultry
Ž .
industries in Australia with promising results Petterson and Mackintosh, 1994 . When compared to other ingredients such as soybean, lupins and field peas have the advantage of being relatively free of anti-nutritional factors, therefore, thermo-processing to neutralise anti-nutritional factors is not required, and a saving is made in ingredient
Ž .
processing costs Petterson and Mackintosh, 1994 .
Ž
trout, gilthead seabream and carp Viola et al., 1988; Hughes, 1991; Moyano et al., .
1992; Morales et al., 1994; Robaina et al., 1995 . Protein retention efficiencies of 40–43% have been reported for rainbow trout fed diets containing 10 to 43% lupins ŽGomes and Kaushik, 1989; Morales et al., 1994 . Gouveia et al. 1993 reported. Ž .
Ž improved performance of rainbow trout when fish were fed diets where lupins L.
.
albus , field peas or faba beans were used to replace 20% of the dietary protein from fish meal.
Australia is well placed to utilise agricultural products in aquafeeds. Approximately 450,000 try of meat meal is produced, while lupin and field pea production were 1.4 and 0.3 million t respectively, for the 1997r98 period, and accounted for 88% of the
Ž .
Australian total annual pulse production ABARE, 1998 .
Some of the differences between the performance of fish fed SP35 and the other least-cost diets could be attributed to differences in processing and manufacture. SP35 was uncooked. It was manufactured by a different company than the other diets as it was important that the control diet was a commercially available diet and one which had been used in large-scale experiments at GRC previously. The least-cost diets were formulated at a plant equipped with commercial scale grinding facilities, steam condi-tioning and with experience in large-scale manufacture of aquaculture diets.
Research conducted concurrently with this trial demonstrated that silver perch grew significantly faster on SP35, which was steam-conditioned, compared with SP35 which
Ž . Ž .
was not P-0.05 Booth et al., 1999, in press . In that study, digestibility coefficients for dry matter, protein and energy were similar for steam conditioned and uncooked diets and improvements in growth were attributed to better physical stability of steam conditioned pellets, and improved gustatory characteristics.
Carcass composition of silver perch at the conclusion of the feeding trial, indicated that fish fed all three diets were high in total fat. High levels of fat were also observed during preparation of fish for the sensory tests. Deposits of fat were noticed on the flesh surface below the dorsal fin, around the belly flaps and inside the gut cavity and tasters frequently commented on ‘‘oily’’ or ‘‘buttery’’ flavours. Silver perch are adapted to the Murray–Darling River system in eastern Australia where prolonged droughts followed by floods are common. Spawning behaviour has evolved in response to this cycle ŽMerrick, 1980. and the excessive deposition of fat may also be an evolutionary adaptation to cope with prolonged droughts when natural food is scarce. However,
Ž .
under commercial conditions. This study has shown that neither 95LC1 nor 95LC2 negatively affect fish taste under such conditions.
The results of this research demonstrates meat meal, lupins and field peas have the potential to become major protein sources in aquaculture diets for silver perch.
Acknowledgements
We would like to thank Mark Booth, Scott Parkinson, Rebecca Warner-Smith, Jane Frances, Justin Shipman and Paul Robertson for technical assistance and Rob Roberts and Stephen Nottingham for assistance with the sensory evaluation. We are grateful to
Ž
David Overend, Kevin Smyth and Gary Hoey from Ridley Agriproducts for 95LC1 and
. Ž .
95LC2 and to Tony Hoey and Kerry Ruge from Janos Hoey SP35 for their assistance with manufacturing diets and supplying some ingredients and the vitaminrmineral premixes. Biochemical analyses were carried out at NSW Agriculture, Wollongbar Agricultural Institute by Elspeth Berger and Wendy Peasley. Australian Native Fish Pty provided funds for constructing the ponds at GRC and for wages for two of the technicians. Helena Heasman assisted with manuscript preparation and the manuscript was critically reviewed by Dr. John Nell and Dr. Wayne O’Connor. Financial support for this research was provided by the Fisheries Research and Development, through the Fishmeal Replacement Sub-program, the Australian Meat Research, the Australian
Ž .
Centre for International Agricultural Research Project no. PN9207 and the Grains Research and Development.
References
Australian Bureau of Agriculture and Resource Economics, 1998. Australian Commodity Statistics. ABARE, Canberra, Australia, 347 pp.
Ž .
Allan, G.L., 1994. Development of artificial diets for silver perch. In: Rowland, S.J., Bryant, C. Eds. , Silver Perch Culture: Proceedings of Silver Perch Aquaculture Workshops, Grafton and Narrandera, April, 1994. Austasia Aquaculture for NSW Fisheries, pp. 77–87.
Ž .
Allan, G.L., Gleeson, V.P., Evans, A.J., Stone, D.A.J., in press a . Replacement of fish meal in diets for Australian silver perch, Bidyanus bidyanus: II. Digestibility of lupins. Aquaculture.
Allan, G.L., Parkinson, S., Frances, J., Stone, D.A.J., Booth, M.A., Rowland, S.J., Warner-Smith, R., in press
Ž .b . Replacement of fish meal in diets for Australian silver perch, Bidyanus bidyanus: I. Digestibility of alternative ingredients. Aquaculture.
Ž .
Allan, G.L., Rowland, S.J., 1992. Development of an experimental diet for silver perch Bidyanus bidyanus . Austasia Aquaculture 6, 39–40.
Allan, G.L., Rowland, S.J., Parkinson, S., Stone, D.A.J., Jantrarotai, W., 1999. Nutrient digestibility for juvenile silver perch Bidyanus bidyanus: development of methods. Aquaculture 170, 131–145.
AOAC, 1990. Official Methods of Analysis of the Association of Official Analytical Chemists. 15th edn. AOAC, Washington DC.
AQUACOP, Orengo, H., Cuzon, G., Thouard, E., 1993. Optimisation de l’alimentation de Lates calcarifer en elevage. Essais de substitution de la farine de poisson par de la farine de cretons dans la composition de
Ž .
Booth, M.A., Allan, G.L., Frances, J., Parkinson, S., in press. Replacement of fish meal in diets for silver
Ž .
perch Bidyanus bidyanus : VI. Effects of dehulling and protein concentration on the digestibility of four legumes by silver perch. Aquaculture.
Cho, C.Y., Kaushik, S.J., 1985. Effects of protein intake on metabolizable and net energy values of fish diets.
Ž .
In: Cowey, C.B., Mackie, A.M., Bell, J.G. Eds. , Nutrition and Feeding in Fish. Academic Press, London, pp. 95–117.
Cohen, S.A., Tarven, T.L., Meys, M., 1989. The Pico Tag Method. A Manual of Advanced Techniques for Amino Acid Analysis. Waters, Milford, MA, USA, 123 pp.
Davies, S.J., Nengas, I., Alexis, M., 1991. Partial substitution of fish meal with different meat meal products
Ž . Ž .
in diets for sea bream Sparus aurata . In: Kaushik, S.J., Luquet, P. Eds. , Fish Nutrition in Practice, Coll. Les Colloques, No. 61. INRA, Paris, pp. 907–911.
Davies, S.J., Williamson, J., Robinson, M., Bateson, R.I., 1990. Practical inclusion levels of common animal
Ž .
by-products in complete diets for tilapia Oreochromis mossambicus, Peters . In: Takeda, M., Watanabe,
Ž .
T. Eds. , The Current Status of Fish Nutrition in Aquacultures. Proc. Third Intnl. Symp. on Feeding and Nutrition in Fish, 28 August to 1 September, 1989, Toba, Japan pp. 325–332.
Gomes, E.F., Kaushik, S.J., 1989. Incorporation of lupin seed meal, Colzapro or triticale as proteinrenergy subsitutes in rainbow trout diets. In: Proc. Third International Symposium on Feeding and Nutrition in Fish, Toba. pp. 315–324.
Gouveia, A., Olivia-Teles, A., Gomes, E., Rema, P., 1993. Effect of cooking-expansion of three legume seeds
Ž .
on growth and food utilization by rainbow trout. In: Kaushi, S.J., Luquet, P. Eds. , Fish Nutrition in Practice, Coll. Les Colloques, No. 61. pp. 933–938.
Havilah, E.T., Wallis, D.M., Morris, R., Wollnough, J.A., 1977. A micro-colorimetric method for determina-tion of ammonia in Kjeldahl digests with a manual spectrophotometer. Lab. Pract. 26, 545–547. Hughes, S.G., 1991. Use of lupin flour as a replacement for full fat soy in diets for rainbow trout
Oncorhynchus mykiss. Aquaculture 93, 57–62.
Ž .
Lall, S.P., 1991. Concepts in the formulation and preparation of a complete fish diet. In: De Silva, S.S. Ed. , Fish Nutrition Research in Asia. Proceedings of the Fourth Asian Fish Nutrition Workshop. Asian Fish. Soc. Spec. Publ. 5 Asian Fisheries Society, Manila, Philippines, 205 pp.
Ž .
Lovell, R.T., 1992. Nutrition and feeding of channel catfish. In: Allan, G.L., Dall, W. Eds. , Proceedings of the Aquaculture Nutrition Workshop, Salamander Bay 15–17 April 1991. NSW Fisheries, Brackish Water Fish Culture Research Station, Salamander Bay, Australia, pp. 3–8.
Lovell, T., 1989. Canola meal in catfish feeds. Aquaculture Magazine, 68–70, SeptemberrOctober.
Ž . Ž .
Merrick, J.R. Ed. , 1980. Family Terapontidae: freshwater grunters or perches. In: McDowall, R. Ed. ,
Ž .
Freshwater Fishes of South-eastern Australia New South Wales, Victoria and Tasmania . Reed, Sydney, pp. 164–167.
Ž
McGoogan, B.B., Reigh, R.C., 1996. Apparent digestibility of selected ingredients in red drum Sciaenops
.
ocellatus diets. Aquaculture 141, 233–244.
Mohsen, A.A., Lovell, R.T., 1990. Partial substitution of soybean meal with animal protein sources in diets for channel catfish. Aquaculture 90, 303–311.
Morales, A.E., Cardenete, G., De la Higuera, M., Sanz, A., 1994. Effects of dietary protein source on growth, feed conversion and energy utilization in rainbow trout, Oncorhynchus mykiss. Aquaculture 124, 117–126. Moyano, F.-J., Cardenete, G., De la Higuera, M., 1992. Nutritive value of diets containing a high percentage
of vegetable proteins for trout, Oncorhynchus mykiss. Aquat. Living Res. 5, 23–29.
Ž .
National Research Council NRC , 1993. Nutrient Requirements of Fish. National Academy Press, Washing-ton DC, USA, 114 pp.
Petterson, D.S., Mackintosh, J.B., 1994. The chemical composition and nutritive value of Australian grain legumes.. Grains Research and Development, Canberra, Australia, 68 pp.
Robaina, L., Izquierdo, M.S., Moyano, F.J., Socorro, J., Vergara, J.M., Montero, D., Fernandez-Palacios, H.,
Ž .
1995. Soybean and lupin seed meals as protein sources in diets for gilthead seabream Sparus aurata : nutritional and histological implications. Aquaculture 130, 219–233.
Rowland, S.J., 1995a. Production of fingerling and market-size silver perch in earthen ponds. In: Rowland,
Ž .
Rowland, S.J., 1995b. High density pond culture of silver perch, Bidyanus bidyanus. Asian Fish. Sci. 8, 73–79.
Rowland, S.J., Allan, G.L., Clark, K., Hollis, M., Pontifex, T., 1994. Production of fingerling Bidyanus
Ž .
bidyanus Teraponidae at two densities in earthen ponds. Prog. Fish-Cult. 56, 296–298.
Rowland, S.J., Allan, G.L., Hollis, M., Pontifex, T., 1995. Production of the Australian freshwater silver
Ž .
perch, Bidyanus bidyanus Mitchell , at two densities in earthen ponds. Aquaculture 130, 317–328. Rowland, S.J., Barlow, C., 1991. Fish biology — the right prerequisites — a case study with freshwater silver
Ž .
perch Bidyanus bidyanus . Austasia Aquacult. 5, 27–30.
Rowland, S.J., Ingram, B.A., 1991. Diseases of Australian Native Fishes Fisheries Bulletin 4. NSW Fisheries, Sydney.
Ž .
Standards Association of Australia SAA , 1988. In: Australian Standard Sensory Analysis of Foods: Part 2.
Ž .
Specific Methods AS 2542.2.3 . SAA, Sydney, pp. 1–8.
Shimeno, S., Masumoto, T., Hujita, T., Mima, T., Ueno, S.-I., 1993. Alternative protein sources for fish meal in diets of young yellowtail. Nippon Suisan Gakkaishi 59, 137–143.
Smith, L.S., 1991. Introduction to Fish Physiology. Argent Laboratories, 352 pp.
Stone, D.A.J., Allan, G.L., Parkinson, S., Rowland, S.J., in press. Replacement of fish meal in diets for Australian silver perch, Bidyanus bidyanus: III. Digestibility and growth using meat meal products. Aquaculture, in press.
Tacon, A.G.J., 1994. Feed ingredients for carnivorous fish species. Alternatives to fishmeal and other fisheries resources, FAO Fisheries Circular No. 881. FAO, Rome, 35 pp.
Thurstan, S.J., Rowland, S.J., 1995. Techniques for the hatchery production of silver perch. In: Rowland, S.J.,
Ž .
Bryant, C. Eds. , Proc. of Silver Perch Aquaculture Workshops, Grafton and Narrandera, April 1994. Austasia Aquaculture for NSW Fisheries, pp. 29–39.
Ž .
Viola, A., Arieli, Y., Zohar, G., 1988. Unusual feedstuffs tapioca and lupin as ingredients for carp and tilapia feeds in intensive culture. Isr. J. Aquacult. Bamidgeh 49, 29–34.
Watanabe, T., Pongmaneerat, J., Sato, S., Takeuchi, T., 1993. Replacement of fish meal by alternative protein sources in rainbow trout diets. Nippon Suisan Gakkaishi 59, 1573–1579.