ASSESING GEOGRAPHIC ISOLATION OF THE GALAPAGOS ISLANDS
D. Orellana a,b*, F. Smith b, c a
Faculty of Agronomic Sciences, Universidad of Cuenca, Av. 12 de Abril, Cuenca, Ecuador - [email protected] b
Charles Darwin Foundation, Puerto Ayora, Ecuador, c Department of Ecology & Evolutionary Biology, Brown University, Providence, Rhode Island, USA- [email protected]
Commission III, WG VIII/7
KEY WORDS: Galapagos, accessibility, geographical isolation, human impact, mobility, island ecosystems.
ABSTRACT:
The Galapagos Archipelago is one of the most important ecological spots in the planet due its unique biodiversity, active geology, and relatively well-preserved ecosystems. These characteristics are strongly based on the geographical isolation of the islands. On the one hand this isolation allowed the evolution processes that gave the islands their international fame and on the other hand it kept them from major human impacts that affected the vast majority of the Earth’s surface. Galapagos’ geographical isolation is therefore of mayor value, but it is rapidly diminishing due to the increase of marine and air transportation among islands and with the rest of the world. This increased accessibility implies enhanced risks for the ecological dynamics on the archipelago (e.g. increased risk of biological invasions, uncontrolled tourism growth, more water and energy consumption). Here, we introduce a general accessibility model to assess geographical isolation of the Galapagos Islands. The model aims to characterize accessibility in terms of human mobility by evaluating travel time to each point of the archipelago using all available transportation modalities. Using a multi criteria cost surface for marine and land areas, we estimated travel time for each surface unit using the fastest route and mode of transportation available while considering several friction factors such as surface type, slope, infrastructure, transfer points, legal restrictions, and physical barriers. We created maps to evaluate the isolation of different islands and places, highlighting the potential risks for several habitats and ecosystems. The model can be used for research and decision-making regarding island conservation, such as estimating spreading paths for invasive species, informing decisions on tourism management, and monitoring isolation changes of sensitive ecosystems.
* Corresponding author
1. INTRODUCTION
1.1 General
Since the publication of the "Voyage of the Beagle" by Charles Darwin (1839), the Galápagos Archipelago has been regarded as a "natural laboratory" to illustrate the role of isolation in modifying the ecology, evolutionary patterns and biogeographic processes that result in globally unique flora and fauna. This unique biodiversity, active geology and relatively well-preserved ecosystems led to the Galápagos Islands being recognised as a UNESCO World Heritage site in 1978 and give the archipelago its reputation as a highly valued international tourism destination (Dirección del Parque Nacional Galápagos, 2014). Despite its isolation and considerable area dedicated as protected National Park (i.e. 79% of the land surface), continual pressure to develop the islands has led to a rapid increase in the marine and air transport among islands, connectivity to mainland South America, and the expansion of visiting sites and activities permitted (Grenier, 2007). This increase in accessibility has resulted in an increasing risk of biological invasions, impacts on animal behaviour, physical disturbance, and degradation of "wilderness" experience (Watkins & Cruz, 2007). Concomitant with increased development and accessibility of areas of the Galápagos National Park and Marine Reserve, development of the urban and rural agricultural areas has also increased, leading to a further need to increase access. This combination of threats led to the Galápagos Islands being put on the UNESCO List of "World Heritage in Danger" from 2007-2010, citing the lack of preventive measures for alien
species introductions, rapid uncontrolled growth of tourism, fishing over-capacity and weak institutional governance. Indeed, conservation biologists concerned with the growing threat of invasive pathogens have stated that "...the best and perhaps only management option is to protect the isolation of these island communities" (Wikelski, Foufopoulos, Vargas, & Snell, 2004).
In order to assist the Galápagos National Park Directorate and local institutions in achieving sustainable development for the Galápagos Islands, this study was initiated to quantify the relative isolation of places across the Archipelago, incorporating both natural characteristics of the landform, natural and human-modified vegetation, and infrastructure which can increase human accessibility (e.g. roads, wharves, walking trails). The desired result was to provide a general model of accessibility that measures the time required to travel between each point of the Archipelago using all transportation modalities. As a number of variables in the model can be easily managed (e.g. in terms of trail access, velocity, et cetera), this model can be utilised to make strategic planning decisions to maintain ecological integrity and protect the wilderness values that Galápagos Islands represent.
2. METHODS
2.1 Study area
Galapagos, one of the best-preserved tropical archipelagos in the world, is well known for its natural beauty and ecological importance. It lies approximately 1 000 km west of Ecuador in
the Pacific Ocean, crossed by the equatorial line Figure 1. It covers a total surface of 133 255 km2 including the marine reserve. The emerged land is distributed in 13 major islands (> 10km2), 6 middle islands (between 1 and 10km2) and 216 minor islets and rocks (Dirección del Parque Nacional Galápagos, 2014).
Each island has its own biological and geographical individualities, but there are some common altitudinal zones, usually described as the following: bare zone near the coastlines, which comprises lava rocks, beaches and lagoons; littoral zone, dominated by shrubs and small trees, mangroves and other salt-tolerant species; arid zone, where xerophytes dominate vegetation together with low scrub and Opuntia cactus; transition zone, where vegetation consists of a mixture from the lower and higher altitudes, with important tree cover; humid zone, typically dominated by the different species of Scalesia; and very humid zone, mainly comprised of species of genus Miconia, sedges and ferns (Watson, Trueman, Tufet, Henderson, & Atkinson, 2010). Vulcan activity is still shaping the islands, modifying coastlines and transforming the landscape. Large lava camps, such as those at the Perry Isthmus in Isabela, increase geographical and biological isolation.
Since its discovery in 1535 until beginning of XX century, there were several failed attempts to colonise the islands for different purposes, from resting spot for buccaneers and pirates to sugar production enterprise. Although these attempts never lasted for too long, they left a strong footprint of the islands: giant tortoises and marine lions were killed by thousands, and several alien species such as goats and rats were introduced with devastating effects (de Groot, 1983).
Nevertheless the archipelago remained largely disconnected from mainland until World War Two, when the first airport was built in Baltra Island. Later, tourism and fishery industries increased the connectivity between islands and with the rest of the world trough commercial flights and cargo ships. Nowadays, more than 200 000 visitors and approximately 58 000 tons of goods arrive to Galápagos each year (Dirección del Parque Nacional Galápagos, 2013), dramatically changing the geographical isolation of the archipelago. This process has been dubbed “geographic aperture” of Galápagos (Grenier, 2007).
2.2 Cost-surface modelling
Accessibility can be defined as the cost to travel between two locations, being measured as distance, time, energy or any other limiting factor. There are several methods to compute accessibility from a spatial-analytics perspective, all of them being either network-based or field-based. Network based methods rely on graph algorithms such as the well-known Dijkstra which computes the shortest route between nodes in a graph (usually a street network), where the links represent some sort of cost, which can be distance, time, or any other. Field-based methods compute the cost of travel between two locations on a raster grid, where each cell represents the cost of traversing that cell (Douglas, 1994; Juliao, 1999). These methods are more appropriate for modelling movement or travel costs in continuous surfaces. In our model we used the second approach, since our aim is to compute the accessibility to any location of the Galápagos Archipelago from the entrance points. Therefore, we modelled accessibility using a cost-distance function representing the time taken cross each cell on a raster taking into account the particular characteristics of Galápagos.
Figure 1. The Galapagos Islands and Marine Reserve are located approximately 1 000 km West from Ecuador mainland.
The modelling process used the following assumptions: First, crossing-time of each cell was determined using the fastest transportation mode for the corresponding surface. For example, roads were assigned with the maximum legal speed for motor vehicles and the type of road, other land surfaces were assigned with a base walking speed of 5 km/h and then corrected with different friction weights, sea surface was assigned with the average motorboat speed for fastest boats in Galápagos. Second, moving speed is affected by impedance coefficients depending on the kind of surface. Third, slope and other physical features, such as cliffs and rocky sea bottoms also influence moving speed. Fourth, boundaries such as coastlines require change of transportation mode, and therefore represent additional friction.
To construct the cost-distance function, these assumptions were used to estimate movement speeds for every kind of surface in the archipelago. These speeds were converted to transition times and encoded in a raster layer with a resolution of 100 m. The variables and parameters used to compute this layer are detailed below.
2.3 Model variables and parameters
Land use and land coverage. Speed was initially assigned to different land coverage types with values reported on the literature (Pozzi & Robinson, 2008) and adjusted according authors’ experience on fieldwork in Galápagos. Land coverage and vegetation types were assigned with friction coefficients to adjust moving speed according the difficulty to pass trough compared with a free surface. Land use and coverage data was extracted from vegetation and coverage GIS layers (The Nature Conservancy & CLIRSEN, 2006).
Infrastructure. Roads speeds were assigned according the maximum legal speed for motor vehicles, surface type, and quality. Paths and footways were assigned with a base walking speed of 5kmh. Piers and docks were later used to adjust transition speeds over coastlines. Features and characteristics
were mapped using public data from OpenStreetMap (OpenStreetMap, 2016) and fieldwork.
Slope. Slope is included in the model as a speed-reduction factor compared with a flat surface (Pozzi & Robinson, 2008). Reduction factor was modelled trough fitting a second order polynomial function (Equation 1) with field data collected with GPS for different transportation modes.
ks = 0.0125⋅(s2
) - 2.236⋅(s) + 100 (1)
where ks is the reduction coefficient due slope and s is the slope in degrees.
Slope was derived from elevation data from the Shuttle Radar Topography Mission (Farr et al., 2007).
Marine navigation. For marine surfaces, two initial speed values were assigned: A cruising speed for open sea of 64.8 kmh (35 knots) and an approach speed near the coastline of 32.4 kmh (17.5 knots). These values were obtained with GPS measurements for speedboats and direct communication from experienced fishermen and seamen.
Crossing coastlines. Moving from sea to land and vice versa implies an additional time cost due transferring between transportation modes and crossing the coastline. This cost will vary significantly according several factors. First, the kind of seafloor near the coast will affect the boat speed: a rocky seafloor, for example, will require difficult manoeuvring decreasing dramatically the navigation speed, whereas a deep or sandy bottom will allow an easy and swift approach. Secondly the presence of cliffs will represent a natural barrier with an extremely high cost for crossing (although no impassable). Finally, the presence of infrastructure such as piers or docks will reduce the crossing time. Transition times for these factors were obtained experimentally trough boarding and landing exercises.
Data on seafloor characteristics was obtained from the Galápagos – Orstom project (ORSTOM, 1987). Each kind of seafloor was assigned with a friction factor from experimental data and expert advice. Then, coastline was segmented in 1929 sections and the friction of each segment was computed as the weighted sum of the frictions of each kind of seafloor in a buffer area of 500m from the corresponding segment.
An adequate map of cliffs was not available. Therefore, it was necessary to derive the cliffs using the SRTM DEM (90m resolution) to derive contour lines near to coast (every meter up to 20 meters) and then compute a probability density function. The areas with a per cent contour value > 90% are marked as cliffs. Due differences between the original DEM and the coastline, the centreline of the cliff was projected to the coastline. The corresponding pixels on the coastline were assigned a friction factor of five. This value was experimentally obtained with field data.
Finally, piers and docks were mapped using data from OpenStreetMap and the Charles Darwin Foundation databases. Features were converted to raster and the corresponding pixels of the coastline were assigned a reduced cost, since these infrastructures facilitate crossing the coastline.
2.4 Calibration
The impedance values, measured as minutes per meter, were validated and calibrated with field data. This allowed adjusting the initial parameters and calibrating the model. Several exercises were conducted in order to obtain ground truth data. Additionally, data from field scientific expeditions to different parts of Galapagos were also used for calibration.
3. COMPUTING ACCESSIBILITY
Once the cost-surface raster was obtained and calibrated, an accessibility layer was computed representing the accumulated time to each cell of the study area from a set of origins. Airports in Baltra and San Cristobal were selected as origins since they represent the entrance points into the islands. Isabela Airport only receives inter-island flights; therefore a specific accessibility layer was computed from this point and added one hour representing the mean flight time from Baltra. The two layers were combined using a conditional operation to obtain the minimum travel time for each cell.
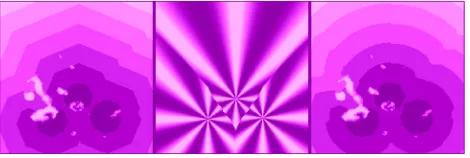
The computation was conducted using ArcGIS’ Spatial Analysis package. One drawback of this software is that the cost-distance algorithm works following 8 directions from the centre of each raster cell (ESRI, 2015). As result, when cost-distance is accumulated over large areas (or high cell resolutions) the output produces octagonal-shaped artefacts (Figure 2, left). To improve results, a correction layer was created by dividing a Euclidean distance layer from the origin points by a cost-distance layer with a constant friction value of 1 (Figure 2, centre). Finally, a corrected cost-distance layer was obtained by multiplying the original cost-distance layer times the correction layer (Figure 2, right).
Figure 2: Octagonal-shaped results from cost-distance functions (left). Correction layer (middle). Corrected cost-distance (right).
4. ACCESIBILITY AND ISOLATION IN GALÁPAGOS
The analysis showed that 50% of the study area, including emerged land and marine areas could be reached in less than 2.5 hours, and approximately 99% in less than 6 hours. Only 0.01% of the archipelago is beyond 15 hours of travel. Moreover, 75% of the land surface can be reached in less than six hours. It takes 27 hours to arrive to the most isolated location.
The accessibility map shows a high accessible zone (less than one hour from the entrance points) covering a large part of the central area of the archipelago corresponding to the tourism-intensive area, and also where most of the human impacts are more severe. It is worth noting that although the northern islands of Darwin and Wolf are the most remote in terms of Euclidean distance, they are more accessible than relatively close spots when the cost-time surface is considered. In fact, the most isolated areas are located in the skirts of the volcanoes in the north of Isabela and Fernandina. Also, some abrupt changes
in accessibility are evident, such as the northwest of Sierra Negra volcano in Isabela.
In order to assess isolation for different islands1, statistics were obtained characterising main properties in terms of accessibility. Minimum accessibility values (mnAc) represent the required time to reach the closest point of the island. Maximum Accesibility (mxAc) values represent the most isolated areas of each island. Finally, mean (meAc) and median (mdAc) allowed characterising the average accessibility. The analysis of the statistics allowed identifying three main groups according their isolation.
Figure 3. Accessibility and isolation of the Galápagos Islands
Islands in Group 1 (Santa Cruz, San Cristóbal, Santa Fé, Pinzón and Española) are easy to reach and most of their area is accessible in little time (mnAc < 1h and MeAc < 2.2h). The most isolated areas of these islands are at no more than 6.3h from the nearest access. These islands form a corridor from the central area of the archipelago towards South-East.
Group 2 is characterised by mnAc values between 0.75h and 2.2h, and meAc of 2.2h - 3.3h. This group includes Floreana, Genovesa, Pinta, Marchena and Santiago islands, forming a slightly more isolated ring around the central corridor.
Group 3 is composed by more isolated islands: Darwin, Wolf and Fernandina, which require at least three hours to reach from the access points. Due their small size, Darwin and Wolf present
1
Minor islands and islets were grouped to their corresponding major island
few variation in their accessibility values, whereas Fernandina exhibits a wide range of accessibility values, with extremely isolated spots (MxAc = 23.25h).
Morphology and geology of Isabela make this island a group on itself, since it exhibits a set of characteristics different from any other group. The Minimum Accessibility Time is 1 hour from access point (via airplane from Baltra). Nevertheless, median and mean accessibility are large, and the most isolated spot of the archipelago is located in this island at the skirts of Darwin Volcano.
Figure 4: Accessibility statistics for each island
5. CONCULSIONS
The model of general accessibility highlights several important features of the Galápagos Archipelago, including the identification of several groups of islands based on their relative isolation. For Group 1 islands, with a minimum accessibility of < 1 hour and a maximum of 6.3 hours, demonstrate a non-intuitive result of several of the smaller, offshore islands (e.g. Pinzón) having similar access profiles of the larger, higher altitude, complex - but inhabited - islands (e.g. San Cristóbal). Group 2 islands, including Santiago and islands located off the Galápagos shelf (i.e. Pinta, Marchena, Genovesa, Floreana), show minimum accessibility values ranging from 0.75 - 2.2 h and maximum isolation of 7.5 hours. This result largely reflects the increase in vessel speed capacity, which allows these islands to be relatively accessible, despite their geographic distance. Group 3 islands (Wolf, Darwin, and Fernandina) are among the most remote islands with minimum accessibility values of 3 to 5
hours), despite their largely different geographies. The case of Fernandina, a large active volcanic island in the western-most part of the Archipelago, is considered among the "wildest" places in Galápagos with a large number of endemic species and core breeding populations for Galápagos Penguins (Spheniscus mendiculus), flightless cormorants (Phalacrocorax harrisi), and marine iguanas (Amblyrhynchus cristatus), as well as unique floral assemblages, "kipuka" (vegetation islands of the vast lava beds). Group 4, represented by a single island (Isabela), shows some interesting characteristics including areas that are readily accessible (i.e. minimum accessibility of 1.3 hours) combined with the most remote areas in the Archipelago (i.e. > 25 hours).
The identification of these groups poses several management approaches in the context of individual accessibility profiles. For example, Group 1 represents islands, which are at greatest risk of alien species invasions and human-associated pressures on the ecosystem (e.g. physical disturbance, interaction with wildlife, litter, et cetera). However, management approaches are likely to differ between islands within this group. For example, the large, more complex inhabited islands may provide a greater range of opportunities to restrict access points and thoroughfares that can maintain isolated areas - while the smaller, uninhabited offshore islands will largely be managed by vessel traffic and activities permitted at specific sites (e.g. snorkelling at Santa Fé, anchoring in at Pinzón). Other accessibility profiles from this model may also indicate opportunities for the sustainable development of local communities and tourism operations. For example, Groups 3 and 4 are examples of insular ecosystems that maintain a high "wilderness value", but are accessible in a reasonable amount of time (i.e. < 5 hours). With appropriate management measures in place (e.g. quarantine procedures, limits on visitor numbers, norms on visitor behaviour), these areas could continue to supply high-value wilderness experiences for national and international tourism.
Having information on the relative accessibility of places across the Archipelago can provide the Galápagos National Park Directorate and collaborators with a valuable tool for the design of monitoring programmes, assessing requirements for pest control or eradication, risk assessment, and improving oversight on potential mobility within the National Park and Marine Reserve. The development of a quantitative general model of accessibility also provides opportunities for managers and decision-makers to be able to conduct scenarios and evaluate the relative impact of a given proposal (e.g. wharf development, new roads, enhanced airport capacity) on the present accessibility profile for a given island or suite of islands. The results of such scenarios, combined with other impact assessments on flora, fauna, landscapes, or other World Heritage values, could help underpin the future sustainable development of the Archipelago.
ACKNOWLEDGEMENTS
Authors express their thanks to the Charles Darwin Foundation and the staff of the Research Station for their support and advice on this research.
REFERENCES
Darwin, C. (1839). Journal of Researches: into the Geology and the Natural History of the Countries Visited During the Voyage of H.M.S. Beagle Round the World. London.
de Groot, R. S. (1983). Tourism and conservation in the Galapagos Islands. Biological Conservation, 26(4), 291–300. http://doi.org/10.1016/0006-3207(83)90093-9
Dirección del Parque Nacional Galápagos. (2013). Informe Anual de Visitantes a Galápagos 2012. Puerto Ayora.
Dirección del Parque Nacional Galápagos. (2014). Plan de manejo de las áreas protegidas de Galápagos para el buen vivir. Puerto Ayora.
Douglas, D. H. (1994). Least-cost Path in GIS Using an Accumulated Cost Surface and Slopelines. Cartographica: The International Journal for Geographic Information and Geovisualization, 31(3), 37–51. http://doi.org/10.3138/D327-0323-2JUT-016M
ESRI. (2015). ArcGIS 10.2. Redlands.
Farr, T. G., Rosen, P. A., Caro, E., Crippen, R., Duren, R., Hensley, S., … Alsdorf, D. (2007). The Shuttle Radar Topography Mission. Reviews of Geophysics, 45(2), 1–33. http://doi.org/10.1029/2005RG000183
Grenier, C. (2007). Conservación contra natura: Las islas Galápagos. Quito: Abya-Yala.
Juliao, R. P. (1999). Accessibility and GIS. In ERSA conference papers (pp. 23–27). Dublin.
OpenStreetMap. (2016). OpenStreetMap. Retrieved 1 January 2015, from http://www.openstreetmap.org/
ORSTOM. (1987). Proyecto Cartográfico Galápagos.
Pozzi, F., & Robinson, T. (2008). Accessibility Mapping in the Horn of Africa: Applications for Livestock Policy. IGAD LPI Working Paper.
The Nature Conservancy, & CLIRSEN. (2006). Cartografía Galápagos 2006: Conservación en otra Dimensión. Quito.
Watkins, G., & Cruz, F. (2007). Galapagos At Risk.
Watson, J., Trueman, M., Tufet, M., Henderson, S., & Atkinson, R. (2010). Mapping terrestrial anthropogenic degradation on the inhabited islands of the Galapagos
Archipelago. Oryx, 44(1), 79.
http://doi.org/10.1017/S0030605309990226
Wikelski, M., Foufopoulos, J., Vargas, H., & Snell, H. (2004). Galápagos birds and diseases: invasive pathogens as threats for island species. Ecology and Society, 9(1), 5.