UAV DATA PROCESSING FOR RAPID MAPPING ACTIVITIES
W. Tampubolon*, W. Reinhardt
AGIS, Institute for Applied Computer Science, Universität der Bundeswehr München, Germany - (winhard.tampubolon, wolfgang.reinhardt)@unibw.de
Commission VI, WG VI/4
KEY WORDS: rapiddisaster mapping, accuracy of classification
ABSTRACT:
During disaster and emergency situations, geospatial data plays an important role to serve as a framework for decision support system. As one component of basic geospatial data, large scale topographical maps are mandatory in order to enable geospatial analysis within quite a number of societal challenges.
The increasing role of geo-information in disaster management nowadays consequently needs to include geospatial aspects on its analysis. Therefore different geospatial datasets can be combined in order to produce reliable geospatial analysis especially in the context of disaster preparedness and emergency response. A very well-known issue in this context is the fast delivery of geospatial relevant data which is expressed by the term “Rapid Mapping”.
Unmanned Aerial Vehicle (UAV) is the rising geospatial data platform nowadays that can be attractive for modelling and monitoring the disaster area with a low cost and timely acquisition in such critical period of time. Disaster-related object extraction is of special interest for many applications.
In this paper, UAV-borne data has been used for supporting rapid mapping activities in combination with high resolution airborne Interferometric Synthetic Aperture Radar (IFSAR) data. A real disaster instance from 2013 in conjunction with Mount Sinabung eruption, Northern Sumatra, Indonesia, is used as the benchmark test for the rapid mapping activities presented in this paper. On this context, the reliable IFSAR dataset from airborne data acquisition in 2011 has been used as a comparable dataset for accuracy investigation and assessment purpose in 3 D reconstructions. After all, this paper presents a proper geo-referencing and feature extraction method of UAV data to support rapid mapping activities.
* Corresponding author
1. INTRODUCTION
The role of geospatial information as an integrated part of governmental activities has been profoundly developed since 2011 by the legislation about Geospatial Information in Indonesia. Large scale topographical mapping is prioritized to support the nationwide development e.g. related to disaster preparedness, detailed spatial planning, etc. Unfortunately, in order to provide high resolution 3D geospatial data, large scale topographical mapping still relies on conventional airborne campaigns, which is in general a costly but not timely mapping project.
1.1 Research Background
Geospatial-based information nowadays has turned into a primary need in human life. This phenomenon brings an attention to the corresponding stakeholders and geospatial industries in parallel with the invention of new technologies in an open and competitive worldwide market. Head to head competition of different platforms, sensors, and techniques is showing up as an answer for the geospatial demand all over the world.
The importance of disaster management triggers worldwide cooperation under Services and Applications for Emergency Response (SAFER) projects (Schneiderhan, 2010). On this context, the geospatial data acquisition takes a major role, in which the utilization of space borne based data including Very
High Resolution Satellite (VHRS) imagery data will be initiated immediately in the period of major disasters around the globe.
In specific, Indonesia as one of the vulnerable countries around a disaster prone area needs geospatial data as a framework for supporting disaster preparedness and quick emergency response. Geospatial data are mandatory in this case because they contain fundamental geospatial features especially the earth surface terrain information with respect to its proper geometrical accuracies.
During disaster and emergency situations, geospatial data can provide important information for decision support system. As one instance of basic geospatial data, large scale topographical maps are essential in order to enable accurate analysis within quite a number of societal challenges.
The utilization of geospatial data using topographic maps as a basic reference is mandatory to provide accurate quick emergency response in so called rapid mapping activities. The combination between accuracy requirements and time restriction is considered as critical in this stage.
UAV as an alternative platform for geospatial data acquisition offers potentials because of its flexibility and practicability combined with low cost implementations. Moreover, the high resolution data collected from UAV platforms have the capabilities to provide a quick overview of the disaster area. Nevertheless, there are some limitations that shall be taken into The International Archives of the Photogrammetry, Remote Sensing and Spatial Information Sciences, Volume XL-3/W3, 2015
account in the UAV data processing for rapid mapping activities.
This paper describes the role of UAV data acquisition in supporting rapid mapping activities. In addition to the provided large scale topographic maps, the disaster-related object will also be delivered as some important outputs from rapid mapping in the context of disaster preparedness and emergency response.
1.2 Research objectives and motivation
It is their main advantage that UAV platforms enable on-demand very high resolution data collection which can be customized efficiently. UAVs can provide non-metric camera data as well as point cloud data which can be increasingly utilized to support decision-making processes within disaster context situations.
Geospatial data collected from a UAV are usually captured from low altitude. In that condition, there normally is no significant occlusion and therefore the data can be used for semi-automatic feature extraction purpose in a similar way as full-metric airborne data, if suitable tools are used.
In this paper, we want to demonstrate that a UAV platform can deliver geospatial data with sufficient accuracy to be used, subsequently for disaster-related feature extraction. For this purpose, a proper geo-referencing approach must be defined.
In our use case, we want to investigate the role of existing geospatial data e.g. airborne Interferometric Synthetic Aperture Radar (IFSAR) data, Microsoft Bing imagery and ASTER GDEM for UAV data processing in the context of large scale topographical mapping.
Another objective of our investigations is to identify a proper classification method for the purpose of disaster-related object extraction from high resolution UAV data. Unsupervised classification has been chosen as an approach to extract feature of interest for minimizing the processing time and field measurement as well.
The results from each approach and at each density are subsequently validated against reference data acquired from field surveys using Global Navigation Satellite System (GNSS) and IFSAR data (for details see section 3).
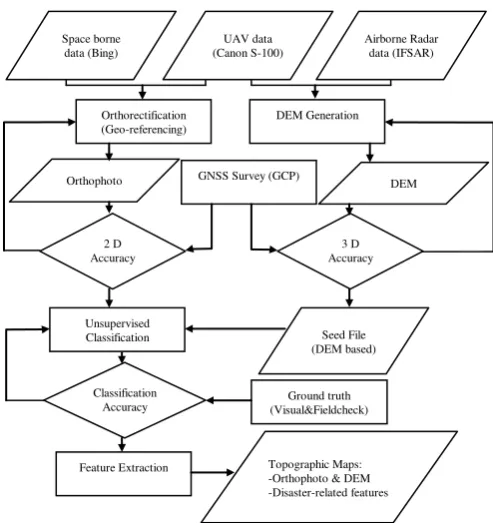
Basically, this paper focuses on the geometric accuracy of orthophoto and Digital Elevation Model (DEM) derived from the UAV data. In order to evaluate the geometric accuracy, it is necessary to use reference data with a proper geometric accuracy. From the UAV data, 2D data like orthophotos as well as 3D data as DEMs can be derived. The generation of this different data needs some different components and consequently the evaluation workflow of the 2D and the 3D data is different to some extend (see Figure 1).
Subsequently, this research also introduces the combination between unsupervised classification and 3D analysis for the purpose of disaster-related features extraction. On this context, the role of 3D analysis contributes by providing the seed file data which can improve the unsupervised classification accuracy.
Figure 1. Data processing workflow
1.3 Area of Interest
The test area Mount Sinabung has been selected because a real disaster event i.e. volcano eruptions which occurred there and the availability of reference data, including the geodetic reference network infrastructure.
Mount Sinabung is located in northern part of Sumatera Island in Indonesia which has been significantly showing volcano activities since 2010. UAV data acquisition has been performed immediately after the significant mount eruption in December 2013 with respect to the area restriction in the period of the disaster declaration status.
In the development context of Indonesia, this area is prioritized as a strategic area by the stakeholders, and therefore it is a goal to accomplish a detailed spatial planning there. As a consequence, an airborne IFSAR data acquisition in 2011 has been done in order to produce topographical maps for the area in a scale of 1:50.000. However, this data set has a sufficient accuracy for 1:10.000 topographical mapping and consequently can be used as a reliable reference data for the accuracy assessment as explained above.
In general, the test site covered approximately a valley area of 1,800 hectares which has an elevation approximately between 1,000 – 1,500 meters above mean sea level (msl). The terrain condition of the affected area such as villages, forests, plantation, etc. is classified as extremely undulated with a lot of valley area in the bottom of the mountainous regions (see
Figure 2. Area of Interest (Mount Sinabung, Indonesia)
2. STATE OF THE ART
Rapid Mapping is a procedure to provide geospatial data by combining immediate data collection and processing with a certain contextual aspect in order to give a quick overview about certain earth phenomena. This term is frequently used in the context of disaster preparedness and emergency response e.g. for presenting earth observation data (Percival, 2012).
2.1 Data Acquisition
Until recently, UAV technology is still improving its performance in order to comply with traditional geospatial data requirements and specifications. Instrumentation control, navigation and sensors are the most prominent aspects to be taken into account.
With respect to its carrying capacity, usually UAV platforms use digital non-metric camera as a main sensor especially for mapping purposes. Two days data acquisition from approximately 400 m above ground level (agl) has been performed using Skywalker Condor with wingspan 1,880 mm to cover each approximately 5 x 2.5 km area per-day.
This relatively high altitude has been selected in order to minimize the required time for the data acquisition as well as the data processing subsequently. Nevertheless, it will directly affect the geometric accuracy as further discussed in section 3.1.
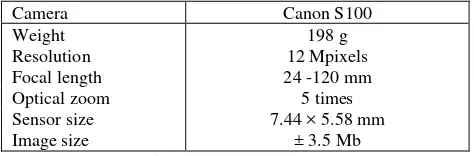
The aforementioned fuselage is capable enough to carry the digital cameras used in this project i.e. Canon S-100 (Table 1) including the necessary power sources under an extremely instable weather condition during the campaign. This acquisition captured approximately 3,200 selected full-color aerial (optical) frames with more than 85 % overlap and 45 % sidelap which can be sufficiently processed by using the photogrammetric approach.
Camera Canon S100
Weight 198 g
Resolution 12 Mpixels
Focal length 24 -120 mm
Optical zoom 5 times
Sensor size 7.44 × 5.58 mm
Image size ± 3.5 Mb
Table 1. Camera specification
2.2 Geo-referencing Procedures
There are two types of references needed for our project: For geo-referencing the UAV data we use the VHRS image
data as well as airborne IFSAR data with 1 m Root Mean Square Error (RMSE).
For checking the completeness and accuracy of the feature derived from the UAV data we use the geodetic and geodynamic control network which makes use of certain geospatial references i.e. Indonesian Geospatial Reference System (SRGI).
Based on the previous investigation presented in (Tampubolon, 2014), the geo-referencing procedure uses 2D points from Microsoft Bing in combination with globally available VHRS data which delivers the height component for the GCPs. In this context, we have used 30 GCPs by manually selecting common identified objects such as road intersection, building corner, pond, etc. For the purpose of independent validation of horizontal accuracy, additionally 15 Independent Check Point (ICP) were conducted using GNSS in sub-centimeter accuracy.
Product Type
DSM (m) DTM (m) ORRI (m)
RMSE Res. RMSE Res. RMSE Res.
Type I+ 0.5 5 0.7 5 < 2 0.625
Type I 0.5 5 0.7 5 2 1.25
Type II 1 5 1 5 2 1.25
Type III 3 5 - - - 1.25
Table 2. IFSAR Product Type (Mercer, 2009)
A conventional airborne mission using Star-3i platform has been performed in August 2011 to provide IFSAR Type II data (Table 2). A Digital Surface Model (DSM) is a representation of earth surface including manmade and natural structure above ground in three dimensional (3D) coordinates. The derived product of DSM which reflects the bare earth information is called Digital Terrain Model (DTM). In addition, the Ortho Rectified Radar Imagery (ORRI) can be produced as the ground projected object data by taking into account DSM or DTM data. With this Star-3i technology, the altitude during acquisition can be increased up to 10,000 m by still keeping the geometric accuracy in the level below 1 m. Therefore it is reasonable to use this IFSAR data as an elevation source for geo-referencing purpose.
In order to determine any significant accuracy of elevation improvement provided by the use of IFSAR DEM reference, a comparison was performed by using two different software as well as with ASTER GDEM. Subsequently, the generated DEMs have been evaluated against the ICP data and IFSAR DEM as further explained in section 3.1. At the end, the best available existing DEM will be used as the elevation reference.
2.3 Topographical Map Production
In this case, 8 themes/layers namely Shoreline/Coastline, Hypsography (DEM), Hydrography, Geographical Names (Toponym), Administrative Boundary, Transportation/Utility, Building/Public Facility, and Land Cover were defined as a base for the evaluation of UAV data.
For practical reason, only DSM has been taken into account for accuracy assessment as well as for the feature extraction The International Archives of the Photogrammetry, Remote Sensing and Spatial Information Sciences, Volume XL-3/W3, 2015
purpose since the UAV DEM originally just provided only the raw surface earth information. Based on above mentioned layering system, there are 6 selected features of interest in the context of rapid mapping namely water bodies, crops, grass lands, bare lands, mud flows and road segments. Those 6 topographic features has been manually digitized from the UAV orthophoto and used as a reference for feature extraction process as explained in section 3.2.
2.4 Feature Extraction
The aim of this paper is to extract relevant disaster-related features for supporting rapid mapping activities. In many cases, it is hard to distinct the actual disaster impact in the field. For example, if we detected a broken bridge in the UAV orthophoto, we usually consider it as the impact of the recent disaster although it is not always the case.
Therefore in this paper, there are two approaches introduced for the feature extraction purpose. The first approach uses geometrical analysis on time series topographical data while the second implements unsupervised classification from UAV data (Li, 2008). The combination between those two approaches aims its way to extract affected objects in a simple implementation but accurate enough for large scale topographical mapping requirements as discussed in 3.1.
Basically, the main reason for using the best available DEM as explained in 2.2 about the elevation reference is the 3 D analysis requirement to detect geometrical changes between different data acquisition. In other words, we want to ensure that the DEM differences between IFSAR and UAV data reflects geometrical changes from different acquisition over time. However, for rapid mapping activities, it is necessary to detect only changes due to the disaster occurrence.
Our approach for feature extraction has four key steps. First, we extracted a gridded DEM of UAV DEM and IFSAR DEM in 10 cm resolution for the smaller study area (350 x 450 m) and calculated the differences. Second, we took the 3D elevation accuracy from the assessment as explained in section 3.1, classified the DEM differences based on elevation accuracy and submitted this value set to the unsupervised classification. Third, the parameters of the fuzzy classes i.e. seed file were used to classify all cells on the basis of their brightness value thereby creating classified topo-disaster class maps of smaller contiguous areas. Fourth, we compared a manually classified data with the unsupervised classification result in order to evaluate the usefulness of the seed file as a starting predictor of classification types.
For that purpose, we compare three different approaches for unsupervised classification, namely Isodata, K-Means and Fuzzy K-Means. More detailed results will be discussed in section 3.2. Unsupervised classification has been selected because it can reduce field measurement and ground truth data which are difficult to get during disaster period.
Main difference between K-Means and Fuzzy K-Means extrapolation capability for other extended area of interest.
3. RESULTS AND DISCUSSIONS
In this section, we will describe the rapid mapping outputs namely the evaluation of the DEM (3D) and the feature extraction (2D). For UAV data processing two different image/photo processing software systems have been used. The first one is PCI Geomatics which concentrates on photogrammetric techniques for conventional aerial or satellite data processing. The other software is Agisoft Photo Scan which is relatively new to the market focusing on computer vision technology approaches.
The selected Ground Sampling Distance (GSD) for orthopotos is 10 cm while 20 cm for DEM. This resolution allows optimal zooming for manual interpretation and therefore high accuracy can be reached for providing 2D reference data in feature extraction evaluation.
3.1 Accuracy Assessments
With respect to the geometric accuracy, the National Standard for Spatial Data Accuracy (NSSDA) has been selected for geospatial positioning accuracy (FGDC, 1998). The main idea behind this method is the detection of blunders from a given data set and the derivation of a statistical model. In this case, Root Mean Square Errors (RMSE) can be used to estimate the absolute accuracy.
The RMSE can be calculated by the following equation (FGDC, 1998) for each corresponding object in the different datasets i.e. between the UAV data and the reference data. The calculation
RMSEx = Root Mean Square Error in x axis direction
RMSEy = Root Mean Square Error in y axis direction
RMSEr = Horizontal (2D) Root Mean Square Error
RMSEZ = Vertical (3D) Root Mean Square Error
(XRei, YRei, ZRei) = Coordinates of check-points i in the
reference dataset
(XChecki, YChecki, ZChecki) = Coordinates of check-points i in
the UAV dataset
Accuracy assessment for the 2D (planimetric) component has considered 15 ICPs covering the test area provided from GNSS survey. On the other hand, for the DEM accuracy evaluation the height of all grid points (3648) of the derived UAV DEM have been compared with the IFSAR DEM including 15 ICPs as well. Obviously, the accuracy assessment shows that there is a significant improvement if we are using IFSAR data as the elevation reference.
Software Planimetric Accuracy (m)
Elevation Accuracy (m) ASTER
GDEM
IFSAR Type II Agisoft Photo Scan 2.533 94.554 50.711
PCI Geomatics 1.465 9.352 5.082
Table 3. Accuracy assessment
The significant elevation accuracy differences between Agisoft Photo Scan and PCI Geomatics is presumably caused by the higher altitude i.e. approx. 400 m (agl). Since Agisoft Photo Scan is designed for small range photogrammetry, the algorithm is sensitive to the height / distance to the reconstructed object.
For instance, in Agisoft Photo Scan, there is a separation between arbitrary and height field reconstruction scheme. This was also confirmed by the previous investigation in the lower altitude i.e. approx. 200 m (agl) which indicated the better elevation accuracy of Agisoft Photo Scan.
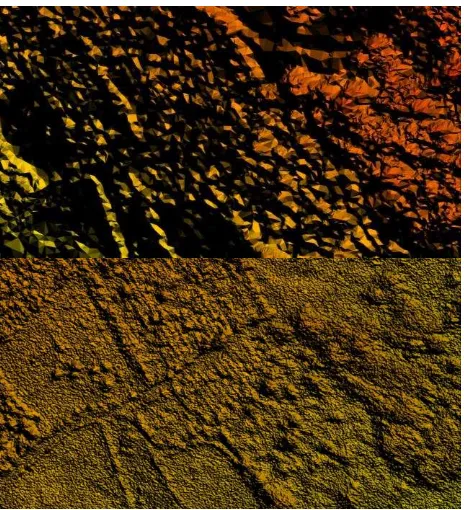
In addition, this result also agreed with a visual comparison of different DEM outputs (Figure 3). Not only the DEM details but also the height references are not comparable.
Figure 3. UAV DEM in 20 cm GSD of Sukameriah village: Agisoft Photo Scan (upper) and PCI Geomatics (lower)
A comparison between IFSAR and UAV DEM can identify the suspected area of impact i.e.mud flow areas. It is important to define the geometrical accuracy threshold which comes from the best elevation accuracy assessment in Table 3, i.e. 2.593 m (RMSE) or 5.082 (95% accuracy).
Referring to above mentioned geometrical accuracy threshold, the deviations between IFSAR and UAV DEM can be grouped into 5 different classes namely no changes (-2.593 – 2.593 m), 95% negative changes (-5 - -2.593 m), 95% positive changes (2.593 – 5 m), 100% negative changes (< -5 m), 100 % positive changes (> 5 m) as seen in Figure 4.
As an example, the DEM difference classification can identify that the disconnected road segment lays within no changes area and therefore not occurred in the period between IFSAR (10 August 2011) and UAV data acquisition (8 December 2013).
Figure 4. Discrepancies between UAV and IFSAR DEM
3.2 Disaster-related Object Extraction
As already explained in section 2.4, feature extraction in this paper combines the geometrical accuracy and image classification interactively. Geometrical accuracy is the pre-requisite for performing 3 D analysis on high resolution time series data.
Based on the DEM difference classification, we defined 100% positive changes location where the deviation indicates 3D changes after the disaster as the seed file data i.e. red colors in Figure 4. This area can be presumably predicted as the relevant mud flow covered area in post disaster situation.
Before it is possible to proceed further, a visual inspection from DEM visualization is an initial start by synchronizing the ground truth data to ensure correctness of seed file in the field (Figure 5). In this step, the blunder errors in seed file data can be detected and removed manually.
Afterwards, the initial unsupervised classification without any seed file data has been performed to classify 7 different classes namely water bodies, crops, grass lands, bare lands, mud flows, road segments and the remaining unclassified area.
This initial unsupervised classification result was also used to check the validity of the seed file data. If the seed file data lay beneath non mud flows area, then it will be removed. At the end, the valid seed data come as the final result based on the DEM analysis as well as from the first initial unsupervised classification.
The valid seed file data then submitted to the final unsupervised classification in order to improve the result. From this point, the disaster-related features have been extracted from the final unsupervised classification result.
Figure 5: 3 D Field verification (upper: field survey, middle: Agisoft Photo Scan, lower: PCI Geomatics)
Finally, the intersection between unsupervised classification results with the reference data can be performed in order to assess the feature extraction accuracy. In this case, manual interpretation from UAV aerial photographs in 10 cm resolution has been considered as the reference data.
Classes / Segments
Manual
Interpretation Fuzzy K-Means
Isodata K-Means
Area (m2
) % Area (m2
) Acc. Area (m2
) Acc. Area (m2
) Acc. Others 400.09 0.45% 3271.83 12% 4768.98 8% 698.04 57% Water bodies 382.42 0.43% 2731.63 14% 12754.46 3% 6692.46 6% Crops 39562.81 44.82% 23717.22 60% 23054.80 58% 26753.21 68% Grass lands 37121.01 42.06% 36990.16 99.6% 24744.93 67% 38143.33 97% Bare lands 687.93 0.78% 7743.58 9% 14321.91 5% 12735.81 5% Mud flows 8938.59 10.13% 12935.65 69% 6692.72 75% 2807.54 31% Road segments 1170.05 1.33% 857.13 73% 1909.40 61% 416.81 36% Total 88262.90 100 % Average 48% Average 40% Average 43%
Table 4. Feature extraction without Seed file data
From the comparison between Table 4 and Table 5, the seed file information can significantly improve the unsupervised classification accuracy up to 91 % for mud flows feature extraction purpose. On the other hand, the combination with DEM analysis improves the unsupervised classification
accuracy especially for road feature extraction which can achieve 73% accuracy using Fuzzy K-Means algorithm.
Classes / Segments
Manual
Interpretation Fuzzy K-Means Isodata K-Means
Area (m2
) % Area (m2
) Acc. Area (m2
) Acc. Area (m2
) Acc. Others 400.09 0.45% 4743.63 8% 2838.84 14% 434.03 92% Water bodies 382.42 0.43% 2641.82 14% 12565.62 3% 6732.35 6% Crops 39562.81 44.82% 22388.08 57% 23488.31 59% 27464.04 69% Grass lands 37121.01 42.06% 37575.78 99% 25128.06 68% 37353.61 99% Bare lands 687.93 0.78% 10217.62 7% 9865.62 7% 9545.96 7% Mud flows 8938.59 10.13% 9843.11 91% 12580.80 71% 6276.51 70% Road segments 1170.05 1.33% 853.55 73% 1796.32 65% 457.12 39% Total 88262.90 100 % Average 50% Average 41% Average 55%
Table 5. Feature extraction with Seed file data
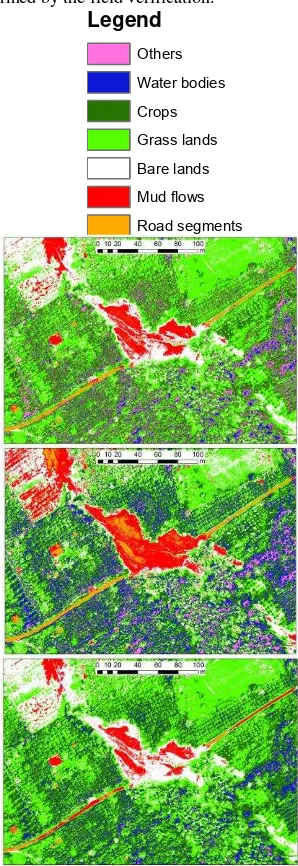
Fuzzy K-Means classification showed relatively better feature extraction result than others as we can see in Figure 6. Road segments and mud flows region which are the major interest of disaster-related features can be extracted with the most accurate result confirmed by the field verification.
Legend
Others Water bodies Crops Grass lands Bare lands Mud flows Road segments
Figure 6: Classification Results (upper: Fuzzy K-Means, middle: Isodata, lower: K-Means)
4. CONCLUSIONS
UAV is of high potential and useful to support rapid mapping activities in terms of accuracy and flexibility. Its high resolution can be turned into proper higher accuracy by mean of integration with existing geospatial data i.e. airborne IFSAR data to map the disaster area immediately.
Topographic maps with absolute NSSDA (95%) of 1.5 m (accuracy) can be produced by geo-referencing of UAV data with optical space borne data. It provides relatively inexpensive measures in order to generate orthophotos sufficient enough for 1:5,000 Large Scale Topographical Mapping requirements in Indonesia.
Feature extraction has been performed by combining DEM analysis and unsupervised classification in order to get more accurate result. Fuzzy K-Means unsupervised classification indicates the better performance compared to the others for the purpose of disaster-related feature extraction. Hence, the unique combination of UAV and airborne IFSAR data acquisition from different time presented rapid mapping activities with full photogrammetric approach in order to provide meaningful result especially in mud flows (lava) object detection.
ACKNOWLEDGEMENTS
We would like to acknowledge Geospatial Information Agency of Indonesia (BIG) for providing the Airborne IFSAR dataset type II, access to the GPS reference station (CORS) during the campaign over the disaster area and necessary processing software licenses i.e. PCI Geomatics and Agisoft Photo Scan.
REFERENCES
FGDC, 1998. Geospatial Positioning Accuracy Standards Part 3: National Standard for Spatial Data Accuracy (version 2.0), Washington, D.C., FGDC-STD-001-1998: Federal Geographic Data Committee, pp.3-4.
Li, Y., 2008. Vehicle extraction using histogram and genetic based fuzzy image segmentation from high resolution UAV aerial imagery. The International Archives of the Photogrammetry, Remote Sensing and Spatial Information Sciences. Vol. XXXVII. Part B3b., pp.529–533.
Mercer, B., 2009. Countrywide Coverage of RADAR DTMs – The Intermap Approach. Photogrammetric Week 2009, Stuttgart, Germany.
Percivall, G., Alameh, N., Moe, K.., and Evans, J., 2012. Strengthening disaster management using Earth Observations - GEOSS and CEOS activities, Geoscience and Remote Sensing Symposium (IGARSS), IEEE International, pp.3525-3528.
Rahmani, M. K., Pal, N., and Arora, K., 2014. Clustering of Image Data using K-Means and Fuzzy K-Means, International Journal of Advanced Computer Science and Applications. Vol. 5. No.7., pp.160-163.
Schneiderhan, Tobias, et al., 2010. Insights to the Emergency Mapping Service within the GMES project SAFER – Highlights, main achievements and challenges. In: Living Planet Symposium, Bergen, Norway.
Tampubolon, W., and Reinhardt, W., 2014. UAV Data Processing for Large Scale Topographical Mapping, Int. Arch. Photogramm. Remote Sens. Spatial Inf. Sci., XL-5, pp.565-572. The International Archives of the Photogrammetry, Remote Sensing and Spatial Information Sciences, Volume XL-3/W3, 2015