MONITORING IONOSPHERIC VARIATION FOR A DEFINITE PERIOD TIME IN
TURKEY
S. Inyurt a, *, C. Mekik a, O. Yildirim b
a BEU, Engineering Faculty, Geomatics Engineering Department 67100 Zonguldak, Turkey - (samed.inyurt,
cetinmekik)@beun.edu.tr
b GOP, Faculty of Natural Sciences and Engineering, Geomatics Engineering Department 60150 Tokat, Turkey –
SMPR 2015
KEY WORDS: Ionosphere, Total Electron Content, GNSS
ABSTRACT:
Ionosphere has been studied by a number of scientists in recent years. Since GPS observations cannot provide TEC value directly, it can be estimated from combination of observations. In this study TEC values derived from GPS observations were produced variations with two hours increments from the eighth day to fifteenth day in months just after beginning of each season, namely January, April, July and October in 2014 for ZONG TUSAGA-Aktif station and 41 other stations (TUSAGA-Aktif, EUREF, IGS). TEC values computed by the Bernese 5.0 software were compared with the Global Ionosphere Model (GIM) TEC values regularly published by Center for Orbit Determination in Europe (CODE) and International Reference Ionosphere (IRI-2012) TEC values. As a result of this study, with the comparison of GPS TEC values to GIM TEC values, it has become obvious that GPS TEC values are quite similar to the GIM TEC values. The differences of TEC values derived from GPS TEC and GIM TEC change from 0.91 TECU (January) to 1.88 TECU (October). On the other hand, GPS TEC values are also compared with IRI TEC values, and found out that there is a considerable difference between the two TEC values ranging from 6.30 TECU (January) to 15.15 TECU (April). numerous fields especially related to satellite-based radio navigation system for a long time. Ionosphere, one of the upper atmosphere layers ranges from 60 km to 1500 km, is a dispersive medium, and includes a number of free electrons and ions (Petrie et al., 2011). A signal coming from a satellite to a receiver is affected by this ionization and this is named as group delay (or phase advance) briefly. The ionization is not only subject to the sun and its activity but also to seasonal, diurnal variations and geographical location (Namgaladze et al., 2012). Total Electron Content (TEC), also called Slant Total Electron Content (STEC), is a parameter that changes in relation to ionospheric conditions, and has a highly variable structure. Furthermore, Vertical TEC (VTEC) can be referred to as TEC value in the direction of zenith, and can be modelled by means of VTEC. TEC is measured in units of TECU and 1TECU= ᇾ10ᇿ^16 electrons/m^2(Liu and Gao, 2004).
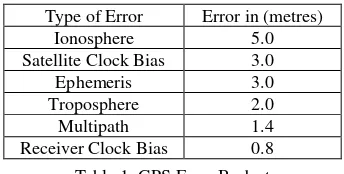
GPS signals have been affected many parameters such as ionospheric and tropospheric affect, signal multipath, receiver clock bias, ephemeris, satellite clock bias
.
Furthermore, ionospheric and tropospheric affect, signal multipath, receiver clock bias, ephemeris, satellite clock bias.Type of Error Error in (metres)
Ionosphere 5.0 Among these factors there is no doubt ionospheric affect has the greatest impact on GPS signals. Therefore, this factor should be modelled somehow to enhance GNSS accuracy of positioning.
2. METHODOLOGY AND APPLICATION
Ionosphere has greatest effect on GNSS signal. TEC is a function of ionosphere which affects accuracy of positioning. İf we obtain TEC value correctly, we can calculate ionospheric effect on GNSS signal truly. GNSS measurements which include code and phase measurement help us to determine TEC value correctly. Simple equation can be written as below for dual frequency receivers.
The International Archives of the Photogrammetry, Remote Sensing and Spatial Information Sciences, Volume XL-1/W5, 2015 International Conference on Sensors & Models in Remote Sensing & Photogrammetry, 23–25 Nov 2015, Kish Island, Iran
This contribution has been peer-reviewed.
(1)
(2)
Equations (1) and (2) are current for code measurements;
Where = Code measurements
= True distance between satellite and receiver c= speed of light in a vacuum
= Clock error of satellite and receiver Ionospheric affect
Tropospheric affect
Code delay of instrument bias for satellite
= Code delay of instrument bias for receiver
: Residuals in GNSS measurement.
Equation (3) and (4) are expressed for carrier phase measurements as below
(3)
(4)
Where = True distance between satellite and receiver = Clock error of satellite and receiver c= speed of light in a vacuum
Ionospheric affect Tropospheric affect
= Phase advance of instrument bias = ambiguity of the carrier phase
= Residuals in GNSS measurement.
We obtain STEC (Slant Total Electron Content) using difference of dual frequency GNSS phase and code measurements
(5)
After obtaining STEC value, we attain VTEC (Vertical Total Electron Content) using SLM (Single Layer Model). It is assumed that all free electrons in the ionosphere are concentrated in an infinitesimal thickness at 300-450 km altitude where the electron density reaches maximum level.
(6)
Where R= earth radius,
H= thin shell height of the ionosphere z= satellite’s zenith angle.
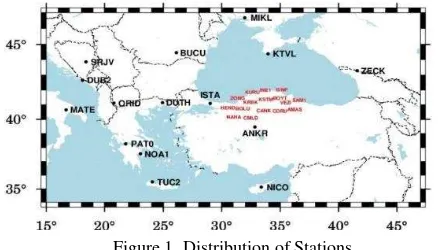
In this study we have used 41 GPS stations which are located various countries. While 16 of them belong to Continuously Operating Reference System (CORS-TR) stations, the other stations are EPN and IGS stations. Distribution of stations is as Figure 1. CORS-TR RINEX data is downloaded URL-1, IGS
and EPN RINEX data are attained URL-2 and URL-3 respectively.
Figure 1. Distribution of Stations
We produced TEC values using Bernese 5.0v program with two hours increments from eighth day to fifteenth day in January, April, July and October 2014. We also obtained Global ionosphere model (GIM) TEC values published by Center for Orbit Determination in Europe (CODE) and International Reference Ionosphere TEC (IRI-2012). While black label shows our results (GPS), green and red labels indicate IRI and GIM results respectively in Figure 2.
Figure 2. TEC values derived from GPS, IRI and GIM are produced with two hours increments from eighth day to
fifteenth day in January, April, July and October 2014
The International Archives of the Photogrammetry, Remote Sensing and Spatial Information Sciences, Volume XL-1/W5, 2015 International Conference on Sensors & Models in Remote Sensing & Photogrammetry, 23–25 Nov 2015, Kish Island, Iran
This contribution has been peer-reviewed.
Figure 3. 8-15 January, April, July, October 2014 TEC Values Differences
We produce mean TEC values which derived from GPS, GIM and IRI-2012 for every two hours to monitor differences of TEC values. Blue label shows our results, red and green labels indicate IRI-2012 and GIM TEC values respectively. Figure-3 presents all results and we clearly see that there is similarity between GPS and GIM TEC values. Another thing is that IRI-2012 TEC values is lower than our results
.
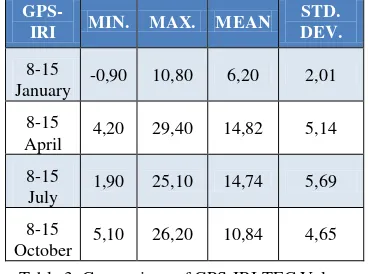
To investigate our results’ difference from GIM and IRI TEC values, we take GIM TEC and IRI TEC as reference TEC values and analyse separately for 8-15 January, April, July and October 2014. Table-2 and Table-3 give information about minimum difference, maximum difference, mean difference and standard deviation. When results are examined, we understand that
Table 2. Comparison of GPS-GIM TEC Values
GPS-Table 3. Comparison of GPS-IRI TEC Values
In this study we also determined differences’ RMS values using mean GPS, GIM and IRI-2012 TEC values. While biggest difference is seen in 8-15 April 2014 between GPS and IRI-2012, smallest difference is observed in 8-15 January 2014. On the other hand our results is compared with GIM TEC values, biggest variation is determined in 8-15 October 2014, smallest variation is defined in 8-15 January 2014. Figure-4 gives numerical information about differences’ RMS. Blue label indicates GPS-IRI comparisons, orange label shows GPS-GIM TEC value differences’ RMS values for 8-15 January, April, July and October 2014 in Turkey.
Figure 4. Differences between RMS values
3. CONCLUSION
In the last years ionosphere has been studied intensely by researchers. A signal which comes from satellite to receiver has been affected many factors. In this study TEC values derived
The International Archives of the Photogrammetry, Remote Sensing and Spatial Information Sciences, Volume XL-1/W5, 2015 International Conference on Sensors & Models in Remote Sensing & Photogrammetry, 23–25 Nov 2015, Kish Island, Iran
This contribution has been peer-reviewed.
clearly seen that our TEC values show good agreement with GIM, but our results has a huge difference from IRI-2012 TEC values. This situation may derive from that there is no ionosonde station in Turkey and this deficiency may affect accuracy of TEC value in Turkey.
REFERENCES
Liu Z and Gao Y., 2004. Ionospheric TEC Predictions Over A Local Area GPS Reference Network, GPS Solutions 8:23–29.
Hawarey M. and Ayan T., 2004. Uzay Mekiği Tırmanışı, Deprem ve Füze Fırlatılışından Kaynaklanan TEC Değişimlerinin GPS ile Belirlenmesi, Doktora Tezi, İstanbul pp:18-31.
Namgaladze A. A., Zolotov O V, Karpov M I and Romanovskaya Y. V., 2012. Manifestations of the Earthquake Preparations in the Ionosphere Total Electron Content Variations, Natural Science, Vol.4, No.11, 848-855.
Norsuzila Y., Abdullah M., Ismail M., Ibrahim M. and Zakaria Z., 2010. Total Electron Content (TEC) and Estimation of Positioning Error Using Malaysia Data, Proceedings of the World Congress on Engineering 2010 Vol I WCE 2010, June 30 - July 2, 2010, London, U.K.
Petrie E. J., Hernandes-Pajares M., Spalla P, Moore P. and King M. A., 2011. A Review of Higher Order Ionospheric Refraction Effects on Dual Frequency GPS, Surv Geophys 32:197–253.
URL-1, 2014. http://212.156.70.42/.
URL-2, 2014. ftp://igs.bkg.bund.de/IGS/obs/.
URL-3, 2014. ftp://igs.bkg.bund.de/EUREF/obs/.
The International Archives of the Photogrammetry, Remote Sensing and Spatial Information Sciences, Volume XL-1/W5, 2015 International Conference on Sensors & Models in Remote Sensing & Photogrammetry, 23–25 Nov 2015, Kish Island, Iran
This contribution has been peer-reviewed.