A SIMPLE AND EFFECTIVE RETRIEVAL OF LAND SURFACE TEMPERATURE
USING A NEW REFLECTANCE BASED EMISSIVITY ESTIMATION TECHNIQUE
Y. Nithiyanandam a, *, J. E. Nichol b
a
Department of Natural Resources, TERI University, New Delhi, India - [email protected] b
Department of Land Surveying and Geo-Informatics, The Hong Kong Polytechnic University, Kowloon, Hong Kong - [email protected]
Commission, WG VIII/5
KEY WORDS: Land surface temperature, Emissivity, ASTER, Urban Heat Island, Hong Kong, TES
ABSTRACT:
Emissivity is a significant factor in determining land surface temperature (LST) retrieved from the thermal infrared (TIR) satellite images. A new simplified method (reflectance method) for emissivity correction was developed in this study while estimating emissivity values at a spatial resolution of 30 m from the radiance values of the SWIR image. This in turn enables mapping surface temperatures at a much finer spatial resolution (30 m). Temperatures so estimated are validated against surface temperatures measured in the ground by thermocouple data loggers recorded during satellite overpass time. In this study, surface emissivity values are derived directly from the AST_ L1B images. The reflectance method estimates temperature at higher spatial resolution of 30 m when compared to the 90 m spatial resolution of TES and reference channel methods. Temperature determined for the daytime image of 30th November 2007 using different emissivity techniques was compared with the temperatures measured on the field using thermocouple data loggers. It is observed that the estimates from the reflectance method are much closer to the field measurements than the TES and reference channel methods. The temperature difference values range from 0.2 to 2.3 oC, 0.15 to 5.6 oC, and 2.6 to 8.6 oC for the reflectance method, normalization method and reference channel method, respectively. The new reflectance emissivity techniques i.e. reflectance method exhibits the least deviation from the field measured temperature values. While considering the accuracy of data logger (1 oC) the reflectance method enables one to map surface temperature precisely than other two methods.
1. INTRODUCTION
The world is undergoing an unprecedented rate of urbanisation.
By the year 2030, the world’s urban population is likely to rise
to 5 billion (United Nations Population Fund, 2014) from 3.9 billion,with the maximum concentrations being in Asia and in Africa. About 70% of word energy is consumed in urban areas,
which accounts for around 2% of the world’s land surface.
Energy consumption in urban areas correlates positively with changes in urban micro-climate which contributes to raised air compared to rural areas (Voogt and Oke, 2003), with the temperature differences generally being between 1 and 3 oC (United States Environmental Protection Agency, 2013), although difference of up to 12 oC have been reported (Roth et al., 1989). The phenomenon of increasing temperature in urban areas than its surrounding rural area is called Urban Heat Island (UHI). The magnitude of UHI in cities depends on the changes in natural heat balance due to increased anthropogenic activities within urban area. The UHI intensity can be precisely mapped by estimating Land Surface Temperature (LST) through thermal remote sensing satellite images.
In recent years, several studies estimated LST using the remote sensing technique. Roth et al., (1989) note that the first satellite-based UHI study was conducted in the Eastern United States of America using data from the Improved Television Infrared Observation Satellite Program (ITOS-1) with its sensor being used as a thermal scanning radiometer, with a resolution of 7.4 km. Subsequently, in their study of 50 cities in the US, Carlson and Boland (1978) used the National Oceanographic and Atmospheric Administration (NOAA-3-5) satellite carrying the Very High Resolution Radiometer (VHRR) sensor with a
resolution of 1 km. Later, Landsat and ASTER (Advanced Spaceborne Thermal Emission and Reflection Radiometer) satellites were used in UHI studies (Nichol, 2005; Nichol, 2009). Landsat ETM+(Enhanced Thematic Mapper) has 7 spectral bands, with its spatial resolution ranging between 15 and 60 m and a 185 km image swath while ASTER has 14 spectral bands straddling the visible to the thermal infrared ranges with 15 to 90 m spatial resolution and a 60 km image swath. ETM+ has thermal bands at 60 m with better spatial
resolution compared to ASTER’s 90 m but, since 2003, the
usage of ETM+ has been limited due to a scan line corrector (SLC) problem. Also, more bands in thermal infrared region
enables ASTER’s sensitivity to land surface temperature
compared with Landsat.
Most of the emissivity estimation techniques are complex while others are simple but ineffective. The sophisticated algorithms are at coarse resolutions that are inadequate to account heterogeneous surface characteristics of the cities, and may not valid for all par ts of the world. Meanwhile, the simple algorithms result in under or overestimation of LST. The Temperature Emissivity Separation (TES) method is used in several studies, and also in preparation of standard data product of Advanced Spaceborne Thermal Emission and Reflection
Radiometer (ASTER)’s land surface emissivity (AST_05). The
TES algorithm estimates emissivity at 90 m spatial resolution is considered too coarse for a complex urban environment, which may not be suitable for the typical morphometric conditions of Hong Kong. Therefore, a new simplified method (reflectance method) for emissivity correction was developed in this study while estimating emissivity values at a spatial resolution of 30 m from the radiance values of the SWIR image. This differs from previous studies in Hong Kong most of which used a simplified method for adopting typical emissivity values of urban materials. Among the three methods used, TES algorithm is commonly used in recent studies, reference channel is the oldest technique and reflectance method developed in the study. The reflectance method works better than the other two methods while estimating temperatures. The reflectance method estimates temperature at higher spatial resolution of 30 m when compared to the 90 m spatial resolution of TES and reference channel methods. Temperature determined for the daytime image of 30th November 2007 using different emissivity techniques was compared with the temperatures measured on the field using thermocouple data loggers. It is observed that the estimates from the reflectance method are much closer to the field measurements than the TES and reference channel methods. A new technique is used in this study to calculate emissivity values at a higher spatial resolution than the thermal image. This in turn enables mapping surface temperatures and flux values at a much finer spatial resolution (30 m). Temperatures so estimated are validated against surface temperatures measured in the ground by thermocouple data loggers recorded during satellite overpass time. Field Temperature measurements were carried out in 10 different locations in Kowloon Peninsula of Hong Kong.
2. METHODOLOGY
The main steps in land surface temperature and emissivity measurements using satellite imagery are described below
2.1 Image Pre-processing
The satellite image pre-processing usually comprises a series of
sequential operations: atmospheric correction, image registration, geometric correction, and masking. The ASTER Level 1B images used in this study are produced by applying radiometric calibration, atmospheric and geometric corrections to the Level- 1A (unprocessed instrument data) image as described below. The individual channels of AST_L1B images are extracted using the HEG (HDF-EOS to Geo TIFF) conversion tool.2.2 Conversion of digital number (DN) to spectral radiance
The at sensor radiance values at different wavelengths are stored as digital numbers (DN) for convenience during data storage and transfer (Appendix 1). The DN values are converted into spectral radiance values using the following equation
Lrad, x = UCCx (DNx - 1) (1)
where Lrad is the spectral radiance of band x, and UCCx is the
unit conversion coefficient of band x
The UCC value for each band represents the gain setting used during image acquisition, which can be known from the header file associated with AST_L1B (refer Appendix 1).
2.3 Recalibrating ASTER Thermal Infrared Images
ASTER thermal infrared radiance (TIR) products include information on radiometric calibration errors caused by delays while updating the radiometric calibration coefficients (RCC) (Tonooka, 2003). The images processed after 8th February 2006 were calibrated using version 3.x. The RCC values (Tonooka, 2003) were inserted into Equation 2 to calculate RCC corrected radiance values.
New radiance = A × Original radiance + B (W/m2/Sr/μm)
(2)
where A and B are the RCC values that depend on the day since launch.
2.4 Land surface temperature (LST) estimation
The process of estimating land surface temperature (LST) using TIR images involves two steps: a) converting spectral radiance to at-sensor Brightness Temperature (BT) and b) correcting for surface emissivity. Band 13 (10.25 to 10.95 µm) among the five TIR bands (Band 10 to 14) is used to compute LST because the spectral width of band 13 is close to the peak radiation of the blackbody spectrum emitted by urban surfaces (Lu and Weng, 2006; Weng et al., 2008).
The steps for deriving LST are:
a) The thermal band (Band-13) is converted from at-sensor spectral radiance to at-at-sensor BT, assuming that
the Earth’s surface is a black body (i.e., spectral
emissivity equals 1) and atmospheric effects (absorption and emission along the path) have been taken into account (Chander et al., 2009). The conversion formula for estimating at-sensor BT from at-sensor spectral radiance is:
(3)
where BT is at-sensor Brightness Temperature (K), L
λ is RCC corrected at-sensor radiance, and KA1(866, W/ m2 sr µm) and KA2 (1350.069147, K) are the prelaunch calibration constants of ASTER TIR bands.
b) Since the measured LST values are referenced to a black body, it is necessary to correct for spectral emissivity with respect to the thermal properties of the urban surface material in question. The emissivity corrected LST (Tec) are calculated using the following equation (Artis and Carnahan, 1982; Weng et.al., 2008)
(4)
Band 13 (10.657 µm) may be taken from the ASTER user handbook), BT is the at-sensor brightness temperature calculated using Equation 3, and the flux density (ρ) = [h × (C /σ)] = 1.438× 10⁻² m K, where, h
is Planck’s constant (6.626 ×10⁻³⁴
J s), C is the velocity of light (2.998 ×10⁸ m s-1), σ is Boltzmann constant (1.38 × 10⁻²³ J K-1), and s is the surface emissivity estimated from the method described in Section 3.1.
2.5 Surface emissivity estimation
In this study, surface emissivity values are derived directly from the AST_ L1B images. This differs from previous studies in Hong Kong most of which used a simplified method for adopting typical emissivity values of urban materials (Nichol, 2009). The standard product of ASTER’s land surface emissivity (AST_05) is derived using the Temperature Emissivity Separation (TES) method (Gillespie et al., 1998). The TES algorithm estimates emissivity at 90 m spatial resolution, which may not be suitable for the typical morphometric conditions of Hong Kong. Therefore, a new simplified method (reflectance method) for emissivity correction was developed in this study while estimating emissivity values at a spatial resolution of 30 m from the radiance values of the SWIR image. The next subsection compares the emissivity values estimated from the three methods and identify the most suitable. Among the three methods, TES algorithm is commonly used in recent studies and reference channel is the oldest technique. The reflectance method developed in the study, works better than the other two methods while estimating temperatures. The reflectance method estimates temperature at higher spatial resolution of 30 m when compared to the 90 m spatial resolution of TES and reference channel methods.
2.5.1 TES algorithm: The TES algorithm of Gillespie et al. (1998) normalizes the emissivity spectrum which devised for sensors with thermal band such as ASTER using the average emissivity for each pixel. The min-max difference (MMD) of the normalized spectrum is first calculated and used for estimating the minimum emissivity by means of a regression analysis relating the MMD and the minimum emissivity (ASTER higher-level product guide). The normalized emissivity values are scaled using the minimum emissivity value and compensated for reflected skylight by applying the procedure described in the algorithm along with the theoretical documents of ASTER.
2.5.2 Reference Channel method: This method (Kahle et al., 1980) is used to calculate the emissivity and temperature values from thermal infrared radiance data. The reference channel emissivity technique assumes that all emissivity values are the same for all the pixels in one channel (band) of the thermal infrared data. Using this constant value, a temperature image is calculated. The results are used to calculate the emissivity values in all other bands using the Planck function.
2.5.3 Emissivity retrieval using new reflectance method: In this method, surface emissivity values are derived from the reflectance values of the ASTER SWIR band. Band - 5 (2.145 to 2.185 µm) is selected among other SWIR bands, due to the smaller atmospheric interference at the SWIR region (ASTER higher-level product guide). Hence, the radiance measured at this wavelength is taken as the representative value of surface radiance provided one does not attempt to minimize the impacts
from the atmosphere. According to Kirchhoff’s law of thermal
radiation, R ꞊ 1 - ɛ, the emissivity of an object is equal to its observance at the same temperature (Nicodomus, 1995). Since the emissivity values of objects on the earth cannot exceed one (the maximum emissivity for a blackbody), the reflectance, R, is calculated by subtracting the dimensionless emissive power from 1, i.e., ɛ = 1 - R.
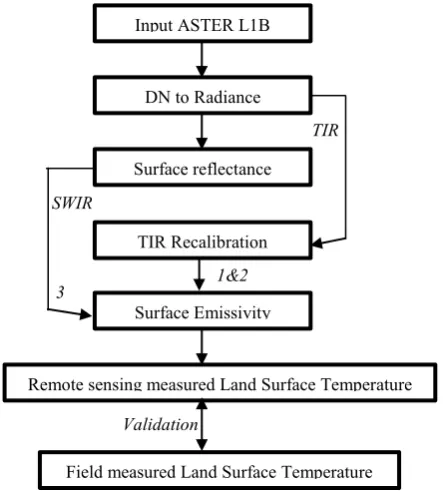
Figure 1 represents the methodology of this study in detail. Where number 1, 2, and 3 used in figure 1 represents TES method, Reference Channel method, and Reflectance method respectively, used for estimating surface emissivity in this study.
3. RESULTS AND DISCUSSION
3.1 Surface emissivity
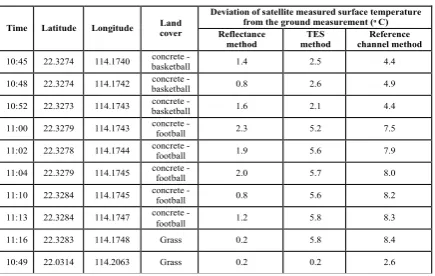
Temperature determined for the daytime image of 30th November 2007 using different emissivity techniques was compared with the temperatures measured on the field using thermocouple data loggers. Figure 2 shows the difference between satellite measured surface temperature and those measured using thermocouple data loggers. It is observed that the estimates from the reflectance method are much closer to the field measurements than the TES and reference channel methods. The temperature difference values range from 0.2 to 2.3 oC, 0.15 to 5.6 oC, and 2.6 to 8.6 oC for the reflectance method, normalization method and reference channel method, respectively. The new reflectance emissivity techniques i.e. reflectance method exhibits the least deviation from the field measured temperature values.
While considering the accuracy of data logger (1 oC) the reflectance method enables one to map surface temperature precisely than other two methods. In the present study, the temperatures measured at 10 locations are used as reference values in a manner including homogenous (at least 90 m × 90 m) concrete and grassy surfaces. The measurement period was ±
Figure 1. Represents methodology of this study Input ASTER L1B
Image
DN to Radiance
TIR Recalibration
Remote sensing measured Land Surface Temperature Temperature
Surface Emissivity
Field measured Land Surface Temperature Surface reflectance
TIR
SWIR
1&2 21 a 3
15 minnutes to the satellite overpass time. The details of measurement location is given in Table 3.1. The new reflectance emissivity method works well over concrete and grass surfaces.
Figure 2. Temperatures measured using three different emissivity techniques. The measurement was carried out at two
different surfaces during the image overpass time.
Table 3.1. Difference between Satellite measured (Applied different emissivity technique) and field measured temperature
and the detail of measurement locations
4. CONCLUSION
A new emissivity technique (reflectance-based method) developed in this study maps surface temperature at a spatial resolution of 30 m. The method is simple yet effective for various applications based on surface emissivity. The new reflectance based emissivity estimation works well with
complex Hong Kong’s urban environment. It helps to map
accurate emissivity intrinsically at near real-time with simple estimation technique. This contributes mapping surface temperature at finer resolution which is required for understanding complex thermal urban environment of Hong Kong. Understanding thermal environment will help planners, policy makers, and public to effectively mitigate urban heat island and other thermal impacts on human health and comfort.
The study do have few limitations. The emissivity estimated through remote is not directly compared with emissivity meter readings, indeed impossible to measure emissivity of all urban features. Therefore, validating emissivity through measuring surface temperature is preferred in this study. The number of field measurements used for validating this algorithm was limited due to the complexity in conducting field survey at real time during satellite overpass in Hong Kong. The new algorithm can further be improved by considering more ground reference points representing the temperature of various surface covers. The new algorithm can also be applied to other thermal
satellite sensors in Landsat 8 and MODIS satellite. The limitations of this study provide scope for author's future research in this area.
ACKNOWLEDGEMENT
This research is a part of author’s Ph.D. thesis submitted to the
Hong Kong Polytechnic University. Author sincere thank the Hong Kong Ph.D. Fellowship Scheme for supporting his Ph.D. study.
REFERENCES
Artis, D.A., & Carnahan, W.H. (1982). Survey of emissivity variability in thermography of urban areas. Remote Sensing of Environment, 12, 313-329.
Carlson, T.,N., & Boland, F.,E. (1978). Analysis of Urban-Rural Canopy Using a Surface Heat Flux/Temperature Model. Journal of Applied Meteorology, 17, 998-1013.
Chander, G., Markham, B.L., & Helder, D.L. (2009). Summary of current radiometric calibration coefficients for Landsat MSS, TM, ETM+, and EO-1 ALI sensors. Remote Sensing of Environment, 113, 893-903.
Gillespie, A., Rokugawa, S., Matsunaga, T., Cothern, J.S., Hook, S., & Kahle, A.B. (1998). A temperature and emissivity separation algorithm for Advanced Spaceborne Thermal Emission and Reflection Radiometer (ASTER) images. IEEE Transactions on Geoscience and Remote Sensing, 36, 1113-1126.
Kahle, A. B., Madura, D.P. and Soha. J.M. (1980). Middle infrared multispectral aircraft scanner data: analysis for geological applications, Appl. Opt., 19(14), 2279 – 2290.
Lu, D., & Weng, Q. (2006). Spectral mixture analysis of ASTER images for examining the relationship between urban thermal features and biophysical descriptors in Indianapolis, Indiana, USA. Remote Sensing of Environment, 104, 157-167.
Nichol, J. (2005). Remote sensing of urban heat islands by day and night. Photogrammetric Engineering and Remote Sensing, 71, 613-621.
Nichol, J.E., &Wong, M.S. (2008). Spatial variability of air temperature and appropriate resolution for satellite-derived air temperature estimation. International Journal of Remote Sensing, 29(24), 7213-7223.
Nichol, J.E., Fung, W.Y., Lam, K.-., & Wong, M.S. (2009). Urban heat island diagnosis using ASTER satellite images and 'in situ' air temperature. Atmospheric Research, 94, 276-284.
Nichol, J. (2009). An emissivity modulation method for spatial enhancement of thermal satellite images in urban heat island analysis. Photogrammetric Engineering and Remote Sensing, 75, 547-556.
Nicodemus, F. E. (1965). Directional reflectance and emissivity of an opaque surface. Applied Optics, 4, 767-773.
Time Latitude Longitude Land cover
Deviation of satellite measured surface temperature from the ground measurement (ͦ C) Reflectance
method TES method
Reference channel method 10:45 22.3274 114.1740 concrete -
basketball 1.4 2.5 4.4 10:48 22.3274 114.1742 concrete -
basketball 0.8 2.6 4.9 10:52 22.3273 114.1743 basketball concrete - 1.6 2.1 4.4 11:00 22.3279 114.1743 concrete -
football 2.3 5.2 7.5 11:02 22.3278 114.1744 concrete -
football 1.9 5.6 7.9 11:04 22.3279 114.1745 concrete - football 2.0 5.7 8.0 11:10 22.3284 114.1745 concrete -
football 0.8 5.6 8.2 11:13 22.3284 114.1747 concrete -
Oke, T.R. (1987). Boundary Layer Climates, Second edition, ISBN 0-415-04319-0.
Roth, M., Oke, T.R., & Emery, W.J. (1989). Satellite-derived urban heat islands from three coastal cities and the utilization of such data in urban climatology International Journal of Remote Sensing, 10, 1699 – 1720.
United Nations Population Fund (UNFPA) (2011). Urbanization: A Majority in Cities: Population & Development. http://www.unfpa.org/pds/urbanization.htm.
United States Environmental Protection Agency (2013) Heat Island Effect | U.S. EPA. http://www.epa.gov/heatisland/.
Voogt, J.A., & Oke, T.R. (2003). Thermal remote sensing of urban climates. Remote Sensing of Environment, 86, 370-384.
Weng, Q., Liu, H., Liang, B., & Dengsheng, Lu. (2008). The Spatial Variations of Urban Land Surface Temperatures: Pertinent Factors, Zoning Effect, and Seasonal Variability IEEE Journal of Selected Topics in Applied Earth Observations and Remote Sensing, 1, 154 -166.
APPENDIX
Appendix 1: Unit Conversion Coefficients (UCC) to convert DN into spectral radiance.
Revised May 2015
Band Unit Conversion Coefficient (W m-2
sr-1 µm-1
)
High gain Normal gain Low gain 1 Low gain 2
1
2
3N
3B
0.676
0.708
0.423
0.423
1.688
1.415
0.862
0.862
2.25
1.89
1.15
1.15
N/A
4
5
6
7
8
9
0.1087
0.0348
0.0313
0.0299
0.0209
0.0159
0.2174
0.0696
0.0625
0.0597
0.0417
0.0318
0.290
0.0925
0.0830
0.0795
0.0556
0.0424
0.290
0.409
0.390
0.332
0.245
0.265
10
11
12
13
14
N/A 0.006822
0.006780
0.006590
0.005693
0.005225