THE ESTIMATE OF THE SPATIAL-TEMPORAL FEATURES OF VEGETATION
COVER OF KAZAKHSTAN BASED ON TIME SERIES SATELLITE INDECES
IN 2000-2015
I.Vitkovskayaa. M. Batyrbayevaa, L.Spivakb a
The National Centre of Space Researches and Technologies of the Republic of Kazakhstan, b
Dubna International University for Nature, Society and Man
Shevchenko 15, Almaty 050010, Kazakhstan, Phone: 8 3272 694592, e-mail: [email protected],
[email protected], [email protected]
KEY WORDS: remote sensing, vegetation indices, long-term series, trend, drought
ABSTRACT:
The article presents the evaluation of spatial-temporal characteristics of Kazakhstan arid and semi-arid areas' vegetation on the basis of time series of differential and integral vegetation indices. It is observed the negative trend of integral indices for the period of 2000-2015. This fact characterizes the increase of stress influence of weather conditions on vegetation in Kazakhstan territory during last decade. Simultaneously there is a positive trend of areas of zones with low values of IVCI index. Zoning of the territory of Kazakhstan was carried out according to the long-term values of the normalized integral vegetation index, which is characteristic of the accumulated amount of green season biomass. Negative trend is marked for areas of high productivity zones, long-term changes in the areas of low productivity zones have tend to increase. However long-term values of the area of the middle zone are insignificantly changed. Location boundaries of this zone in the latitudinal direction connects with a weather conditions of the year: all wet years, the average area is located between 460- 490N, and the all dry years - between 47030'- 540N. The map of frequency of droughts was formed by low values of the integral vegetation condition index which calculated from satellite data.
1. INTRODUCTION
Kazakhstan is a transcontinental country located on the border of Europe and Asia. Kazakhstan Republic occupies large area – 2,7 mln.km2. The most part of this area is located in arid and semi-arid zones and is used as pastures. For these zones current is desertification problem which connected as climate changes as increased anthropogenic impact.
It is known that the last decade for the territory of Kazakhstan is characterized by a some increase of continentality of climate and, as a consequence, an increase of situations with adverse and extreme weather events, among which the most dangerous is the drought (The III-VI National Communication, 2013). As noted, the increase in mean annual and seasonal surface air temperature especially in the summer months is observed ubiquitously. Climate changes contribute to expansion of dry lots and increase of frequency of droughts, which negatively affects crop yields.
Probability of droughts on grain producing regions of Kazakhstan is 16% (1 time per 7 years). Due to climate change it is expected that the frequency of strong and medium droughts will change
Precipitation for the territory of Kazakhstan have significant spatial irregularity. The average annual rainfall in the territory of Kazakhstan ranges from 130 to 1600 mm. In the flat part of the country rainfall decreases from north to south. In the north, rainfall is about 400 mm, in the central belt - up to 300 mm and in the south - up to 150 mm.
The deficit of precipitation is the most important component of the drought. The task of restoring fields of precipitation and amount by using ground data practicalli not solved with acceptable accuracy.
а а а ш я я
а а а а а .
Network of meteorological stations is still rare and conducted measurements are interpolated for large territories.
Satellite observing system does not have these disadvantages, enabling regular monitoring of ground surface in different parts of the spectrum and for large areas, often located in sparsely populated, inaccessible places. In addition, the accumulated long time series of satellite data allow us to evaluate not only the current state of the vegetation, but their changes in different periods.
Researchers of various countries are actively involved in the issues of drought detection, risk identification and assessment of the damage (Seiler and al., 2010; Zhang and al., 2010; Shcherbenko, 2011; Savin and al., 2010). The mapping of areas with a greatest risk is one of the important tasks. Remote sensing data are widely used as the main source of information. Currently, satellite data are generally accepted, objective and reliable source of information for a wide range of investigations and vegetation monitoring.
Since 2000 space monitoring of republic area is implemented in order to register vegetation condition changes and desertification zones detection in Kazakhstan. To create effective identification method of desertification areas it is necessary to distinguish seasonal changes which was caused weather conditions variations from sustainable vegetation degradation in long lasting period.
1. MAIN BODY 1.1 The Study Area
Republic. State of vegetation is highly dependent on weather and climatic conditions.
The vegetation cover of Kazakhstan territory including arid and semi-arid zones, which largely affected by the stress depending on weather and climatic conditions is object of study. A vegetation cover is the most dynamic part of the underlying surface, responsive to changing weather conditions.
1.2 Data and methodology
Long-term series of remote sensing data are available tool for monitoring and mapping changes in land surface, including the state of vegetation. Satellite information is used in the real-time monitoring as well as for studies of long-term changes.
Evaluation of spatial-temporal characteristics of vegetation in Kazakhstan is carried out by low-resolution satellite data on seasonal changes in the differential indices and long-term changes of the integral indexes for period 2000-2015.
Differential vegetation indexes describe well the seasonal changes, and integral vegetation indices are effective for analysis of many years seasonal variations.
In addition differential and integral vegetation indices can be used for recognize of drought, monitoring of it and assessment of its impact on the productivity of pastures and crops on almost the entire territory of Kazakhstan.
Tools used for estimate of the spatial-temporal features of vegetation cover of Kazakhstan based on time series satellite indexes includes such indices as:
Normalized Differential Vegetation Index (NDVI) effectively use for estimation of seasonal and many year dynamic of state of vegetation cover (Rose and al., 1973):
NDVI =
where NDVI = Normalized Differential Vegetation Index
NIR = the near infrared band value
RED = the red band value
Vegetation Condition Index (VCI) use for analysis of weather impact on vegetation cover state during vegetative season (Kogan, 1997):
index in each pixel for the entire period of observation.
Integral Vegetation Index (IVI) use for estimation of many year variations of state of vegetation (Spivak and al., 2009). Index describes seasonal volume of green biomass in each pixel. IVI is calculated be summing NDVI-composites for vegetative season.
Integral Vegetation Condition Index (IVCI) effectively use for analysis of many year variations of weather impact on state of vegetation (Spivak and al., 2009). Index characterizes the impact of weather conditions on the vegetation in the whole season.
Integral indexes are calculated by following formulas:
IVI =
where IVI = Integral Vegetation Index
IVCI = Integral Vegetation Condition Index
IVImax, IVImin = extreme values of IVI index in each
pixel for the entire period of observation.
Values of VCI, IVCI indices less than 30% are a good indicator of drought because a decrease of yield in this case is noted equal or more 20% from normal (Kogan, 1990).
Using the VCI-techniques is main for monitoring of drought conditions on the Kazakhstan territory .
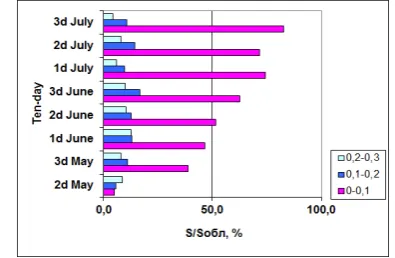
A drought can have different impact on the productivity of vegetation. It was proposed to evaluate the effect of drought impacts (intensity) based on the three-point scale (Spivak and al., 2009): 0,2 <VCI <0,3 - moderate drought; 0.1 <VCI <0,2 - strong drought; VCI <0,1 - a very strong drought. Analysis of remote sensing data shows that areas of lots with a very strong damage of vegetation sharply increase as result increasing drought duration, (Figure 1).
The diagram of changing of area characteristics of sites with low VCI values for Kostanai region in the dry 2012 is shown in Figure 1.
Figure 1. Areas with low values of VCI which referred to the oblast area, Kostanay, 2012
According to satellite data the area of plots in the Kostanai region with VCI<0.1, referred to the area of the region, (very severe drought) exceeded the 50% threshold in the 2nd decade of June.
Values VCI<0.3 considered criterion of drought detection. The introduction of the next scale of rank is offered for use in a rough estimate of the intensity of the drought on the territory of the Republic of Kazakhstan: 0.2<VCI<0.3 – moderate drought; 0.1<VCI<0.2 - strong drought; VCI<0.1 – very strong drough. A more stringent condition IVCI <0.1 becomes significant for the entire territory of the Republic actually since 2006. This fact indicates an increase in the frequency of dry years in the second half of the period under review. This is also confirmed by the negative trend in long-term changes of the integral index IVI, IVCI, both for Kazakhstan and for its individual parts (region, district).
Rows of differential vegetation indices are calculated as 8-day composites by satellite data with low resolution during the growing seasons (April-September) for period 2000-2015. The existence of long-term series of calibrated data gives opportunity for the ranking of any year in the many year row and identifies trends of changes in a vegetation state
1.3 Results and discussion
Zoning of the territory of Kazakhstan was carried out according to the values of the integral of the normalized integral vegetation index IVI, which were calculated on the basis of satellite data for the period 2000-2015.
For zoning of Kazakhstan territory according to the values of the integral index of vegetation, normalized to multi-year maximum, the following scale is entered: [0; 0.1] - very low productivity of vegetation; (0.1; 0.2] - low productivity, (0.2; 0.3] - average productivity; (0.3; 0.4] - moderate productivity; (> 0.4) - high productivity.
The weather conditions of any year render great importance on the position and areas of the various productive zones .Figure 2 shows the location of selected zones for years with different weather conditions: growing season 2002 was one of the wettest year in the reporting period, 2008 - dry.
Figure 2. Zones of different vegetation productivity
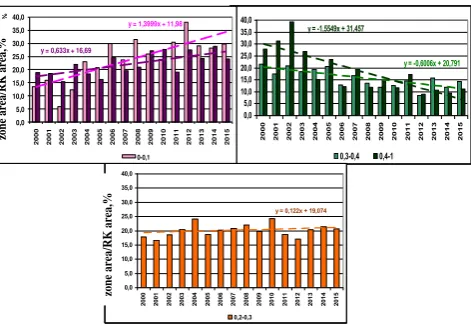
Long-term dynamics of areas of zones with different vegetation productivity is shown in Figure 3. Negative trend is marked for areas of high productivity zones, long-term changes in the areas of low productivity zones have tend to increase.
Such principle of zoning showed a strong dependence of the areas allocated to zones and their promotion in the latitudinal direction due to the weather conditions of each year.
Figure 3. Areas of zones of different vegetation productivity on the Kazakhstan territory (defined by the IVInorm values,
2000-2015)
In years with favorable weather conditions there are a strong increase in the areas of zones with high productivity of vegetation, reducing of areas of zones with low productivity of vegetation and promotion of the middle zone with values of IVInorm = (0.2-0.3) to the south accordingly. During droughts, when vegetation is experiencing stress due to weather conditions, there is a spatial expansion of areas with low productivity and movement of average zone to the north.
Simultaneously, long-term values of the areas of the middle zone (IVIЄ(0.2-0.3)) are insignificantly changed in the presence of annual variations.
Combining boundaries of average area for all years of observation reveals an interesting regularity. Locations of boundaries of the zone with IVI-values owned by range (0.2-0.3) are determined in the latitudinal direction weather conditions of the year: for all wet years the average area is located between 460 - 490 N, and for all dry years - between 47030'- 540N.
The locations of the middle zone with IVI = (0.2-0.3) are shown for examples of wet (2002) and dry (2004) growing seasons on Figure 4. Weather variations of each year lead to different configurations of selected area, but not to change of its location. Such information is important, as the area with vegetation productivity (0.2-0.3) is most sensitive to weather changes. Moreover, most of the natural steppe fires occur in this zone.
Figure 4. Locations of zone with IVInorm (0.2-0.3) in the territory of Kazakhstan for various weather conditions
In different agro-climatic zones of Kazakhstan integral indices are changed co-phase with a clear trend of decreasing values in the presence of annual deviations from long-term average. It should be noted amplitudes of deviations are increased. This fact shows about increase of aridity of the study territory. For example, decrease of IVCI values is observed in the main grain regions such as Akmolinskaya, Kostanaiskaya, North-Kazakhstan oblasts, Figure 5.
Figure 5. Dynamics of the integral index of vegetation conditions on crop main oblasts of Kazakhstan for the period
2000-2015
Threshold of IVСI index equal to 30% (a remote sensing indication of drought) is shown in the graph too. Thus, according to the remote sensing data dry years are: 2008, 2010, 2012 - for Akmolinsk oblast; 2010, 2012 - for the Kostanay oblast; 2010, 2015 - for the North-Kazakhstan oblast.
There is similar decrease of IVI index values (the total amount of green biomass in growing season) and IVCI (characteristic of
0 –0.1
2000 2001 2002 2003 2004 2005 2006 2007 2008 2009 2010 2011 2012 2013 2014 2015
л
2000 2001 2002 2003 2004 2005 2006 2007 2008 2009 2010 2011 2012 2013 2014 2015
л
2000 2001 2002 2003 2004 2005 2006 2007 2008 2009 2010 2011 2012 2013 2014 2015
л
2000 2001 2002 2003 2004 2005 2006 2007 2008 2009 2010 2011 2012 2013 2014 2015
л
2000 2001 2002 2003 2004 2005 2006 2007 2008 2009 2010 2011 2012 2013 2014 2015
л
2000 2001 2002 2003 2004 2005 2006 2007 2008 2009 2010 2011 2012 2013 2014 2015
influence of weather on vegetation) for all oblasts of Kazakhstan for period 2000-2015.
Coefficient values in the equations of the line trend shows the rate of decrease of IVCI.
Calculation of the coefficients in the equations of the linear trend of long-term changes of IVCI-indexes and zoning of the territory of Kazakhstan by the their values were executed in the scale of oblasts , Figure 6.
Figure 6. Zoning of the Kazakhstan territory by the values of the coefficients in linear trend equations of long-term changes of
IVCI (scale of oblasts)
As the results of the calculation of the coefficients of the linear trend, the rate of deterioration in the condition of vegetation is more pronounced in the western regions of the republic. There is a positive trend of increasing of zones areas with IVCI<30%, which characterizes the growing impact of drought conditions on vegetation productivity in Kazakhstan.
The results of calculation of areas of plots with low values IVCI for some regions of Kazakhstan are shown in Figure 7.
Figure 7. The areas of plots with values of IVCI <30% for some KaгakСstan’s oblasts
Digital matrices of IVCI index allow visualization of the location of the plots with oppressed vegetation with indication of their geographic coordinates, as well as the definition of the areas of these sites.
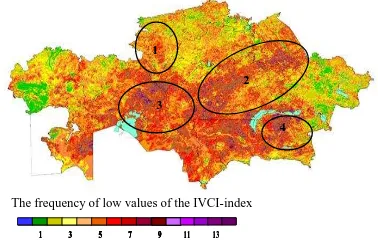
Digital map of frequency of low index values is formed by for long-term values of satellite index IVCI to assess the probability (frequency) of occurrence of droughts in Kazakhstan. An algorithm for constructing such a map is designed by a team of authors (Spivak and al., 2010), Figure 8.
Figure 8. The schematic map of frequency of droughts (IVCI values smaller 30%) during 2000-2015
Areas with a maximum frequency of dry conditions are detect in the above map-scheme. These include: 1) the western part of
The technology of forming long-term series of vegetation indices is based on remote sensing data from low resolution NOAA/AVHRR images. Satellite data provides a general integral evaluation of the productivity of land large areas without the consideration of local landscaping features of separate sites. Zoning the territory of the Republic of Kazakhstan in terms of vegetation productivity was achieved through the use of long-term distributions of vegetation indices. The tendency to increase of areas with vegetation low productivity is shown.
Additionally, the use of time series of integral vegetation conditions index (IVCI) allows to get important information about the long-term dynamics of vegetation. The presence of the negative trend of the integral values of vegetation indices for almost the entire territory of Kazakhstan should be especially noted. The highest rate of their decline is noted for the western regions of Kazakhstan. This fact can be explained by the influence of a range of reasons, but the main role is certainly played by the changes of agro-climatic conditions, including increased salinity and soil degradation. Contrast of weather conditions is enhanced too, as evidenced by the increase in the amplitude of deviations of the integral vegetation index of from the long-term trend of changes. Note that the increase of
Finally, based on analysis of satellite imagery we can conclude that the decade of 2000-2015 is characterized by increased negative climate impact on vegetation for the whole territory of Kazakhstan and semi-arid / arid zones in particular.
З а я э а а
а а яIVCI (2002-2012)
-0,02 -0,03 -0,04 -0,05 -0,06 -0,07 -0,08
З а я э а а
а а яIVCI (2002-2012)
-0,02 -0,03 -0,04 -0,05 -0,06 -0,07 -0,08 -0,02 -0,03 -0,04 -0,05 -0,06 -0,07 -0,08
The values of the coefficient in the equation of the linear trend of IVСI-distribution
З а я э а а
а а яIVCI (2002-2012)
-0,02 -0,03 -0,04 -0,05 -0,06 -0,07 -0,08
З а я э а а
а а яIVCI (2002-2012)
-0,02 -0,03 -0,04 -0,05 -0,06 -0,07 -0,08 -0,02 -0,03 -0,04 -0,05 -0,06 -0,07 -0,08
The values of the coefficient in the equation of the linear trend of IVСI-distribution
The universalism of the developed techniques determines the possibility of their extension outside of Kazakhstan, primarily for use in arid regions prone to frequent droughts and the resulting desertification.
REFERENCES
The III-VI National Communication of the Republic of Kazakhstan to the UN Framework Convention on Climate Change (UNFCCC). 2013. Astana, Kazakhstan, 274 p.
Seiler, R., Kogan, F., We, G., 2010. Monitoring weather impact and crop yield from NOAA AVHRR data in Argentina. Advances in Space Research, 26(7), pp. 1177-1185.
Zhang, X., Goldberg, M., Tarpley, D., Fried, M., Morisette, J., Kogan, F., 2010. Drought-induced vegetation stress in southwestern North America. Environmental Research Letters,5(2), pp.11-23.
Shcherbenko, E. 2011. Drought monitoring according to satellite imagery. Modern problems of remote sensing of the Earth from space. 8(2), pp. 395-407.
Shcherbenko, E. 2011. Remote sensing methods of identification of agricultural drought. Modern problems of remote sensing of the Earth from space. 8(2), pp. 408-419.
Savin, I., Bartalev, S, Loupian, E, Tropin, V, Medvedev, M, Plotnikov, D. 2010. Satellite monitoring of drought impacts on vegetation (for example, the drought in Russia in 2010). Modern problems of remote sensing of the Earth from space. 8(1), pp. 150-162.
Rouse, J., Haas, R., Schell, J., Deering, D. 1973. Monitoring vegetation systems in the great plains with ERTS. Third ERTS Symposium NASA SP-351, 1, pp. 309-317.
Kogan, F., 1997. Global drought watch from space. Bulletin of the American Meteorological Society. 78. pp. 621-636.
Spivak, L., Vitkovskaya, I., Batyrbaeva, M., Terekhov, A. 2010. Detection of desertification zones using multi-year remote sensing data. NATO Science for Peace and Security Series C: Environmental Security Use of Satellite and In-Situ Data to Improve Sustainability, Springer, pp. 235-241.