INTEGRATION OF MY OFILAMENT RESPONSE
TO C
A
21WITH CARDIAC PUMP REGULATION
AND PUMP DY NAMICS
R. John Solaro
Depa rtm ent of Physiology a nd Biophysics, College of Medicine, University of Illinois a t Chica go, Chica go, Illinois 60612-7342
I
n this paper I present some ideas related to teaching cardiac pump dynamics and regulation to first-year medical students. I emphasize explicit presentation of the relation between the activity of the contractile machine in the myocytes to pump dynamics, pressure-volume relations, and cardiac output regulation, with matching oxygen supply to tissue demands serving as a focal point. Important ideas here are1) the concept that regulation is at the cellular level of regulation;2) that force and shortening properties of the cells are ultimately dependent on the number of cross bridges reacting with the thin filament and on the rate of cross-bridge cycling;3) that the concepts of preload, afterload, and contractility originated in studies of muscle mechanics;4) that there is a reserve of force-generating cross bridges, i.e., the myofilaments are not fully activated by Ca21 in the basal state, and that force-generating cross bridges can themselves activate the thin filament; and5) that length dependence of myofilament Ca21 activation is important in the cellular basis of Starling’s law of the heart. The elaboration of these processes serves to elucidate how these mechanisms play a role in coupling tissue oxygen demands to supply.AM. J. PHYSIOL. 277 (ADV. PHYSIOL. EDUC. 22): S155–S163, 1999.
Key words:cardiac function; myocytes; cross bridges; calcium; pressure-volume relation
TISSUE OXYGEN DEMANDS AS A FOCAL POINT
I begin the lectures on cardiac pump regulation by considering the heart in the context of the entire circulation and cardiovascular tree, with a general introduction to cardiac output and venous return and mechanisms by which bulk flow may be regulated. Although not detailed here, before they consider pump function and regulation, I prefer that the students have some understanding of hemodynamics and an answer to the question, ‘‘What makes the blood go around?’’ Thus, when considering what follows, the students have an understanding of where pressure comes from in the cardiovascular system, general features of flow regulation (the bulk flow
equation, pressure gradient as a driving force, and resistance or impedance as a determinant of flow regulated significantly by the radius of the vessels), compliance, and the Law of LaPlace. Hemodynamics is reinforced in other lectures after the series of lectures on cardiac pump dynamics and regulation and also during lab and small group sessions.
I emphasize that homeostasis demands that there must be tight coupling between the increases in tissue demands for oxygen and the increases in cardiac output. As an aside I mention that the homeostatic mechanisms fall apart in syndromes such as heart failure. This coupling requires that the mechanisms by which cardiac output is varied must sense tissue oxygen demands. I also indicate that inasmuch as oxygen is a ‘‘flow-limited’’ substance in blood, with a high extraction ratio, meeting the demands for oxy-gen automatically meets the demands for all other substances in blood. I also mention that carbon dioxide and heat are also flow limited but that we will emphasize oxygen.
A central question guiding the lectures becomes, ‘‘How does the regulation of the cardiac pump play a role in varying the oxygen supply to meet the varia-tions in oxygen demands?’’ This is depicted schemati-cally as follows with the double arrows used to infer coupling
Exercise&Increased O2demand
&Increased O2supply&Increased cardiac output
The schematic not only serves to provide a point of departure into the details of the molecular, cellular, and integrated biology of cardiac myocytes but also serves as the focal point of the lectures to which I return as the information unfolds. I return to this schematic at the end of the lecture series with a partial answer that leads into the lectures on the vascular system.
RELATIONS AMONG THE ACTIVITY OF THE CONTRACTILE MACHINE OF THE CELLS AND VENTRICULAR PRESSURE AND VOLUME
Armed with a general knowledge of hemodynamics as described above, the students are presented a tradi-tional introduction to the pump cycle in a partial Wiggers-type diagram that includes the electrocardio-gram, left atrial pressure, left ventricular pressure and volume, and aortic pressure. Our students have al-ready had the series of lectures on striated and smooth muscle physiology and cardiac electrophysiology. They are, therefore, well prepared to begin to understand muscle physiology when the muscle cells are wrapped around a bolus of blood. It is important to emphasize
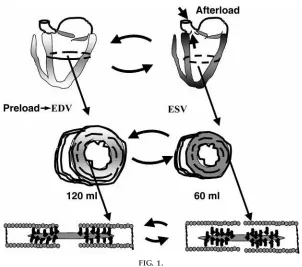
that all of the myocytes in each of the cardiac chambers participate in contraction and that recruit-ment of cells is not a regulatory device in the heart. This means that the control of cardiac function occurs at the level of cells and that each cell must be able to vary its activity. I take the students step by step through a beat of the heart, going back and forth between the overt changes in pressure and circumfer-ential shortening. To make the transition from blood flow to cardiac myocyte properties, it is important that the students understand the relations between ventricular volumes and cell length as well as ventricu-lar pressure as ultimately determined by cell and wall tension and the Law of LaPlace. Figure 1 illustrates this concept using a cross section of the ventricular chambers that relates the ventricular volume changes during a beat of the heart in the context of the calculation of cardiac output. The point is made that the volume changes are a reflection of changes in circumferential shortening, and the bottom of Fig. 1 provides an expanded view of the contractile machine as it resides in one of the cells along the circumfer-ence.
I find it useful to use the diagrams in Figs. 1 and 2 to introduce the concepts of preload, afterload, and contractility. I refer to the volume of blood returning to the ventricle during diastole as the loading volume and explain that this volume is added to existing end-systolic volume (ESV); i.e., the heart does not empty with each beat and there is a reserve of volume for ejection. The end-diastolic volume (EDV) is pic-tured as representing a load not yet sensed (and thus a preload) by the ventricles that serves to establish the length of the cells and sarcomeres. The afterload is presented with the use of another drawing showing the ventricular chamber ejecting into the aorta. Aortic pressure is pictured as the load against which the cells must develop tension to shorten and therefore eject blood. A rationale for the term ‘‘afterload’’ is that this load is ‘‘seen’’ only after the valve opens. With the use of Figs. 1 and 2 and the equation CO5(HR)(EDV2 ESV), where CO is cardiac output and HR is heart rate, I indicate that CO is varied not only by regulation of the HR (usually the first thing that will come into the minds of the students) but also by increases and decreases in EDV and ESV. The students already know the disadvantages of elevating EDV to increase CO because of their knowledge of the Law of LaPlace, but
this needs to be reinforced. Variations in ESV are presented as having been changed by control of the extent of shortening of the cells, i.e., their ability to contract (‘‘contractibility,’’ or the more commonly used term ‘‘contractility’’) at a constant afterload.
FORCE-GENERATING CROSS BRIDGES AND THEIR CYCLE RATE AS THE ULTIMATE DETERMINANT OF CARDIAC ACTIVITY AND DYNAMICS, AND THE CONCEPT OF RESERVE OF FORCE-GENERATING CROSS BRIDGES
I next introduce the students to the concept that the ultimate determinant of the ability of cells to develop tension (and therefore pressure in the ventricle) and to shorten (and therefore eject blood) is the reaction of myosin cross bridges with actin. Figure 2 shows
schematically changes in a ‘‘giant sarcomere’’ with associated series elastic element. How experiments on a linear muscle account for the origin of the terms of afterload and preload is presented by comparing the pressure-volume changes during a beat with experimental simulation using the giant sarcomere. At this point the students should have some clear under-standing of the cellular and indeed the molecular basis of the heart beat. With the concept that the number of force-generating cross bridges determines the tension comes the question, ‘‘What regulates the number of force-generating cross bridges?’’ The students have been introduced to excitation-contraction coupling cellular mechanisms of Ca21 homeostasis, so they know that Ca21 binding to the thin filament of the myofilaments activates the actin-cross bridge reaction.
FIG. 1.
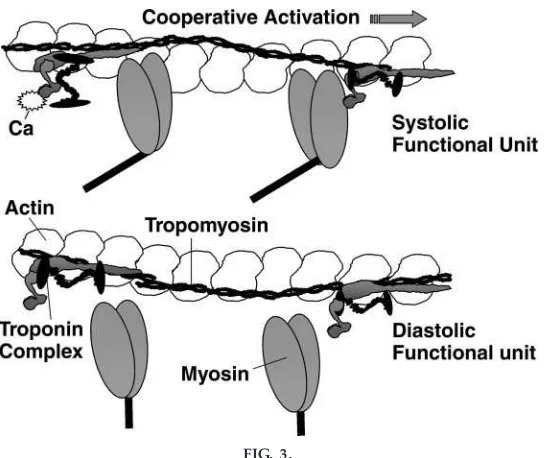
I believe this must now be made clear and extended to the case of cardiac muscle contraction/relaxation. I find it worthwhile to present a cartoon of a region of overlap, showing at least one structural unit of the thin filament (7 actins:1 tropomyosin:1 troponin com-plex) as illustrated in Fig. 3. Figure 3 shows this structural unit in a diastolic and systolic state (3). It indicates that the actin-cross bridge reaction is turned on not only by binding of Ca21to troponin but also by a cooperative ‘‘spread’’ of activation through contigu-ous tropomyosins (see legend to Fig. 3). The coopera-tive activation is clarified by stating that by cooperativ-ity, we mean that the binding of one cross bridge
facilitates the binding of a near neighbor cross bridge. This occurs by the cross bridge reaction itself ‘‘push-ing’’ tropomyosin away from the binding sites on actin. Figure 3 thus shows a force-generating cross bridge that has been turned on without Ca21bound to troponin, whereas the near neighbor cross bridge is reacting with actin with Ca21 bound to troponin. A concept that is critical to the understanding of cardiac pump regulation is that during basal, resting condi-tions, it is estimated that only 25% or so of the cross bridges are engaged in force-generating interactions with the thin filament during each beat. This means that there is a reserve of cross bridges that can be
FIG. 2.
Relations between ventricular states in the car diac cycle and the mechanics of isolated muscle pr eparations. The cycle begins at leftat an ESV and end-systolic sar comer e length. In the linear muscle setup the analog of EDV is a weight, the pr eload, added befor e activation. Addition of the pr eload establishes sar comer e length. The load the sar comer e discovers it must lift is not ‘‘seen’’ until after activation and is the afterload, which is supported on the platfor m. With activation, for ce-generating cr oss bridges r eact with actin, developing tension isometrically until the tension developed matches the afterload. At that point the sar comer e shortens with a velocity appr opriate to match the number of r eacting cr oss bridges to the load. This sar comeric activity is r eflected in the ventricle as an incr ease in wall tension, isovolumic pr essur e development followed by opening of the aortic valve, and ejection of blood against the rising pr essur e in the aorta. (One may wish to point out the differ ence between isotonic and aux otonic contraction at this point).
called into use or recruited as the need arises, for example, during exercise. It is important to note that the rate of turnover in the cross-bridge cycle deter-mines the rate of sliding of the filaments and, in the case of the heart, the rate of change of volume and pressure. The concept that cross-bridge cycle rate is a variable should be discussed. (Mechanisms include
potential isoform switching of heavy- and light-chain isoforms of myosin and/or protein phosphorylation and variations in distance between the filaments, i.e., interfilament spacing.) This is mentioned to prepare the students for the use of the first derivative of pressure with respect to time (dP/dt) and flow veloc-ity as measures of cardiac function.
FIG. 3.
Structural unit of the myofilament contractile machinery in diastole and during systole. The cartoon shows myosin heads pr otruding fr om the thick filament and one strand of actin monomers with associated thin filament pr oteins, tr opomyosin (Tm), and the tr oponin (Tn) complex . In diastole, Tm is fix ed in its position on the thin filament by the Tn complex , which is tether ed to Tm thr ough TnT and to actin via the COOH ter minus of TnI, the inhibitory unit of the complex . The position of Tm is such that myosin cr oss bridges ar e impeded fr om r eacting with actin. The for ce-generating actin-myosin r eaction is trigger ed by Ca21
binding to an NH2-ter minal site on TnC, the Ca21r eceptor. The Ca21binding signal is transmitted to Tm thr ough TnT, the Tm
binding unit of the Tn complex , and to TnI, which is r eleased fr om its tether on actin by pr omotion of a tight interaction between the COOH ter minus of TnI and the NH2ter minus of TnC. Tm is now fr ee to move on the filament, r emoving the steric hindrance of the actin-cr oss bridge r eaction (cr oss bridge atleft). As indicated by the actin-cr oss bridge r eaction atr ight, str ong binding of a cr oss bridge pr omotes the r eaction of a near neighbor cr oss bridge by actively pushing Tm away fr om its blocking position. Movements of one Tm ar e transmitted to a contiguous Tm by a str etch of overlapping amino acids. Thus the cr oss bridge atr ightis shown to r eact with actin without Ca21bound to Tn. With r emoval of
cytosolic Ca21 by the sar coplasmic r eticulum, Ca21 is r eleased
SARCOMERE LENGTH DEPENDENCE OF
MYOFILAMENT FORCE AND CA21ACTIVATION,
AND THE PRESSURE-VOLUME RELATION OF THE LEFT VENTRICLE
To prepare the students for an introduction to the pressure-volume (P-V) relation, I present the idea that the heart generates the pressure gradient in the tubes by displacing a volume of blood [stroke volume (SV)] from the high-compliance veins to the low-compli-ance arteries. The task of the heart is to transfer this volume faithfully and to match the volume transfer to the tissue oxygen needs. To do this, heart muscle must be signaled that tissue oxygen needs are changing. Three important coupling devices may be indicated at this point: 1) neural-humoral coupling through the autonomic nervous system and release of epineph-rine, 2) chemical coupling through the release of vasoactive substances, and3) mechanical coupling by the physical action of muscle contraction to compress
large vessels, thereby increasing venous return. The task is to understand how the heart responds to neural, chemical, and mechanical coupling.
Exercise serves as an excellent example to illustrate these coupling devices. During exercise, CO increases to meet the increased tissue oxygen demands. In essence, the task of the heart is to transfer the volume of blood received during diastole from the venous return to the arteries. An important associated task of the heart is make this transfer efficiently by operating with little or no change in EDV. How the heart accomplishes this can be presented to the students in the context of the P-V relation and in the context of the dynamics of the heart beat under control condi-tions and during exercise.
The P-V relation may be introduced, as many text-books do, by showing the ventricular volume changes
FIG. 4.
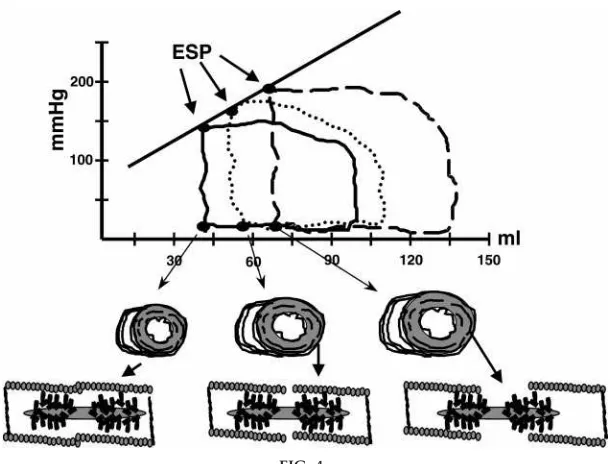
Pr essur e-volume (P-V) r elations of left ventricle at varying EDV generated by infusion of blood or saline into the cir culation. P-V loops r epr esent data obtained in human subjects in a r esting condition. End-systolic pr essur e (ESP) data points (r) r epr esent a state in which the ventricle is neither lengthening nor shortening and developing the peak pr essur e (tension) at that particular ventricular volume (sar comer e length). Thus points on the volume-ESP r elation r eflect the length tension pr operties of the muscle cells. The r elation between these points and a cir cumfer ential array of ventricular cells and the length of the sar comer e ar e schematically shown to illustrate that the P-V loop is rooted in a complex relation between sarcomere length and ventricular geometry. See tex t for further discussion.
with pictures at various points in the loop (4). Figure 4 shows a series of P-V loops generated as described in the legend. End-systolic pressure (ESP) points are emphasized as points at which the muscle cells are neither lengthening or shortening. It should also be
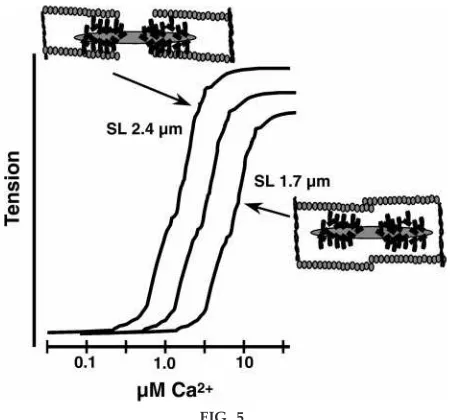
mentioned that if pressure is permitted to develop with no shortening or ejection, then isovolumic pres-sure points fall on the same line as those connecting ESP points as a function of ESV. These points thus provide a close approximation of the maximum pres-sure (wall and cell tension) that could be developed at that particular volume (cell length). This then pro-vides a functional correlate to the number of cross bridges reacting at constant length and load, which, in turn, is a correlate of contractility, i.e., the extent of the cell’s ability to generate tension and shorten against a constant load and constant initial length. The slope and position of the ESP-V relation is thus an important determinant of SV. What determines the slope and position? To develop an answer to this question, I use the steady-state relation between Ca21 and tension generated by the myofilament contractile machine in a single cell in an experimental situation in which the experimenter has control over the Ca21 supplied to the myofilaments. As illustrated in Fig. 5, the Ca21-tension relation is not fixed but varies with
FIG. 5.
Steady-state r elation between Ca21concentration and
tension generation of myofilaments at long and short sar comer e lengths (SL). Data wer e generated fr om ex periments on membrane-fr ee myofilaments of ven-tricular muscle cells, mounted in a for ce-measuring setup, and immersed in various solutions mimicking intracellular conditions. As Ca21 concentration was
incr ementally incr eased, Ca21bound to TnC, pr
omot-ing tension generation by for ce-generatomot-ing cr oss bridges. Even though ther e is a single binding site on TnC, the r elation is steep, as ex pected fr om coopera-tive activation of cr oss bridges as indicated in Fig. 3. When TnC became saturated with Ca21, tension
genera-tion came to a plateau. Plateau tension is r educed as sar comer e length is r educed accor ding to the length-tension r elation. The Ca21-tension r elation is mor e
sensitive to Ca21at r elatively long sar comer e lengths
and less sensitive to Ca21at r elatively short sar comer e
lengths. As indicated by drawings at the long sar co-mer e length, the distance between the thick and thin filaments (inter filament spacing) is r elatively short, wher eas at the shorter sar comer e lengths, inter fila-ment spacing is r elatively long. Curr ent theories indi-cate that decr eases in inter filament spacing, such as that occurring with longer sar comer e lengths, eases cr oss-bridge r eaction with the thin filament and thus eases cooperative activation. Thus at a given Ca21
concentration, mor e tension is generated as inter fila-ment spacing is r educed. See tex t for further discus-sion.
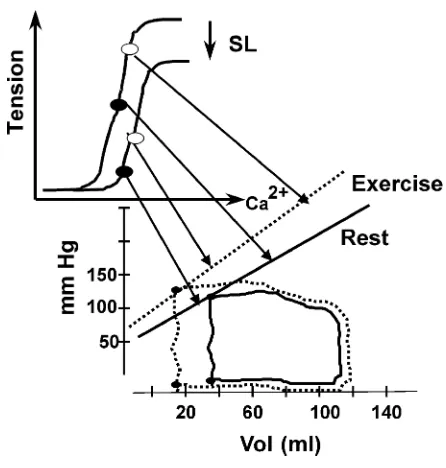
FIG. 6.
P-V r elation of left ventricle generated at varying EDV as depicted in Fig. 4. ESP points (r) ar e shown to be associated with points on the Ca21-tension r elation of
the myofilaments. The schematic illustrates that the shape and position of the volume-ESP r elation ulti-mately depends on the length-tension r elation of the myofilaments, which is itself deter mined by filament overlap (r eflected in plateau of tension at the various sar comer e lengths) and by the r esponse of the myofila-ments to Ca21. Note that at a given level of Ca21,
sarcomere length. The mechanism for the shift in the Ca21-tension relation is a change in interfilament spacing, illustrated in Fig. 5 and discussed in the legend. Ca21concentration along the abscissa is meant to reflect peak systolic free Ca21concentration occur-ring duoccur-ring the beat. The connection of the steady-state Ca21-force relation and the ESP-V relation is illustrated in Fig. 6. This illustration serves two pur-poses. It shows that hearts at rest operate at a submaximal level of Ca21activation and that the level of Ca21activation falls as sarcomeres become shorter. Figure 7 illustrates how the ESP-V relation shifts with an increase in Ca21 release to the myofilaments, as reflected in an increase in peak systolic Ca21 concen-tration.
The P-V and ESP-V relations do not include dynamics. It is important to indicate to the students the impor-tance of changes in dynamics of the duration of systole and diastole that occur with the increased HR associ-ated with exercise. This is illustrassoci-ated in Fig. 8. The data in Fig. 8 show dynamics of left ventricular volume over a series of beats at HR of 60 and 120 beats/min. The data show that both the duration and systole and diastole are reduced at the faster HR. The critical importance of this in ensuring ventricular filling, i.e., accommodation of the venous return, should be emphasized. The mental gymnastics of translating the P-V relation to Starling curves (EDV-SV or EDV-CO relation) may then be presented.
CONTROL OF CO IN EXERCISE: MECHANISM OF REGULATION OF CONTRACTILITY,
PRELOAD, AND AFTERLOAD
The mechanism for the changes in levels of Ca21 activation and dynamics of the beat can be presented in terms of a cellular model that is commonly pre-sented in textbooks. Coupling of tissue oxygen needs to pump function and dynamics via neural and hu-moral coupling mechanism involves the adrenergic nervous system and circulating levels of epinephrine.
FIG. 7.
Incr eased contractility as r eflected in the Ca21-for ce
r elation of the myofilaments and in the P-V loops. Steady-state P-V loops ar e shown for one beat at r est and for one beat during ex er cise.Top: the shift in the P-V r elation occurs by an incr ease in amounts of Ca21
r eleased to the myofilaments. Small changes in the amounts of Ca21r eleased ar e amplified in the ESP-V
r elation because of the steep r elation between Ca21
and myofilament for ce.Bottom: during ex er cise with an incr ease in HR fr om 60 to 120 beats/ min and an incr ease in venous r etur n, CO has incr eased substan-tially fr om about 4.5 to 12.0 l/ min with little change in EDV. This occurs because of the incr ease in contractil-ity. Refer to Fig. 8 for dynamics (see tex t for further description).
FIG. 8.
Dynamics of LV volume changes at a r esting HR of 60 beats/ min and an HR of 120 beats/ min during ex er-cise. Data illustrate changes in LV dynamics that occur with ex er cise. At r est, the duration of systole is 0.37 s and that of diastole is 0.63 s. During ex er cise, the duration of systole is 0.26 s and that of diastole is 0.14 s. The abbr eviation of systole and diastole ar e a key featur e of the ability of the heart to fill with blood and eject blood at fast heart rates.
The cellular mechanism is presented in terms of common cellular models that include protein kinase A-dependent phosphorylation of surface Ca21 chan-nels and sarcoplasmic Ca21-release channels (ryano-dine receptor) as well as phospholamban and tropo-nin (1, 2).
A bout of exercise again serves as a convenient way to integrate mechanisms at the molecular, cellular, and organ level. I go through a calculation of CO in the resting condition and then indicate what happens in anticipation of a bout of exercise and during a sustained period of moderate exercise. I compute the CO as the exercise unfolds and show graphically how the CO increases substantially with no or little change in EDV, because of the increased contractility. In-creases in venous return are presented as occurring because of the ‘‘muscle pump’’ and effects of adrener-gic stimulation on the vascular wall tension. The point is made that the heart is exquisitely tuned to the increases in HR and venous return to ensure a faithful transfer of the loading volume with maintenance of efficiency by optimal operation with little change in
EDV. The points made in this example may be revisited by considering what happens when a patient in heart failure attempts the same bout of exercise. Here, the chronic decrease in contractility as a result of reduced release of Ca21to the myofilaments as well as blunting of adrenergic stimulation illustrates why EDV increases and threatens homeostasis.
Address for reprint requests and other correspondence: R. John Solaro, Dept. of Physiology and Biophysics (M/C 901), College of Medicine, Univ. of Illinois at Chicago, 835 S. Wolcott Ave., Chicago, IL 60612-7342 (E-mail: [email protected]).
Refer ences
1. Bers, D.Excita tion-Contra ction Coupling a nd Ca rdia c Contra c-tile Force. New York: Kluwer Academic, 1991.
2. Solar o, R. J.Modulation of activation of cardiac myofilaments by beta-adrenergic agonists. In: The Modula tion of Ca rdia c Ca lcium Sensitivity, edited by D. A. P. Allen and J. L. Lee. Oxford, UK: Oxford Univ. Press, 1993, p. 160–177.
3. Solar o, R. J., and H. M. Rarick.Troponin and tropomyosin: proteins that switch on and tune in the activity of cardiac myofilaments.Circ. Res. 83: 471–480, 1998.