VEGETATION HEIGHT ESTIMATION NEAR POWER TRANSMISSION POLES VIA
SATELLITE STEREO IMAGES USING 3D DEPTH ESTIMATION ALGORITHMS
A. Qayyum a, *,A. S. Malik a, M. N. M. Saad a, M. Iqbal a, F. Abdullah a, W. Rahseed a, T. A. R. B. T. Abdullah b, A. Q. Ramliba
Centre for Intelligent Signal and Imaging Research (CISIR),Department of Electrical and Electronic Engineering, Universiti Teknologi PETRONAS 31750 Tronoh, Perak, Malaysia, [email protected]
b
Universiti Tenaga Nasional ,43000 Kajang ,Selangor, Malaysia.
THEME: Airborne and innovative remote sensing platforms and techniques.
KEYWORDS: QuickBird Satellite sensor, Pleiades satellite Sensor, Stereo matching techniques, Dynamic Programming, Graph-Cut, 3D depth approach
ABSTRACT:
Monitoring vegetation encroachment under overhead high voltage power line is a challenging problem for electricity distribution companies. Absence of proper monitoring could result in damage to the power lines and consequently cause blackout. This will affect electric power supply to industries, businesses, and daily life. Therefore, to avoid the blackouts, it is mandatory to monitor the vegetation/trees near power transmission lines. Unfortunately, the existing approaches are more time consuming and expensive. In this paper, we have proposed a novel approach to monitor the vegetation/trees near or under the power transmission poles using satellite stereo images, which were acquired using Pleiades satellites. The 3D depth of vegetation has been measured near power transmission lines using stereo algorithms. The area of interest scanned by Pleiades satellite sensors is 100 square kilometer. Our dataset covers power transmission poles in a state called Sabah in East Malaysia, encompassing a total of 52 poles in the area of 100 km. We have compared the results of Pleiades satellite stereo images using dynamic programming and Graph-Cut algorithms, consequently comparing satellites’ imaging sensors and Depth-estimation Algorithms. Our results show that Graph-Cut Algorithm performs better than dynamic programming (DP) in terms of accuracy and speed.
* Corresponding author.
1. INTRODUCTION
Vegetation or trees may pose a major risk to the reliability of transmission power lines (Jones , 2001). Overgrown trees within the vicinity or in the ‘danger zone’ of transmission power lines can lead to short circuits. This interrupts the continuous power supply and causes blackouts. Danger zone refers to the area around the vegetation growth, which may cause flashover and subsequent power failures. The companies monitor vegetation growth regularly along the danger zone and eliminate them to avoid blackouts and economic losses. Many methods can be deployed to monitor the vegetation growth, and more importantly to estimate the height of the vegetation within the danger zone. Traditional methods such as manual line patrol or inspection by foot lack accuracy primarily due to human judgmental errors [Lotti, 1994]. Moreover, these traditional methods consume more time, and can be dangerous; essentially due to bad weather, hazardous terrain, or sometime exposes human to wild and vicious animal. Aerial inspection of power lines using a helicopter, or airborne imaging sensors are very expensive and trivially feasible in a non-uniform terrain (Jones , 2001). In comparison with the manual visual inspection methods, the aerial inspection can cover a larger area in a lesser time but incorporates excessive costs. However, aerial inspection is prone to error introduced by camera shaking, and target location ambiguity, especially for non-uniform terrain. Videography, or aerial multispectral imaging utilizing computer vision techniques, is better than the previous two methods. This method also uses a helicopter or a balloon or an airborne vehicle to capture the aerial images of vegetation. This method has a better accuracy as compared with visual or video surveillance. However, it is more time consuming due to the low altitude of the airborne vehicle and its accuracy is dependent upon the multispectral resolution.A different method
based on satellite stereo imaging can provide a cost effective solution including lesser involvement of human resources and manual judgment. The time required to monitor a particular danger zone is less, since the images are captured using satellite. The use of satellite stereo images has many advantages over visual inspection on foot and airplane based technique (Lotti, 1994). The satellite images cover a wide area. It is cost effective and can easily monitor restricted areas (Lotti, 1994). This paper describes algorithms to process stereo images obtained via Pleiades satellite sensor. The algorithm can perform calculation to monitor the vegetation. It is followed by performance comparison with Graph-cut algorithm for disparity calculation, in terms of processing speed and accuracy. The result shows that the proposed Graph-Cut algorithm associated with each pixel for disparity calculation is more accurate as compared with dynamic programming algorithm. The background of depth estimation is discussed in Section II. The proposed technique is explained in Section III. Section 1V presents the simulation results. The conclusion and future research directions are presented in Section V.
2. RELATED WORK
presented the fast cross correlation technique, and applied box filtering to measure stereo matching.
Stereo matching methods are generally categorized into two classes: local and global. The local methods are fast and efficient in computation based on area or windows (Cai,2006 ;2010 ; Cox, 1996). On the other hand, global methods based on specific energy function and are computationaly expensive (Boykov, 2001, 2004). However, stereo matching method demonstrates more noise when the smaller window in area based method is used. Upon increasing the window size, the noise is less affected, but the computational complexity increases with the increase in the window size. For the good construction of 3D, the surface should be continuous and fully textured. The variation in intensity is not covered for small window size, and if we increase the size, then occlusion and discontinuities in disparity occur.
Area based methods are used to measure similarity between two blocks using different types of window to measure disparity map from stereo images. The maximum similarity between two stereo images in stereo matching depends upon the cost/similarity function. The efficient designing of the cost/similarity function produces fast and robust stereo matching.
Global optimization algorithms like Graph-Cut and Belief propagation sometimes require extra parameters which are computationally more expensive (Boykov, 2001, 2004). These algorithms are not suitable for real time processing due to higher running time. These algorithms can be used for non-real time processing of data where higher accuracy is required. However, the Graph-Cut Algorithm is more accurate than Belief Propagation and dynamic programming algorithms (Sun, 2006). Therefore, Graph-Cut is suitable candidate for stereo matching for estimation of disparity maps or depth maps. The Graph-Cut produced new energy minimization algorithm and give good architecture for stereo matching problems. Boykov and Kolmogorov show graph-cut based energy minimization algorithms, which are faster by 2 or 5 times as compared to traditional push-reliable approaches (Scharstein, 2002). Graph-Cut for energy minimization using Potts model are used in segmentation, stereo, object recognition, shape reconstruction and augmented reality. The Boykov produces excellent algorithms that are expansion move and swap-move. These algorithms are based on pixel labelling for large pixel sets. Stereo matching based on multi-labelling problems and these labels are called disparities.
3. METHODOLOGY 3.1 Proposed framework
The Pleiades satellite was successfully launched with two sensors Pleiades-1A and Pleiades-1B sensor on 16 December 2011 and 1 December 2014. Pleiades-1(A&B) has the capability to acquire stereo imagery in one pass, with a few second differences. It also has ability to provide stereo-pairs color images with 20 km swath width and 70 cm resolution obtained with base-to height ratio from 0.15 to 2 (Lebègue, 2012). The Pleiades has been placed on the same sun-synchronous orbit at 694 km. It has been acquiring the panchromatic stereo images with resolution of 50 cm and multispectral images with resolution 200cm and also in bundle form 50 cm black and white and 200 cm multispectral (Lebègue, 2012). The Pleiades satellite has high resolution and low weight and also low cost for acquiring the images of small area. We have area of 10x10 km square in Sabah in east Malaysia, so that’s why we choose high resolution, small
satellite sensor like Pleiades. This satellite has varieties probable various acquisition plans, such as a monoscopic cover up to 100x100 km or a stereoscopic instantaneous cover up to 60x60 km. The stereoscopic coverage is comprehended by only a single flyby of the area, which allows collection of a homogeneous product quickly. A classical forward and backward looking stereo pair provides the highest accuracy, but this combination is limited to areas with moderate terrain. A nadir and forward/backward looking stereo pair can be used in most kinds of terrain. The depth estimation was calculated on selected patches of imagery by employing the proposed dynamic programming and Graph-Cut algorithm.
The acquired data is first preprocessed and cropped. The two stereo images are then used to calculate the disparity maps. These disparity maps are then further used to find depth via disparity map algorithms. Furthermore, the depth maps are compared with previously recorded satellite data to find the area, where vegetation strikes the power transmission poles. Figure1 shows how our framework gets the desired information by using disparity maps and depth estimation technique blank line.
Figure 1. Proposed framework for monitoring of vegetation near power poles
3.2 Disparity Map Generation
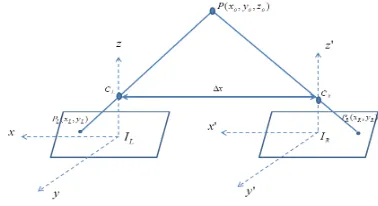
Depth information is computed from a pair of stereo images by calculating the pixel wise distance between the location of a feature in one image and its corresponding location in the second image, hence generating a disparity map. Consequently, it gives a depth map because the pixels with larger disparities are closer to the camera, and those with smaller disparities are farther from the camera.
Figure 2. Stereo camera model (Boyer, 1988).
Pre-processing & Cropping Satellite
Image Acquisition
Stereo
Matching/Disparity Map (Dynamic programming and
Graph-Cut)
Depth Estimation from disparity
map Monitoring of
In the Figure 1, we have left and right camera images, where the left image have a center at 0 and right has a center at 0’. Therefore, we can calculate 3D depth point at coordinates (X0, Y0, Z0). We have the following relation from the above diagram (Boyer, 1988). Solving equation (4) and equation (5), we have the value of Zo.This value of z depends upon the value of the denominator factor which is called disparity value.
λ
Solving equation (1) and equation (2),we obtain equation (3).
)
The distance in pixels between the first and second image of the stereo pair is used to estimate the depth information and this programming Algorithms for stereo matching on plaids satellite stereo images.
3.3 Graph-Cut algorithms for stereo matching
Stereo matching is a classical vision problem, where graph based energy minimization method has been successfully applied. Three basic graph-based methods are used to solve stereo corresponding problems: pixel labelling with the Potts model, stereo matching with occlusion handling, and multicamera scene reconstruction. The multicamera scene reconstruction method is used for more than three stereo cameras. We are interested to handle the stereo matching with occlusion and also detect objects in stereo vision at textureless region. We used satellite stereo images that have low textures in some regions. In this paper, our work is closest to the formulation based on graph-Cut introduced by Kolmogorov & Zabih.They used symmetrical images in both stereo pair and minimization using an expansion move algorithm. This algorithm minimizes the energy function in an iterative manner. It minimizes energy function by transforming into minimum cut problem on the graph and cuts the graph at each iteration to solve such problem at each iteration. The algorithm is run until convergence is achieved, and the result is a pretty strong local minimum of the energy function. The stereo correspondence algorithms based on graph cut discussed here endow with the base, from which innovative algorithms have emerged. The expansion-move algorithm [12] has the following chraractestics.
• Large number of pixels can change their labels simultaneously
• Finding an optimal move is computationally interactive • It takes almost less than one minute to complete an execution as compared with other energy minimization algorithms like simulated annealing and
iterated-conditional model which take 19 hours to complete execution in early days.
• Finds local minimum of energy with respect to small “one-pixel” moves.
• Initialization is important practice. Theoretically, solution reaches the global minima.
Kolmogorov & Zabih introduced the energy function which comprises three terms: a data term, an occlusion term and a smoothness term penalizing neighboring pixels pairs for having different labels.Based on energy function f of Kolmogorov and zabih, different energy functions can be defined as
)
We can define these energy terms one by one as the following.
) (f
Edata define the matching cost of corresponding pixel
and this matching cost can be calculated using four matching cost function given as
• Sum of absolute difference (SAD) • Sum of Squared difference (SSD) • Normalized cross-correlation (NCC)
• Zero-mean normalized cross-correlation (ZNCC)
The kolmogrov and zabih discussed squared difference of intensity values. We used sum of absolute difference which is easy and cost effective. The formula of the data cost function is given below.
Where
F
evaluates 1 if its argument is true otherwise zero.)
(
f
E
smooth If the neighboring pixels have different disparitythis smooth energy function imposes the penalty and can be penalty for different disparity of the neighbouring
pixels.
E
unique(
f
)
confines the possible solutions of the optimisation problem to unique solutions. If pixel is containing more than one value in the crossponding image in stereo pair then it assign penalty for infinite value otherwise null value assign..
function for calculating stereo matching.)
Where
N
2is a neighbourhood system and can be explain as insuch a way that
b
1=
p
,
q
andb
2=
p
′
,
q
′
areneighbours pixels.They must fillfull the order as if
p
x〉
p
x′
and
q
x〈
q
x′
is true.The final energy function can be written as
)
The energy function minimized using Graph-Cut algorithm gives a general solution of the correspondence between stereo images.
3.4 Dynamic programming
It can produce good results in the lower contrast region and at object boundaries in the images. Dynamic programming also provides excellent computation between scan lines of the stereo images (Cai, 2010). On rectified stereo images, the dynamic programming search the best correspondence points between left and right stereo images and must enforce the ordering constraint between scan lines of both stereo images. This ordering constraint should be applied on rectified stereo images. The dynamic programming gives a smoothness disparity map due to strong correspondence between left and right image. Dynamic programming finds the minimum path from top left corner of the 2D matrix to the right-bottom corner. It finds the optimal path and matches the sequence in left scan-line in left image to the right scan-line in the right image optimally. If we assume ordering constraint, the best path can be computed to match the pixels belonging to left image and the right image, so the dynamic programming provides the best path on the 2D grid that satisfies the ordering constraints.
The simple dynamic programming cannot detect occlusion; the algorithm was introduced by J.cai for occlusion detection using dynamic programming (Cai, 2010). In proposed DP algorithm employs fixed occlusion parameter for detection of occlusion to calculate disparity map. The proposed algorithm not only produces high accuracy, but also it detects occlusion in the disparity map based on dynamic programming. We incorporate the following steps to calculate the minimum cost value for accurate disparity map and introduce some fixed occlusion cost
from the original source algorithm steps. The four steps to calculate the minimum cost path and minimum disparity value using dynamic programming as are as follows.
Set the initial value to each path cost and accumulative cost. Step 1)Initialization
Calculate the minimum cost and occlusion detection in inter-scanline using dynamic programming.
30
Step 2)Recursion from n=1 to N-1
Step 3)Number of paths to determine
;
)
,
(
n
d
=
t
β
Save minimum Cost path and track the index of minimum path in 2D matrix.
{
( 1, )}
min
min N d
d =
β
−Step 4)Path backtracking from time n=N-2 to 0
min the accumulated matching cost at nth pixel. The disparity range
is from 0 to 30,
C
(
n
,
d
)
is the matching cost, C1 and C2 are matching costs of the left and right occlusion respectively. This disparity produces good smoothness and detects objects at depth discontinuous. Dynamic programming produces fine results as compared to block matching on satellite stereo images. Our proposed dynamic programming algorithm performs better in terms of accuracy for satellite stereo images and also consumes less computational time as compared to block matching algorithm with energy minimization. It detects occlusion, which produces error in stereo correspondences between left and right stereo image.4. EXPERIMENTAL RESULTS
disparity map. It cannot handle textureless area smoothly as shown in the disparity map.
The disparity map produced by using Graph-Cut algorithm on Figure. 3 and 4 has smoothness, which implies less-noise and good accuracy as shown in Figure. 6. Graph-Cut produces accurate disparity map as compared with dynamic programming as shown in Figure. 6.
Three important and difficult areas of input images were discussed: occluded areas, low-textured areas and noisy areas. Graph-Cut algorithm is successfully applied to Pleiades satellite stereo images. We introduced ordering constraint for measurement disparity map using Graph-Cut Algorithm and see from the results, In occluded areas the introduction of the ordering constraint was successful. In the disparity maps, no visual differences can be seen, and their error measurements are also very similar in both dynamic programming and Graph-Cut Algorithms.
We can conclude that the ordering constraints cooperate in Graph Cut Algorithm helps in occluded area and also minimize the noise as shown in disparity map. Our satellite images have very low textured, so there is no big difference in textureless areas using ordering constraint in Graph-Cut. In the occluded areas the use of the ordering constraint was successful in that the modelled occluded regions were much clearer from spurious mismatches; a fact that could be seen visually in the disparity maps, and verified by the calculated error percentages. The ordering constraint assisted in some areas, but not in texturless areas, and hence did not affect overall performance of the algorithm. We certainly need another solution for textueless region, which is very important in satellite images. Based on the results presented here, the use of the ordering constraint in a global method looks encouraging. Although the results are not amazing, they show that the significance of the ordering constraint will increase with images taking larger disparity ranges and more noise.
The Incorporation of ordering constraint in Graph-Cut is not sufficient to solve the texturless areas in satellite image. This is not that amazing, since the problem of these areas is their low signal to noise ratio, and the only way to increase this ratio is to include more pixels in the calculation of the matching cost. Therefore, the problem can be fixed to combine local area method based on correlation with Graph-Cut algorithm for stereo matching into one algorithm.
The introduction of the ordering constraint was not sufficient to solve the problems of textureless areas. This was not that amazing, since the problem of these areas is their low signal to noise ratio, and the only way to increase this ratio is to include more pixels in the calculation of the matching cost. Therefore, it would be of great interest if one could combine the robustness of area based correlation matching with the perfectionism of global graph cut based matching into one algorithm.
Another problem is that the conversion of matching problems into Graph-Cut problem necessitates that the matching problem is seen as a labelling problem. For labelling problem, we require a discrete disparity map which has less capability to capture the shape of the objects. We need fronto-parallel surfaces for this purpose. To calculate the discreet disparity map, we need a solution to solve the problem iteratively on segmented image and separate the image as foreground.The structural similarity matrix (SSIM) index can be used to calculate the similarity between reference and calculated images. The value of SSIM should be one for accurate similarity. The SSIM value of the proposed algorithm is near to accuracy as compared to the existing algorithm as shown in table. 1. The accuracy of graph-Cut is 80% and accuracy of dynamic programming algorithm is 77% according to SSIM value.
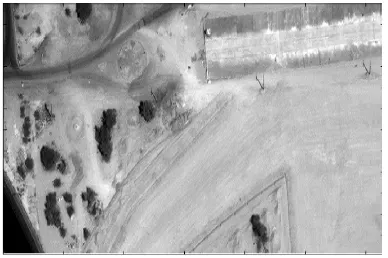
Figure 3. Reference satellite Pleiades satellite stereo image contains four power poles and vegetation near power two poles.
Figure 4. Right Pleiades satellite stereo image contains four power poles and vegetation near power two poles
Figure 5.Disparity map using dynamic programming algorithm (Detect poles and power lines seems some extent and also the
vegetation in white color).
Figure 6. Disparity Map using Graph-Cut algorithm (Detect poles and power lines seems some extent and also the vegetation in white
Algorithms Proposed Existing
Dynamic Programming 77% 70%
Graph-Cut 80% 72%
Table 1.Comparison of accuracy using SSIM between proposed and existing algorithm
5. CONCLUSION AND FUTURE DIRECTION In this paper, it is a novel technique is proposed to monitor vegetation/trees near or under the power lines using satellite stereo images. The proposed method employs Graph-Cut and dynamic programming algorithms to measure height of vegetation from stereo satellite images. The proposed technique was employed imagery from Pleiades satellite images. The experimental results illustrate that Graph-Cut algorithm based disparity measurement technique outperforms Dynamic Programming based technique in accuracy. The Graph-Cut shows an accuracy of 80%, while Dynamic Programming algorithm has 77% using SSIM value.
In future, we can compare two-way-dynamic programming algorithm with graph cut to estimate the disparity map for this application in order to improve the ordering constraint of Grap-Cut. The two-way dynamic programming is used to compute the best optimal cost within inter-scan line between stereo images.
ACKNOWLEDGEMENTS
This research is sponsored by Ministry of Energy, Green Technology and Water (KeTTHA cost No: 153AB-G07), Malaysia.
REFERENCES
Boyer, K, L. and Kak , A, C., 1988. Structural stereopsis for 3-D vision, IEEE Trans. Pattern Anal. Machine Intell. vol.10, no. 2, pp. 44-166.
Boykov,Y. and Zabih,R., 2001.Fast approximate energy minimization via graph cuts, IEEE Trans. Pattern Anal. Mach. Intell., vol.23, no.11, pp. 1222–1239.
Bank, J., Bennamoun ,M., Corke, P.,1997. Non-parametric techniques for fast and robust stereo matching, IEEE Tencon Speech and Image Technologies for Computing and Telecommunications, pp. 365–368.
Boykov.Y. and Kolmogorov,V., 2004. An experimental comparison of mincut/max-flow algorithms for energy minimization in vision, IEEE Trans. Pattern Anal. Mach. Intell., vol. 26, no. 9, pp. 1124–1137.
Cai, J., 2007. Fast stereo matching: coarser to finer with selective updating. International Conference on Image and Vision Computing, New Zealand, pp. 266–270.
Cox, S., Maggs, b, M ., 1996. A maximum likelihood stereo algorithm, vol. 63, no.3, pp. 542–567.
Krauss, T., Lehner, M.,Reinartz, P.and Stilla.J.,2006. Comparison of DSM generation methods on IKONOS images, Urban Remote Sensing – Photogrammetrie – Fernerkundung – Geo information special issue, 04/2006.
Cai,J. and Walker,R., 2010. Height estimation from monocular image sequences using dynamic programming with explicit occlusions,IET Computer Vision, vol.4, pp.149–161.
Ghaffar, R., Jafri, N. and Khan, S, A., 2004. Depth extraction system using stereo pairs, Image Processing & Computer Vision (IPVC), pp.512–519.
Jones, D, I and Earp, G, K., 2001. Camera sightline pointing requirements for aerial inspection of overhead power lines, Electric Power Systems Research (EPSR), vol.57, pp.73-82.
Kobayashi, Y., Karady, G and Olsen, R, G., 2009. The utilization of satellite images to identify trees endangering transmission lines, IEEE Transactions on Power Delivery, pp. 1703–1709.
Kolmogorov,V.and Zabih,R.,2001. Computing visual correspondence with occlusions via graph cuts, In International Conference on Computer Vision.
Lebègue, L., Greslou, D., deLussy, F., Fourest, S., Blanchet, G., Latry, C., Lachérade, S., Delvit, J.-M., Kubik, P., Déchoz, C., Amberg, V., Porez-Nadal, F., 2012, “Pleiades-HR image quality commissioning. Int.”, Archives of Photogrammetry, Remote Sensing and Spatial Information Sciences, Vol. 39(1), pp. 561-566. XXII ISPRS Congress, Melbourne, Australia.
Lotti, J, L. and Giraudon, G., 1994. Correlation algorithm with adaptive window for aerial image in stereo vision, European Symposium on Satellite Remote Sensing (EUROPTO), (Rome, Italy), pp. 2315–10.
Scharstein, R.and Szeliski, R., 2002 A taxonomy and evaluation of dense two frame stereo correspondence algorithms, International Journal of Computer Vision,vol.47,no.1-3, pp. 7–42.
Sun, C ., Jones, R., Talbot, H., Wu. X. Cheong, K., Beare ,R., Buckley, M. and Berman,M.,2006. Measuring the distance of vegetation from power lines using stereo vision, ISPRS Journal of Photogrammetry & Remote Sensing, vol.60, pp. 269–283.
Sun, C., 2002. Fast stereo matching using rectangular subregioning and 3d maximum-surface techniques, International Journal of Computer Vision, vol. 47, no.1-3, pp. 99–117.
Sun, J., Yeung Shum, H. and Ning Zheng,ZHENG ,N., 2003. Stereo matching using belief propagation, IEEE Trans. Pattern Anal. Mach. Intell , vol.25, pp. 787–800.
Tomasi , C., 1998. A pixel dissimilarity measure that is insensitive to image sampling, IEEE Trans. Pattern Anal. Mach. Intell, vol.20, no. 4, pp. 401–406.