AN ANALYSIS OF SURFACE SUBSIDENCE IN CHIBA USING PSInSAR TECHNIQUE
Ruihuan Li1,2,*, Zheng Zhao1,2, Minyan Duan2, Zhiyong Wang1, Ping Wang3 1Shandong University of Science and Technology, Qingdao, China – [email protected]
2Chinese Academy of Surveying and Mapping, Beijing, China 3Sichuan Romote Sensing Geomatics Institute, Chengdu, China
Commission VI, WG VI/4
KEY WORDS: PSInSAR, Surface subsidence, The public master image, Interferograms, PS points
ABSTRACT:
Currently, surface subsidence has become an important problem what we are facing. Because of complex topography, uneven distribution of rainfall, and the fast development of urbanization, many cities of the world have undergone surface subsidence disaster, such as Chiba, Paris, Tokyo, Beijing. The surface subsidence has occurred in Chiba since the early twenty-first century. The surface subsidence seriously threatens the safety of human life and property. In order to monitor surface subsidence, people have done a lot of research, and time-series InSAR technique with its better coverage, lower cost and high measurement accuracy advantages shows great potentiality for monitoring surface subsidence. Time-series InSAR technique can be applied for analysis of subtle surface subsidence which occurred consistently for a long term period. This paper uses time-series InSAR technique, Permanent Scatterers Interferometric SAR (PSInSAR), to monitor surface subsidence of Chiba. The used dataset consists of thirty-four Envisat ASAR images from September 2006 to August 2010. For the experimental results, this paper uses GPS data to verify the reliability of the results, and the results can provide information for local government to prevent the occurrence of surface subsidence.
1 Introduction
Currently, surface subsidence has become an important problem what we are facing. Because of the frequent occurrence of natural disasters, such as earthquakes, volcanoes, and the rapid development of urban construction, the formation of surface subsidence phenomenon increases , and the urban ground surface deformation is more prominent , the surface subsidence seriously threat to the safety of human life and property.
As an earth observation, synthetic aperture radar interferometry (InSAR) has opened up a new research direction for monitoring surface subsidence [1]. And InSAR has some advantages, such as better coverage and lower cost, and it can work for al-weather condition to monitor surface subsidence. It has become a hot international research. With the in-depth study of InSAR technique, differential interferometry technique (DInSAR) was born [2]. DInSAR technique shows amazing advantage in monitoring earthquakes, volcanoes, landslides and
* Corresponding author
other surface deformation, but in monitoring the slow surface deformation, such as the urban surface subsidence, it is impacted by time decorrelation, space decorrelation and atmospheric delay. To solve this problem, researchers proposed time series InSAR technique [3], such as the Permanent Scatterers Interferometric SAR technique (PSInSAR) and Small Baseline Subset technique (SBAS) [4]. And PSInSAR technique achieved better results in urban surface subsidence monitoring applications.
In this paper, we adopt PSInSAR technique to carry out surface subsidence monitoring experiment, then analysis the results of the experiment, and verify the reliability of the results.
2 Principle and data processing of PSInSAR technique
2.1 Principle of PSInSAR technique
Because of the more images, we will acquire the more reliable results. One of the images is selected as the public master image, others are slave images to match the public master image space and carry out interference treatment. And then a selection model is adopted to elect a sufficient number of PS points, which have highly steady radar scattered characteristics. By making analysis about phase of points, the PS point deformation results are obtained. Finally an interpolation method is used to get deformation results throughout the study area. Currently, PSInSAR technique has been widely applied to urban surface subsidence monitoring [6], [7].
2.2 The study area and experimental data
Chibal is located in Japan’s Kanto region, and it contains the Kanto Plain and Boso Peninsula. It is a long and narrow peninsula that is about 96 km east-west and 129 km north-south. Figure 1 shows the position of the study area, where is in the red box.
Chibal is a coastal city, which is near the Pacific Ocean. Since the unconsolidated soil is the main basement of Chibal area, there are some possibilities of potential subsidence risk. Along with the rapid development of the city and the increase in population, the city need more and more water resource. Over-exploitation of water resource caused the surface subsidence of Chibal, and the surface subsidence has occurred in Chiba since the early twenty-first century.
Figure 1 The study area
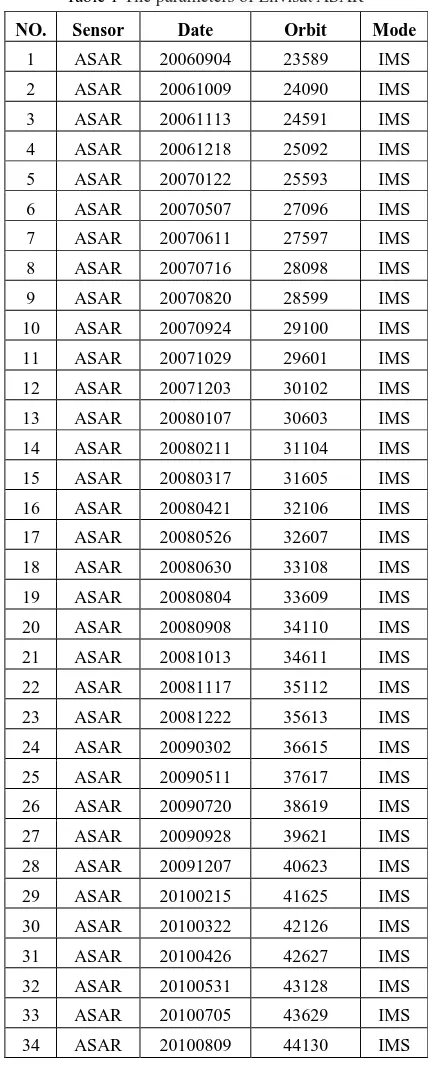
Envisat is one of sun-synchronous polar orbit earth monitoring satellites, which is launched in 2002. It can provide SAR image data for the oceans, atmosphere, land and other applications and carries a C-band ASAR sensor that it's revisit cycle is 35 days. The used dataset consists of thirty-four scenes Envisat ASAR images from September 2006 to August 2010. Table 1 shows the SAR data information.
Table 1 The parameters of Envisat ASAR
NO. Sensor Date Orbit Mode
Data processing mainly includes the public master image selecting, interferogram generation, PS point recognition and subsequent processing.
table 2),
then
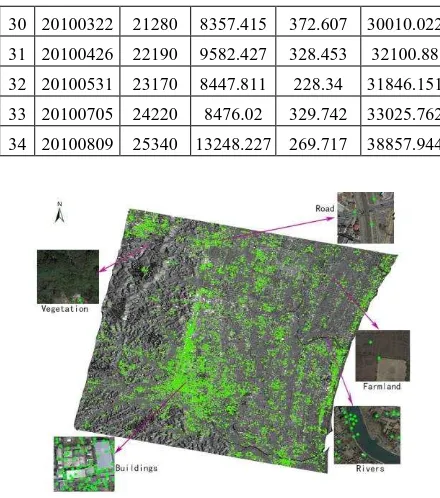
selects 4 August 4, 2008 image as the public master image, and generates 33 interferograms.This paper uses coherence coefficient threshold model to elect a sufficient number of points and obtains the distribution of PS points, as shown figure 3 (green dots for the PS points).The number of identified target PS points is 12948, and the PS points mainly concentrates in urban and residential areas, such as buildings, roads, rock. But farmland and vegetation coverage area exist a small amount of PS points.
Table 2 shows situation about the public master image selecting. 1 20060904 23450 12847.092 290.315 36587.407 2 20061009 22330 21684.222 218.732 44232.954 3 20061113 21280 29796.034 232.566 51308.6 4 20061218 20300 8160.812 182.035 28642.847 5 20070122 19390 18466.404 270.257 38126.661 6 20070507 16870 9259.358 239.782 26369.14 7 20070611 16100 10255.228 974.298 27329.526 8 20070716 15400 8486.107 188.159 24074.266 9 20070820 14770 8339.058 198.444 23307.502 10 20070924 14210 11537.317 671.119 26418.436 11 20071029 13720 8741.703 367.752 22829.455 12 20071203 13300 10531.931 188.311 24020.242 13 20080107 12950 17267.077 212.712 30429.789 14 20080211 12670 10479.819 181.379 23331.198 15 20080317 12460 10641.933 510.049 23611.982 16 20080421 12320 10498.67 180.178 22998.848 17 20080526 12250 9131.518 269.083 21650.601 18 20080630 12250 8205.802 340.721 20796.523 19 20080804 12320 8157.322 181.279 20658.601 20 20080908 12460 9758.097 216.409 22434.506 21 20081013 12670 9344.207 196.437 22210.644 22 20081117 12950 9429.701 267.45 22647.151 23 20081222 13300 13522.783 185.638 27008.421 24 20090302 14140 9193.473 184.055 23517.528 25 20090511 15120 8790.098 207.515 24117.613 26 20090720 16240 8181.883 180.185 24602.068 27 20090928 17500 18411.47 205.54 36117.01 28 20091207 18900 9248.616 183.663 28332.279 29 20100215 20440 14416.858 185.68 35042.538
30 20100322 21280 8357.415 372.607 30010.022 31 20100426 22190 9582.427 328.453 32100.88 32 20100531 23170 8447.811 228.34 31846.151 33 20100705 24220 8476.02 329.742 33025.762 34 20100809 25340 13248.227 269.717 38857.944
Figure 3 The distribution of Envisat ASAR’s PS
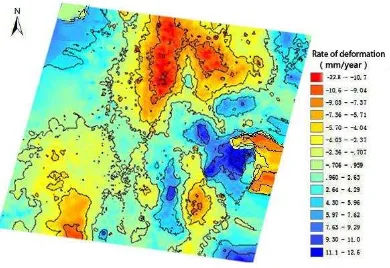
After obtaining PS points deformation results, the paper utilizes Kriging to interpolate, and finally gets deformation results throughout the study area. The subsidence rate and distribution of Envisat ASAR’s PS and the subsidence rate of Envisat ASAR are shown in figure 4 and figure 5, and right of the figure is a deformation rate allocation table.
Figure 5 The subsidence rate of Envisat ASAR
3 Results and discussion
To observe temporal variations of Chibal, 33 interferograms were generated and the subsidence rate of the study area was obtained. Figure 5 displays the satellite LOS surface deformation rate generated using PSInSAR technique, where the red represents the settlement area and the blue represents the raised area. There are two forms of deformation: subsidence and uplift, and the maximum subsidence rate reaches 12.68mm/year. First, it is clear that there are two primary sedimentation funnel, which is located in the northern part of the study area. Groundwater extraction and human engineering activities are the main causes of this phenomenon. Because building activities increases in the central and southwestern of the study area, it results in the emergence of a small funnel in the area. However, uplift phenomenon appears in the northwest and southeast of the study area. It mainly dues to temporal decoherence caused by vegetation cover in the northwest and atmospheric delay caused by atmospheric humidity in the southeast coastal areas.
In order to verify the reliability of the experimental results, this paper uses settlement information of GPS points to compare with the experimental results. Because GPS data is original data, GPS data needs to be related to treatment to obtain GPS deformation rate corresponding to the SAR image time series. Then, it needs to find a PS point near the GPS point, compare GPS deformation rate with PS deformation rate and obtain rate line chart (Figure 6). It can be found from figure 6 that the PS point has a more consistent trend settlement with the GPS point, and the surface deformation obtained by PSInSAR technique is reliable.
Figure 6 The subsidence rate of GPS and PS
4 Conclusions
PSInSAR technique allows measuring the average deformation trend of the city area. We explored the temporal variations of surface at the Chibal city. To make PSInSAR monitoring surface subsidence experiment, this paper uses the minimum sum of the absolute value of three baselines model to select the public master image, and generates the interferograms; then uses coherence coefficient threshold model to elect a sufficient number of points, makes the analysis about phase of points, obtains PS points deformation results; Finally makes interpolation to get deformation results throughout the experimental area. By analyzing the results, it finds that there are three serious subsiding districs in experimental area, which are located in eastern, northern and southwestern of study area, and the maximum subsidence rate reaches 12.68mm/year. Finally, this paper uses GPS data to verify the
reliability of
the results.
Acknowledgements
This work is supported by Special Fund by Surveying & Mapping and Geoinformation Research in the Public Interest (Project NO.: 201412010), and Key Technology for Multi-source Remote Sensing Data Mapping Environmental Construction (Project NO.: J2014ZC05).
References
Paul A, Rosen, 2000. “Synthetic Aperture Radar Interferometry”, Proceeding of the IEEE, 88, pp. 333-382.
Qingli Lou, Daniele Perissin, Yuanzhi Zhang, Youliang Jia, 2014. “L-and X-Band Multi-Temporal InSAR Analysis of Tianjin Subsidence”, Remote Sensing, 6, pp. 7933-7951.
Feifei Qu, Qin Zhang, Zhong lu,etc, 2014. “Land subsidence and ground fissures in Xi’an, China 2005-2012 revealed by multi-band InSAR time-series analysis”, Romote Sensing of Environment, 155, pp. 366-376.
D. Perissin, A. Ferretti, 2007. “Urban target recognition by means of repeated spaceborne SAR images”, IEEE Transactions on Geoscience and Remote Sensing, Vol. 45, pp. 4043 – 4058.
Crosetto M, Monserrat O, Iglesias R, Crippa B, 2010. “Persistent scatterer interferometry: Potential, limits and initial C-and X-band comparison”, Photogramm. Eng. Remote Sensing. Vol. 76, pp. 1061–1069.