COMPARATIVE ANALYSIS OF 3D POINT CLOUDS GENERATED FROM A
FREEWARE AND TERRESTRIAL LASER SCANNER
K.R. Dayal a, *, S. Raghavendra a, H. Pande a, P.S. Tiwari a, I. Chauhan a
a Indian Institute of Remote Sensing, 4, Kalidas Road, Dehradun 248001- [email protected], (raghav, hina,
poonam)@iirs.gov.in, [email protected]
Commission IV, WG IV/4
KEY WORDS: Laser Scanning, Close Range Photogrammetry, Point clouds, Heritage, VSfM
ABSTRACT:
In the recent past, several heritage structures have faced destruction due to both human-made incidents and natural calamities that have caused a great loss to the human race regarding its cultural achievements. In this context, the importance of documenting such structures to create a substantial database cannot be emphasised enough. The Clock Tower of Dehradun, India is one such structure. There is a lack of sufficient information in the digital domain, which justified the need to carry out this study. Thus, an attempt has been made to gauge the possibilities of using open source 3D tools such as VSfM to quickly and easily obtain point clouds of an object and assess its quality. The photographs were collected using consumer grade cameras with reasonable effort to ensure overlap. The sparse reconstruction and dense reconstruction were carried out to generate a 3D point cloud model of the tower. A terrestrial laser scanner (TLS) was also used to obtain a point cloud of the tower. The point clouds obtained from the two methods were analyzed to understand the quality of the information present; TLS acquired point cloud being a benchmark to assess the VSfM point cloud. They were compared to analyze the point density and subjected to a plane-fitting test for sample flat portions on the structure. The plane-fitting test revealed the ‘planarity’ of the point clouds. A Gauss distribution fit yielded a standard deviation of 0.002 and 0.01 for TLS and VSfM, respectively. For more insight, comparisons with Agisoft Photoscan results were also made.
1. INTRODUCTION 1.1 Heritage Documentation
The human-made and natural factors that have contributed to the destruction of heritage structures have caused significant loss to society in terms of its cultural progress. In this context, documentation of heritage structures assumes a greater significance thereby underscoring the importance of creating a comprehensive database of the same. In the event of irreversible damage to a structure, such a database can serve two purposes: reference for reconstruction and archives for passing down the achievements of the human race (Hassani, 2015). Traditional documentation has been in the form of drawing representations, which are both accurate and detailed such as engineering drawings, or, artistic works, which have evolved over time alongside human advancement.
1.2 3D digital documentation
Scaled handmade models also represent a structure faithfully and provide a 3D perspective to anyone who is viewing the object. With the present technology, it is possible to generate 3D models of objects in the digital domain. This allows for handling 3D information in more ways than just visualization and easy dissemination of data. Several analyses can be carried out using the 3D information such as extraction of features, damage assessment, virtual reconstruction, etc. Photogrammetry and, more recently, terrestrial laser scanning allow the creation of such 3D data (Guarnieri, Remondino, & Vettore, 2006), (Altuntas, 2015). Traditional photogrammetry requires skilled approach (Yastikli & Alkis, 2003) to 3D modeling whereas a laser scanner is a very expensive instrument (Westoby, Brasington, Glasser, Hambrey, & Reynolds, 2012).
1.3 Structure from Motion
Although considerable time, effort and money are being invested in the documentation of heritage structures, the exercise needs to be scaled up to cover several minor heritage structures that are mostly hidden in many modern cities and are under constant threat of permanent damage, and expert intervention in all these cases may not be practical. Alternative methods, which are non-complicated and easy to implement so that the public can contribute to the process of documentation, are essential. Structure from motion (SfM) is a technique based on the principles of conventional photogrammetry but is different in the sense that there is no need for 3D targets for the estimation of camera positions and orientations (Oliensis, 2000). SfM involves the use of image correspondences to orient the images (Agarwal et al., 2010). It is a low-cost technique that can be implemented using any ordinary camera and does not require any skilled knowledge of photogrammetry. (Agarwal et al., 2010; Stathopoulou, Georgopoulos, Panagiotopoulos, & Kaliampakos, 2015) have demonstrated how any imageries of an object acquired by any user can be sourced to generated point clouds of structures. There is no need for any a priori knowledge of camera parameters and target markings. This advantage, however, is not easily available to individual users interested in contributing to heritage documentation. The various softwares available for this purpose are expensive and cannot be easily procured by an individual. It is in this context that freeware such as VSfM can contribute greatly to ensure a larger crowd participation in heritage documentation.
focus of this study is to bring out the potential of SfM and Visual SfM (Wu, 2011) to provide 3D data.
2. STUDY AREA
The Clock Tower of Dehradun was chosen to carry out this study (Figure 1). It located near the Paltan Bazaar, a famous marketplace in the city. The tower is also commonly known as Ghanta Ghar and is a major landmark in Dehradun. Situated on Rajpur Road, the tower has names of freedom fighters engraved on a gold plaque. Four prominent roads, namely Chakrata Road, Haridwar Road, Rajpur Road, and Paltan Bazaar Road, merge at the Clock Tower. The foundation stone was laid on July 2, 1948, by the then Governor of UP, Sarojini Naidu. It was completed in 1953.
Figure 1: Clock Tower, Dehradun
3. DATA ACQUISITION 3.1 Terrestrial Laser Scanning
For this study, Riegl VZ-400 laser scanner was used for the purpose of laser data acquisition. Five scan positions were used for scanning the tower. The distance of the instrument was around 25-30 meters, and the scan resolution was set to 0.02°. This resulted in a dense point cloud with detailed representation of the features. Figure 2 shows the colored point cloud of the tower.
Figure 2. Coloured Point cloud
3.2 Image acquisition
A total of 88 images were acquired all around the tower. Some images were acquired near the object. The restriction to mobility around the object limited the camera stations to the edge of the roads around the tower. A few images were attempted to be acquired from the middle of the road with partial success. From the remaining positions, it was tried to acquire images with considerable overlap to compensate for any gaps. Figure 3 shows the estimated camera positions after sparse point cloud generation.
Figure 3: Sparse point cloud with camera positions
Images were not acquired for the third side as it was entirely covered by a tree. The same problem was encountered in the case of the laser scanner. Therefore, the third side had to be avoided entirely in both data acquisition exercises. However, some information was present for these surfaces
4. METHODOLOGY 4.1 Structure from Motion
Visual SfM has a very simple workflow as highlighted in the user manual (Wu, 2011). It is a four step process involving the
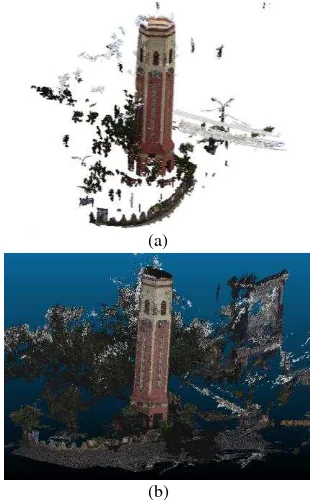
(a)
(b)
addition of photos, matching of image pairs, sparse reconstruction, and dense reconstruction. The output is in an arbitrary coordinate system. Figure 4(a) shows the result of the dense reconstruction for the set of photographs.
4.2 Agisoft Photoscan processing
In Photoscan, some parameters were adjusted and after a few trials, the following parameter values were considered for the generation of the point cloud. The accuracy was kept ‘high,' and pair preselection was kept ‘generic.' The default values were used for key point limit and tie point limit i.e. 40,000 and 4,000 respectively. For the generation of dense point clouds, the depth filtering was kept as ‘moderate’ and quality was kept ‘high.' The point cloud is shown in Figure 4(b)
4.3 Co-registration
The point cloud of SfM is in a coordinate system with arbitrary units whereas that of a TLS is in meters. The point clouds were co-registered with the manual identification of tie-points. Point clouds were aligned with the TLS being the benchmark. Table 1 shows the final RMS and scaling applied during transformation.
Final RMS Scale
TLS-VSfM 0.061 2.83
TLS-Photoscan 0.021 2.64 Table 1. Co-registration
At an initial stage, it was evident that the Photoscan point cloud was slightly better than VSfM point cloud. It was easier to identify the tie-points in the case of the Photoscan point cloud, which is apparent in the co-registration result.
4.4 Plane fitting
The subsets for a planar areas were extracted for each point cloud. A plane was fitted to each of the point clouds. The distances of the points to the plane were calculated to assess the planarity of the point clouds obtained from the three sources. The number of points making up the subsets in each case is reported in this study.
4.5 Cross section extraction
For all the point clouds, sections were extracted. Point cloud sections are useful for assessment of the geometry of structure and generation of engineering drawings. A variation in the geometry can indicate problems such as wall misalignment, which in turn may be useful for structural health assessment. The cross-sections also bring out details on the surface of a structure which can be compared for a better understanding.
5. RESULTS 5.1 Plane fitting
5.1.1 Terrestrial Laser Scanner
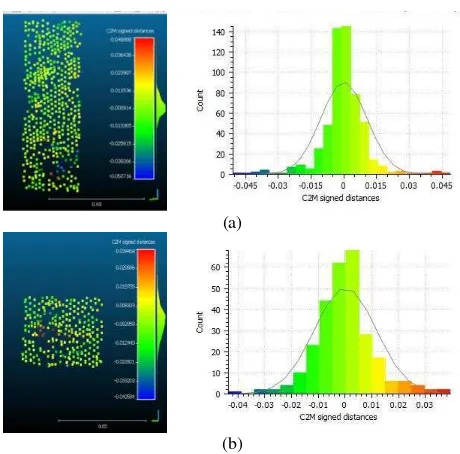
The standard deviation for subset one was 0.002395. It is evident in Figure 5a and 5b that majority of the points are close to the plane. For subset two, the standard deviation for Gauss fit was 0.001829.
(a)
(b)
Figure 5: Plane fitting for two TLS subsets
The laser scanner data has a high degree of planarity. Subset one has 4,245 points/unit area, and subset two has 2,372 points/unit area. For the same area, the point densities of the other data will be compared
5.1.2 Photoscan
For subset one (Figure 6(a)), the standard deviation for the Gauss fit in the case of Photoscan point cloud was 0.00414. The standard deviation for the Gauss fit in the case of Photoscan point cloud was 0.00374, for subset two ((Fig 6(b)).
(a)
(b)
Figure 6: Plane fitting for two Photoscan subsets
5.1.3 VSfM
For subset one, the standard deviation for the Gauss fit in the case of VSfM point cloud was 0.010. For subset two, the standard deviation for Gauss fit was 0.011.
(a)
(b)
Figure 7: Plane fitting for two VSfM subsets
Subset one has 559 points/unit area, and subset two has 285 points/unit area which is considerably lesser than the other two techniques.
5.2 Cross section extraction
The geometric properties of the structure are retained well in the point cloud of the terrestrial laser scanner. The variations in the features are represented with sufficient amount of detail. The location of the section is in the middle of the tower as shown in Figure 8(a).
(a) (b)
(c) (d)
Figure 8: Cross-sections (a) Location of section, (b) TLS, (c) Photoscan, (d) VSfM
The high density of Photoscan cloud is evident in the cross-section. However, the edges seem to be rounded(Figure 8(c)). This maybe because of the parameters used and the variations in the parmeters can be investigated to see if the edges are retained in a better way. Although the VSfM cloud has a density which is less compared to the other two, it seems to have retained edges relatively better than the Photoscan point cloud(Figure 8(d). Refer to the red and yellow highlights in Figure 8.
The standard deviation of the plane fitting clearly indicates that TLS point cloud best represents the plane surface of the point cloud followed by Photoscan and VSFM. This is dependent on the properties of the laser scanner which is an active remote sensing system. However, in case of the SfM techniques, the resulting point clouds are dependent on the various algorithms used to match features, solve the epipolar geometry and several other photogrammetric processes. These are an intellectual property of the developers and may not be available for analysis and refinement.
6. CONCLUSIONS
In this study, we compared the results of the point cloud obtained from TLS, Photoscan and VSfM. The TLS point cloud has the ability to represent the geometric nature of structures well. Density of the point cloud obtained from a TLS is a function of the incremental angles in the horizontal and vertical directions, which are in turn controlled by the user and instrument specifications. In the case of SfM techniques, it is broadly dependent on the algorithms that are employed to generate the point cloud and the quality of the images. In this study, a different set of images obtained earlier under poor light conditions produced inferior point clouds. For the same set of images, the difference between the software is evident in the results obtained. Further study may be focused on the flexibility of these tools to obtain desirable output parameters such as density.
Agisoft Photoscan is capable of achieving very good results but being a proprietary software, it is not easy to procure. An individual user may find the need to depend on freely available softwares such as VSfM. VSfM has a potential to generate useful 3D data from which meaningful information can be extracted. However, point density obtained needs to be improved for representations that are more detailed. Further refinement of the algorithms can be investigated provided the authors share the same.
On one hand, using the photos of objects available on the web (crowdsourcing) as inputs to SfM platforms is a great way to process of documentation to encompass all important heritage sites in a comprehensive way.
REFERENCES
Altuntas, C., 2015. Integration of point clouds originated from laser scaner and photogrammetric images for visualization of complex details of historical buildings. International Archives of the Photogrammetry, Remote Sensing and Spatial
Information Sciences - ISPRS Archives, Vol. 40(5W4), pp.
431–436.
Guarnieri, a, Remondino, F., & Vettore, A., 2006. Digital Photogrammetry and Tls Data Fusion Applied To Cultural Heritage 3D Modeling. Digital Photogrammetry and Tls Data
Fusion Applied To Cultural Heritage 3D Modeling, 36(5), 1–6.
Hassani, F., 2015. Documentation of cultural heritage techniques, potentials and constraints. International Archives of the Photogrammetry, Remote Sensing and Spatial Information
Sciences - ISPRS Archives, Vol. 40(5W7), pp. 207–214.
Oliensis, J., 2000. A Critique of Structure-from-Motion Algorithms. Computer Vision and Image Understanding, 80(2), 172–214.
Stathopoulou, E. K., Georgopoulos, A., Panagiotopoulos, G., & Kaliampakos, D., 2015. Crowdsourcing Lost Cultural Heritage. ISPRS Annals of Photogrammetry, Remote Sensing and Spatial Information Sciences, Vol. II-5/W3, pp. 295–300.
Westoby, M. J., Brasington, J., Glasser, N. F., Hambrey, M. J., & Reynolds, J. M., 2012. "Structure-from-Motion" photogrammetry: A low-cost, effective tool for geoscience applications. Geomorphology, 179, 300–314.
Wu, C., 2011. VisualSFM: A visual structure from motion system. JOUR.