OPTIMISATION OF FUZZY BASED SOFT CLASSIFIERS FOR REMOTE SENSING
DATA
*
Rakesh Dwivedia,*,*Anil Kumarb, S. K. Ghosha , P. S. Royb a
Indian Institute of Technology Roorkee, India
bIndian Institute of Remote Sensing, Dehradun, India
KEYWORDS: Fuzzy c-Mean (FCM), Possiblistic c-Mean (PCM), Noise clustering (NC), Sub pixel confusion uncertainty
matrix (SCM) ABSTRACT:
Classification of satellite images are complex process and accuracy of the output is dependent on classifier parameters. This paper examines the effect of various parameters like weighted exponent ‘m’ for FCM , PCM classifiers and weighted exponent ‘m’ as well as fixed parameter ‘?’ for NC without entropy based algorithm. The prime focus in this work is to select suitable parameters for classification of remotely sensed data which improves the accuracy of classification output. The uncertainty criterion has been estimated from sub-pixel confusion uncertainty matrix (SCM), based on classified and testing outputs. Therefore, these criterions are dependent on the error of the results and sensitive to error variations. So it has also been tried to estimate entropy, based on outputs generated by various classifiers like FCM, PCM and NC without entropy based classifier, hence this computed entropy is sensitive to uncertainty variations. The AWiFS and LISS-III datasets are being used for classification and testing respectively. Soft classified outputs from FCM, PCM and NC without entropy classifiers for AWiFS and LISS-III have been evaluated using SCM, overall accuracy, fuzzy kappa coefficient and entropy. The SCM and fuzzy kappa coefficients are used to major relative accuracies, while entropy is an absolute uncertainty indicator. From resultant aspect, while monitoring entropy of fraction images for different regularizing parameter values, optimum regularizing parameter has been obtained for ‘m’=2.0 and ‘?’=1, which gives highest accuracy from sub-pixel confusion uncertainty matrix (SCM) i.e. 96.27% and AWiFS entropy has been 0.71 using noise clustering without entropy based classifier
.
* Corresponding author.
1. INTRODUCTION
A traditional hard classification technique of satellite data does not take into account gradual spatial variation in land cover classes. To incorporate the gradual boundary change problem researchers had proposed the ‘soft’ classification techniques that decompose the pixel into class proportions (Fisher, 1997). Fuzzy classification is a soft classification technique (Binaghi and Rampini 1993), which deals with vagueness in class definition (Foody et al. 1996). Therefore it can model the gradual spatial transition between land cover classes. Fuzzy c-Means (FCM) (Bezdek, et al., 1980; Ehrlich et al., 1984., Bezdek et al., 1987) is an unsupervised clustering algorithm which has been widely used to find fuzzy membership grades between 0 and 1. The aim of FCM is to find cluster centres in the feature space such that it minimizes the intra-class variation and maximizes the inter-class distances using an objective function. Standard FCM algorithm considers the spectral characteristics. Fuzzy c-Means supervised classification algorithm has been widely used to classify satellite images with ambiguous land cover classes. It is a popular fuzzy set theory based soft classifier, which handles the vagueness of a pixel at sub-pixel level. FCM has been successful in assigning the membership (uij) of a pixel to multiple classes but this assignment is relative to total number of classes defined and not absolute (Krishnapuram and Keller, 1993, Foody 2000). This is due to the constraint imposed on the membership values as given by the Eq. (1)
1
1
c ij i
u for all i
= =
∑
(1)The main motivation behind Possibilistic c-Means (PCM) relates to the relaxaction of the constraint on membership value in (1) and gives absolute membership value, as stated by Eq. (2) maxiuij>0 for all j (2) In case of PCM, this membership value represents the “degree of belongingness or compatibility or typicality”, contrary to that represented by FCM, where it is, “degree of sharing”. An important aspect in classification is the presence of noise, which
may have been introduced at any stage of data collection and transmission. This affects the performance of any classification algorithm. Literature reveals that a good solution to this problem does not exist. An ideal solution would be one where the noise points get automatically identified and removed from the data. A concept of "Noise Cluster” can be introduced such that noisy data points may be assigned to the noise class. The approach is developed for an objective functional type (K-means or fuzzy K-(K-means) algorithm, and its ability to detect 'good' clusters amongst noisy data has been aptly demonstrated by (Dave, 1991). The approach is applicable to both fuzzy supervised classification algorithms as well as regression based methods. In supervised classification, validity plays a pivotal role in achieving a robust classification because without the concept of validity, it is neither possible to separate the good points from the noise points and outliers nor access the quality of the solution. The solution to the robust clustering problem requires that the algorithm reject noise data before it computes the parameter estimates (Dave and Krishnapuram, 1997). The purpose of study of noise clustering without entropy is not only to establish a connection between fuzzy set theory and robust statistics, but also to discuss and compare several popular clustering methods from the point of view of robustness (Dave, 1990; Foody et al. 1995). The aim of this paper is to study the behaviour of associated parameters of FCM, PCM and noise clustering without entropy with respect to fuzzy accuracy assessment parameters and entropy as uncertainty indicator. In the next section, the details of parameters considered in FCM, PCM and noise clustering without entropy are provided.
2.CLASSIFIERS AND ACCURACY ASSESSMENT
APPROACHES
2.1 Fuzzy c-Means Approach (FCM)
point belongs to a cluster to some degree that is specified by a membership grade, and the sum of the memberships for each pixel must be unity. This can be achieved by minimizing the generalized least - square error objective function in Eq. (3),
( )
2Subject to constraints Eq (4),
where Xi is the vector denoting spectral response of a pixel i, x is the collection of vector of cluster centers xj, µij are class membership values of a pixel, c and N are number of clusters and pixels respectively, m is a weighting exponent (1<m<∞), which controls the degree of fuzziness, 2
i j A
where A is the weight matrix. Amongst a number of A-norms, three namely Euclidean, Diagonal and Mahalonobis norm, each induced by specific weight matrix, are widely used. The formulations of each norm are given as (Bezdek, 1981) in Eq (6),
Where I is the identity matrix, Dj is the diagonal matrix having diagonal elements as the eigen values of the variance covariance matrix, Cj given in Eq (7),
2.2 Possibilistic c-Means Approach (PCM)
In PCM, for a good classification is it expected that actual feature classes will have high membership value, while unrepresentative features will have low membership values (Krishnapuram and Keller, 1993). The objective function, which satisfies this requirement, may be formulated in Eq (10);
( )
2(
)
demands that the distances from the feature vectors to the prototypes be as low as possible, whereas the second term forces the µij to be as large as possible, thus avoiding the trivial solution. Generally, ηj depends on the shape and average size of the cluster j and its value may be computed in Eq (11);
Where K is a constant and is generally kept as one. After this, class memberships, µij are obtained in Eq (12);
2.3 Noise clustering without Entropy
A concept of "Noise Cluster' was introduced such that noisy data points may be assigned to the noise class. The approach is developed for objective functional type (means or fuzzy K-means) algorithms, and its ability to detect 'good' clusters amongst noisy data is demonstrated (Dave and Krishnapuram, 1997). Noise clustering, as a robust clustering method, performs partitioning of data sets reducing errors caused by outliers. In many situations outliers contain important information and their correct identification are crucial. NC is a method, which can be adapted to any prototype-based clustering algorithm like k-means and fuzzy c-means (FCM) (Frank, et al. 2007).The main concept of the NC algorithm is the introduction of a single noise cluster that will hopefully contain all noise data points . Data points whose distances to all clusters exceed a certain threshold are considered as outlier. This distance is called the noise distance. The presence of the noise cluster allows outliers to have arbitrarily small memberships in good clusters (Dave, et al. 2007). In other classifiers where noise data points are not separate and present in information class, may lead to some kind of information scepticism. The objective function, which satisfies this requirement, may be formulated in EQ (13), (14) and (15);
(
)
(
)
Where 8 >m>1, (any constant float value more than 1) N= row * column (image size)
i = stands for pixel position at ith location distance between X i and Vj
0,
any float value greater than zero(
) (
)
Silván-Cárdenas and Wang, (2007) developed theoretical grounds, for a more general accuracy assessment of soft classifications, which account for the soft class distribution uncertainty.
In formal grounds, one requires the agreement-disagreement measure to conform Eq. (16), where A and D denote agreement and disagreement operators respectively, where
'
denote the over and underestimation errors at pixel n in Eq (16).
(
)
(
(
' ')
)
Practically, it is convenient to express each confusion interval in the form
P
kl±
U
klwhere Pkl and Ukl are the interval center and the interval half-width, respectively. These are computed as indicated by Eq.(17) and (18), respectively. The general structure of SCM is provided in Silvan-Cardenes and Wang (2007). With the availability of IRS-P6 satellite data it is possible to acquire spectrally same and spatial different data sets of same area with same acquisition time. Due to the uniqueness of availability of these data sets, soft fraction images generated from coarser resolution data set (e.g. AWIFS, IRS-P6) can be evaluated from fraction images generated from finer resolution data sets (e.g. LISS-III, IRS-P6) as reference data set acquired at same time.For the uncertainty visualization and evaluation of the classification results, the entropy criterion is proposed. This measure expresses by the following Eq.(17):
2
For high uncertainty, the calculated entropy (Eq. (17)) is high and inverse. Therefore this criterion can visualize the pure uncertainty of the classification results.
3. STUDY AREA AND DATA USED
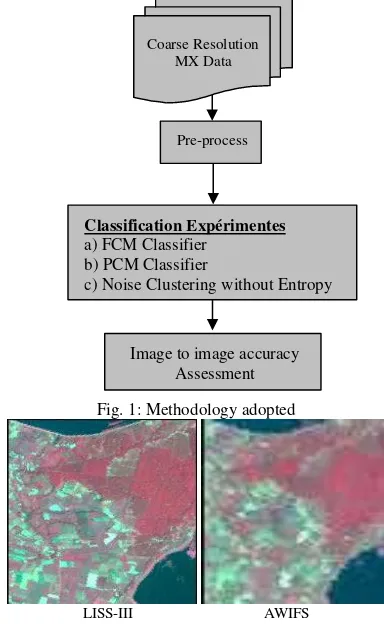
The study area for the present research work belongs to Sitarganj Tehsil, Udham Singh Nagar District, Uttarakhand, India. It is located in the southern part of the state. In terms of geographic latitude/longitude, the area extends from 28°52’29”N to 28°54’20”N and 79°34’25”E to 79°36’34”E. The area consists of agricultural farms with sugarcane and paddy as one of the few major crops with two reservoirs namely, Dhora and Bhagul reservoir. The images for this research work have been taken from two different sensors namely AWIFS and LISS-III belonging to satellite IRS-P6 as shown in Figure 2.The AWIFS dataset used here for classification and LISS III for referencing purposes.
4. METHODOLOGY
Two datasets (AWIFS, and LISS-III) were geometrically corrected with RMSE less than 1/3 of a pixel and resampled using nearest neighbour resample method at 60m, and 20m
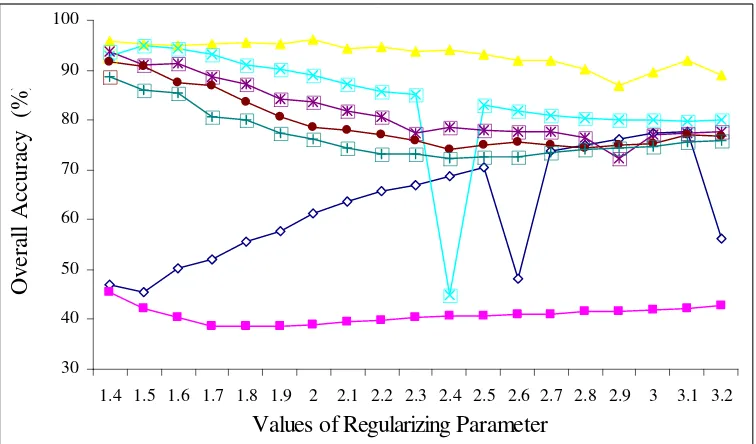
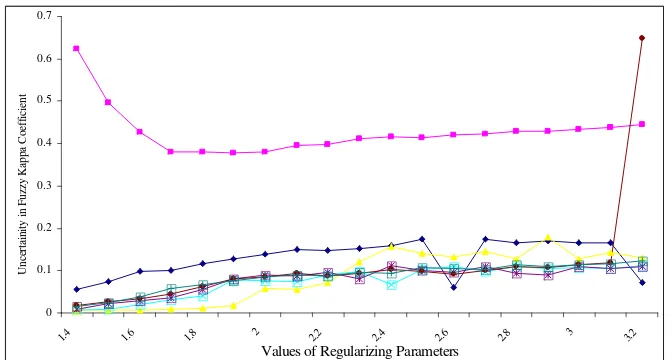
spatial resolution respectively to maintain the correspondence of a AWIFS pixel with specific number of LISS-III pixels (here 9 pixels of LISS-III, corresponding to one pixel of AWIFS) with respect to sampling during accuracy assessment. The flow chart of the methodology adopted is shown in Fig. 1. The six classes of interest, namely deciduous forest, eucalyptus plantation, water bodies, agriculture with crop, agriculture without crop, and moist agriculture without crop have been taken for this study work. Training data was collected with the help of field data and testing was conducted while taking 100 samples per class and total 600 samples randomly selected. In first part of this research work it has been tried to find out the optimum value of weighting exponent ‘m’ for FCM and PCM classifiers after that performed the experimentation on noise clustering without entropy based classifier where it has tried to find out the optimum value of regularizing parameter (?) with respect to fuzzy overall accuracy and fuzzy kappa coefficient. The range of regularizing parameter has been taken from 1 to 40 with the interval of 10, and the values of weighting exponent is varying from 1.4 to 3.2, fuzzy overall accuracy, fuzzy kappa coefficient and uncertainty in accuracy parameters have been estimated for different LISS-III and AWIFS data sets. It has been observed that as regularizing parameter increases, fuzzy overall accuracy as well as fuzzy kappa coefficient also increases as shown in Fig. 3 and 5. But it has also observed that uncertainty in fuzzy overall also increases in a given Fig. 4 and 6. So, it was important to decide what should be the appropriate regularizing parameter value to be used in noise clustering without entropy based fuzzy classifier.
Fig. 1: Methodology adopted
LISS-III AWIFS
Fig. 2: Location of study area Pre-process
c) Noise Clustering without Entropy
5. RESULTS AND DISCUSSIONS
The uncertainty is a significant issue in the classification of remote sensing data. The uncertainty estimation of the classification results is important and necessary to evaluate the classifier performance. In this paper, we addressed the evaluation of FCM, PCM and Noise Clustering without Entropy
based classifier, while estimating uncertainty in fuzzy overall accuracy and fuzzy kappa coefficient with varying spatial resolution of classification and reference sub-pixel outputs. The uncertainty criteria have been estimated from SCM matrix based on actual and desired outputs of classifier. Therefore, these criteria are dependent on the error of the results and sensitive to error variations. So it has also been tried to estimate entropy, based on actual outputs of classifier and hence is sensitive to uncertain variations.
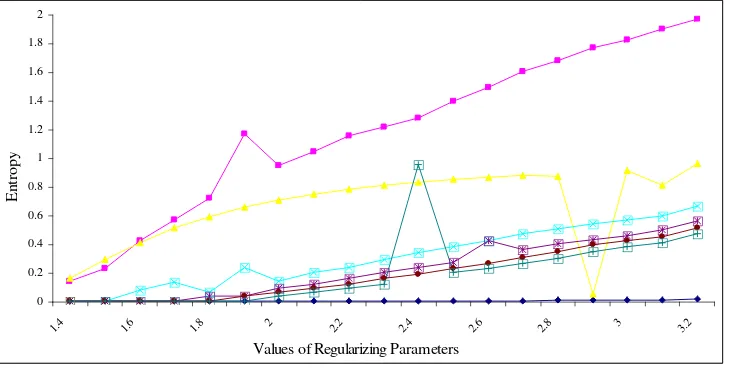
In this research work performance of each classifier was estimated based on overall accuracy, fuzzy kappa coefficient, uncertainty in overall accuracy and fuzzy kappa coefficient and entropy mentioned in Fig 3, 5, 7 respectively. In this paper, we addressed the evaluation of FCM classifier, PCM classifier and noise clustering without entropy while estimating uncertainty and overall accuracy from SCM and fuzzy kappa coefficients shown in Table 1 and Fig. 3, 4, 5 and 6 for AWIFS with LISS-III. From the Fig. 7 it is clear that the entropy is higher for AWIFS in case of PCM classifier.
6. CONCLUSION
In this research work performance of each classifier was estimated based on overall accuracy, fuzzy kappa coefficient, uncertainty in overall accuracy and fuzzy kappa coefficient and entropy. It has been tried to generate fraction outputs from FCM, PCM, and noise clustering without entropy. These outputs have been generated from AWIFS as well as LISS-III images of IRS-P6 data. Fuzzy overall accuracy and fuzzy kappa coefficient are relative accuracy assessment but entropy is an absolute uncertainty indicator.
Table 1: Overall maximum fuzzy accuracy from
different classifiers with optimum parameters
Classifier
Regularizing parameter
Fuzzy Overall
accuracy (SCM)
Uncertainty in fuzzy Overall accuracy Fuzzy Kappa coefficient
Uncertainty in fuzzy Kappa coefficien
t
AWiFS Entropy
FCM 3.1 77.58 11.93 0.700 0.165 0.01 PCM 1.4 45.41 30.65 0.0919 0.623 0.14 Noise
Clusteri ng without Entropy
2.0 and delta =1
96.27 0.29 0.494 0.058 0.71
The following legends are used in graphs.
30 40 50 60 70 80 90 100
1.4 1.5 1.6 1.7 1.8 1.9 2 2.1 2.2 2.3 2.4 2.5 2.6 2.7 2.8 2.9 3 3.1 3.2
Values of Regularizing Parameter
Overall Accuracy (%)
0 5 10 15 20 25 30 35 40
1.4 1.5 1.6 1.7 1.8 1.9 2 2.1 2.2 2.3 2.4 2.5 2.6 2.7 2.8 2.9 3 3.1 3.2
Values of Regularizing paramaters
Uncerainity in Overall accuracy
Figure 4: SCM Uncertainty for different classifiers of AWIFS with LISS-III
0 0.1 0.2 0.3 0.4 0.5 0.6 0.7 0.8
1.4 1.5 1.6 1.7 1.8 1.9 2 2.1 2.2 2.3 2.4 2.5 2.6 2.7 2.8 2.9 3 3.1 3.2 Regularizing Parameters
Fuzzy Kappa Coeficients
Figure 5: Fuzzy kappa Coefficient for different classifiers of AWIFS with LISS-III
0 0.1 0.2 0.3 0.4 0.5 0.6 0.7
1.4 1.6 1.8 2 2.2 2.4 2.6 2.8 3 3.2
Values of Regularizing Parameters
Uncertainity in Fuzzy Kappa Coefficient
0 0.2 0.4 0.6 0.8 1 1.2 1.4 1.6 1.8 2
1.4 1.6 1.8 2 2.2 2.4 2.6 2.8 3 3.2
Values of Regularizing Parameters
Entropy
Figure 7: Entropy for different classifiers from AWIFS image
From resultant Table 1 and Fig. 7, while monitoring entropy of fraction images for different regularizing parameter values, optimum regularizing parameter has been obtained for ‘m’=2.0 and ‘?’=1, which gives highest accuracy (SCM) i.e. 96.27%.While using noise clustering without entropy classifier for fraction image generation fuzzy overall accuracy as well as fuzzy kappa coefficient is high but uncertainty in these parameters as well as entropy (absolute indicator of uncertainty) is also higher. From this work it can be concluded that output from noise clustering without entropy classifier has higher classification accuracy with higher uncertainty with respect to FCM and PCM based classifiers.
7. REFERENCES
Binaghi, E. and Rampini, A., 1993. Fuzzy decision making in the classification of multisource remote sensing data. Optical Engineering 6, 1193-1203.
Bezdek, J.C., 1980. A convergence theorem for the fuzzy ISODATA clustering algorithms. IEEE Trans. on Pattern Anal. Machine Intell., PAMI-2(1): 1-8.
Bezdek, J.C., Ehrlich, R., and Full, W., 1984. FCM: the fuzzy c-means clustering algorithm.Computers & Geosciences, 10(2-3): 191-203.
Bezdek, J.C., Hathaway, R.J., Sabin, M.J., and Tucker, W.T., 1987. Convergence theory for fuzzy c-means: counterexamples and repairs. IEEE Trans. on Syst., Man, Cybern., SMC-17(5):873-877.
Bezdek, J. C. 1981. Pattern Recognition with Fuzzy Objective Function Algorithms, Plenum, New York, USA.
Dave, R. N. 1990. Fuzzy-shell clustering and applications to circle detection in digital images, Int. J. General Syst., vol. 16, pp. 343–355.
Dave, R.N., 1991. Characterization and detection of noise in clustering, Pattern Recognition Letters 12, 657-664.
Dave R. N. and Krishnapuram, R., 1997. Robust Clustering Methods: A Unified View. IEEE Transactions on Fuzzy Systems, VOL. 5, NO. 2, May.
Dave, R.N., Sen., 1997. " On Generalizing the Noise Clustering Algorithms"; 7th IFSA World Congress; Prague ; pp 205-210. Fisher P, 1997. The pixel: a snare and a delusion, International Journal of Remote Sensing, vol 18, no.3, pp 679-685.
Foody G. M., 1995, Cross-entropy for the evaluation of the accuracy of a fuzzy land cover classification with fuzzy ground data. ISPRS Journal of Photogrammetry and remote sensing, 50, 2-12.
Foody, G. M., 1996, Approaches for the production and evaluation of fuzzy land cover classifications from remotely sensed data. International Journal of Remote Sensing, vol. 17, no. 7, pp. 1317-1340.
Foody, G M 2000. Estimation of sub-pixel land cover composition in the presence of untrained classes, Computers and Geosciences, vol 26,pp 469-478.
Frank, R. and, Frank K. Rudolf Kruse, 2007 ;” A novel approach to noise clustering for outlier detection”; Soft Compute, Springer-Verlag; pp 489–494Krishnapuram, R and Keller, J M 1993. A possibilistic approach to clustering, IEEE Transactions on Fuzzy System, vol 1,no. 2,pp 98-110.