INFLUENCE OF DEM IN WATERSHED MANAGEMENT AS FLOOD ZONATION
MAPPING
Muhamad Alrajhi, Mudasir-Khan, Mohammad Afroz Khan, Abdalla Alobeid
Dept. of Surveying and Mapping, Ministry of Municipal and Rural Affairs, Riyadh Olaya KSA- [email protected]
Commission VIII, WG VIII/1
KEY WORDS: GIS, DEM, Drainage Pattern, Flash-Floods, Hydrological Model, Stream Network, Flow Accumulation
ABSTRACT:
Despite of valuable efforts from working groups and research organizations towards flood hazard reduction through its program, still minimal diminution from these hazards has been realized. This is mainly due to the fact that with rapid increase in population and urbanization coupled with climate change, flood hazards are becoming increasingly catastrophic. Therefore there is a need to understand and access flood hazards and develop means to deal with it through proper preparations, and preventive measures. To achieve this aim, Geographical Information System (GIS), geospatial and hydrological models were used as tools to tackle with influence of flash floods in the Kingdom of Saudi Arabia due to existence of large valleys (Wadis) which is a matter of great concern. In this research paper, Digital Elevation Models (DEMs) of different resolution (30m, 20m,10m and 5m) have been used, which have proven to be valuable tool for the topographic parameterization of hydrological models which are the basis for any flood modelling process. The DEM was used as input for performing spatial analysis and obtaining derivative products and delineate watershed characteristics of the study area using ArcGIS desktop and its Arc Hydro extension tools to check comparability of different elevation models for flood Zonation mapping. The derived drainage patterns have been overlaid over aerial imagery of study area, to check influence of greater amount of precipitation which can turn into massive destructions. The flow accumulation maps derived provide zones of highest accumulation and possible flow directions. This approach provide simplified means of predicting extent of inundation during flood events for emergency action especially for large areas because of large coverage area of the remotely sensed data.
1. INTRODUCTION
Most of the natural hazards result from potentially extreme geophysical events, such as floods, to create an unexpected threat to human life and property. When severe flash floods occur in areas occupied by humans mostly in low lying area or valleys (Wadis), they create natural disasters that involve greater loss of human life and property plus serious disruption to the ongoing activities of large urban and rural communities. Flood hazards results from a combination of physical exposure and human vulnerability reflected by key social-economic factors such as the number of people at risk in the flood plain or low-lying zone, the extent of flood, and the ability of the population to anticipate and cope up with hazard.
The Wadis or valleys act as natural bowl (container) which on receiving right amount of precipitation gets filled up, resulting in sudden runoff of water in the form of streams causing flash floods, which directly affect the sustainability of concerned area or region. Catastrophic flash floods occurring in Wadis on one hand, a threat to many communities and on the other hand, major groundwater recharge source after storms.
The topography of the Kingdom of Saudi Arabia supports existence of large Wadis naturally, also with rapid developments and changing basement conditions increase chances at rapid speed. The water accumulating from precipitation did not percolate down directly, due to altered ground conditions. Such conditions were responsible for the flash floods of Jeddah during the past.
The interpolatio also vary. Geog allow the user to to build a sing DEMs is extre through the hy simulated hydro the DEM used models are used to investigate ar runoff water.
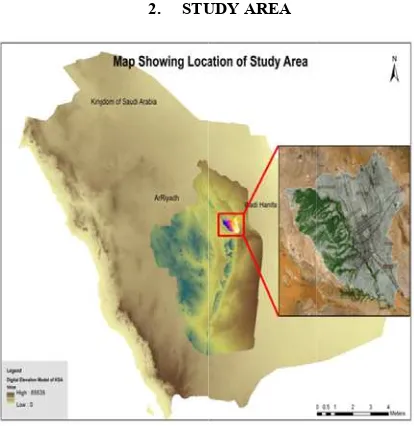
Figure 1. Show Located in the Saudi Arabia, significant natu (Figure 1). Its b kilometer-long Tuwaiq escarpm of Riyadh. T henceforth to th of Riyadh.
An oasis at the Hanifa watershe communities a prevailed betwe and the people and human inte inhabitants of th their survival an
The first Saud Addiriyyah city advantage of w Riyadh or Arriy state, developed expansion of R and the wadi ex wadi used as a s
on technique an graphic Informat o combine diffe gle DEM. The emely variable. ydrological mod ographs is strong d (Lagacherie, e
d to delineate ri reas which are d
2. STU
ws Imagery of W middle of Najd the Wadi Han ural landmark basin and many
ecological zon ment in the north The developmen he wetlands) is in
e heart of the A ed system has l along its length een the water, la
living around i erventions. This he wadi were co nd prosperity.
di state strategi y on the west b water, stone, and yadh city, the new
d to the east of Riyadh that starte
xisted in harmo sustainable resou
nd grid size of t ion Systems (GI rent topographic accuracy of th As DEM erro del so, the acc
gly related to th et.al., 1996).Dig iver networks an directly under th
UDY AREA
Wadi Hanifa in R d Plateau in the nifa watershed in the region tributaries form ne that descen hwest to open de nt of the wa nextricably tied
Arabian Peninsu long provided s h. For centurie and and resource it, between natu stability existe ompletely depen
ically located bank of Wadi H d arable lands.
w capital of the Wadi Hanifa. U ed in the mid-1 ony with each o urce for water an
the DEM can IS) algorithms cal data layers hese different ors propagate curacy of the he accuracy of gital elevation nd watersheds he influence of
iyadh – KSA esert southeast adi (referring to the history
ula, the Wadi sustenance for es a balance es of the wadi ural processes d because the ndent on it for
its capital at Hanifa, taking Subsequently, modern Saudi Until the rapid 970s, the city
di System Char
regions, water i ure natural-reso of the world ions, increasing esources as well
e Target Waters
aforementioned in the arid an ent area in Riy due to the impo flash flood and ect and major im urban and rural p
3. different reso satellite imag stream flow Evaluation o elevation v resolutions of To present th and derived operations in support, add strategic and the presented of flood zonat
4. M rrent study was c esignated to in hed management 2) and deter tation for decis entioned object d: Digital Elevati and (20m, 10 aphical data of ( pal and Rural A e-1(0.5m) resolu extensively used e to generate se ted maps from e pattern or stre n, and flood haz
racteristics
s one of the mo ources issues. Th
are characterize g per-capita wa
as draught and f
shed Basins
characteristics a nd semi-arid re yadh has been ortance not only drought threat. I mpact of Wadi population in the
OBJECTIVE
analysis of d on different re y of derived ri lutions of DEM ation of derived olutions of DEM gery to check th
of Standard values obtaine f DEM
he applicability d spatial infor hydrological m dressing the the operative flood d modelling tech
tion mapping.
METHODOLO carried out for W nvestigate influ t as flood zonati rmine inundated
sion and plann tives, the follo ion Model (DEM m, and 5m) w (1:1,000) scale m Affairs (MOMR
ution from (M d and analyze ets of digital ma m digital eleva am network, flo zard map.
ost challenging c he arid and sem ed by the expa ater use, and l flash flood threa
and problems of egions, Wadi H
selected from as water resour In other words, system on secur e kingdom.
S
flow accumu solutions of DEM iver profile bas
d stream network M on GeoEye he exact match
deviation erro ed from dif
of elevation m rmation using modelling for de eoretical suppo d prevention, m hnique an integra
GY
Wadi Hanifa in R uence of (DEM
ion mapping sho d areas during ning. To achiev owing methods M) ASTER-30m were generated map from Minis RA), Satellite Im MOMRA) which
Figure 2. Showi
Tremendous g engineering ind terrain data. Th manage all infra by new spatia include mobil cartographic an modelling. DE information sys digitally produc
Figure
4.1 Hydrologic The 30m reso generated DEM been subjected direction of flow comparability a from different e on flow accumu
The same appr elevation mod accumulation an
ing Methodology
growth in th dustries has cre
his data will a astructure growt al applications. e communicat nalysis, slope a EM’s areas u stems, and are ced relief maps a
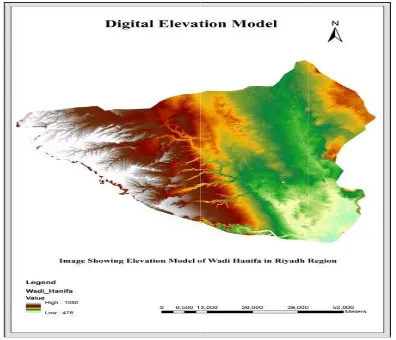
3. Showing DEM
al Modeling olution DEM o M’s of (20m, 10 to various hydr w and flow accu analysis betwee elevation models ulation maps as s
roach is used to els which inc nd flood hazard
y for Hydrologic
he telecommun eated a greater allow engineers th with the nece
Other primary tions, terrain
analysis, and e used often in the most comm as shown in Figu
M of the Study A
obtained from 0m, and 5m) re
ological analysi umulation in orde
en stream netw s of different reso shown in Figure
o derive other p clude, flow dir d maps with stre
cal Modelling.
nication and r demand for to plan and ssary required y applications visualization, environmental n geographic mon basis for ure 3.
Area.
(USGS) and esolutions has is to study the er to carry out works derived olutions based
4.
products from rection, flow eam networks
which h for miti
Figure 4
4.2 Dra The dra lineame surfaces shape. T internal Therefo changes that ar network shown i
Figu
Assessin deforma the witn have d behavio drainag
has been overlai gation of inunda
4. Showing Com
ainage pattern ainage map of ents in the area s is an important The terrain shap and external fa ore, certain chara s in flow directi e recognizable k extracted from in Figure 5.
ure 5. Showing D
ng drainage sy ation is getting v nessing of erosiv isconnected, lin or of drainage e network is clea
d on(0.5m) Geo ated areas during
mparison of Flow Study Area.
an area is a u . The movemen t feature governe pe, on the other h actors that collec
acteristic drainag ion can be attrib
on the satell m DEM using di
Drainage pattern
ystems in the very important b ve and tectonic nearized and c system. The arly influenced b
oEye-1, satellite g high precipitati
w Accumulation
useful tool to te nt of water ove ed primarily by t hand, is a result ctively shape the ge patterns and s
buted to the fra lite image. Dr ifferent threshol
n of the study are
context of s because they rep processes which hanged the den morphology o by geological for
image ion.
of the
est the er land terrain t of all e area. sudden actures ainage lds are
ea.
different stages. spatially distrib changes (dendri The straight stre in the stream o mainly due to h patterns can be water channels and spurs result branches. Dend variety of direc very slight slope
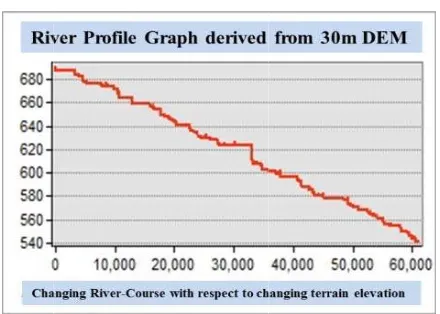
4.3 Comparabi The river netwo operated for var which results f areas which rec channels where These high flow system of wad reaches to dow dendritic, radial dominated by d water is mostly channel in mean The comparabi based on the resolutions of D studies reveal th course of river a of a river with details about the DEM changes i Figure 6b. The DEM shows a s without much cu as shown in Fi different resolu calculated and s graph for visual
Figure 6a. Sho
. The study area buted drainage p itic) and straight eam line pattern orientation due human intervent easily recogniz thus flow throug ting in a pattern dritic patterns, w ctions, are comm e, and little or no
ility of River Pr ork obtained for rious processes t flow accumulati eive highest pre runoff flow is m w zones form ch
dis. The water wnwardsin diff l and rectangular dendritic pattern y coming from ndering pattern in
lity of main riv drainage netwo DEM, to check th hat high resolut as shown in Fig h changing elev
e river meanderi it shows lesser e river profile
smooth downwa urves with chan igure 6c. The s ution DEM is co stream length in l interpretation a
owing River Prof DEM
a features mainly patterns: major
stream lines. ns consist of a s
to geotectonic ions. The straig ed from satellite gh the valleys b n that resembles with channels ori mon place in ar o structural influ
rofiles r Wadi Hanifa b
to derive flow di ion maps to de ecipitation and re more.
hannels and delin always flows ferent network
r, but the curren of stream netw higher reaches n low-lying area ver channel wa ork obtained fr he course of deri tion DEM provi gure 6a, which d vations and pro ing, while as the river meanderin obtained for 30 ard movement o nging elevations stream network ompared based n order to deline s shown in Figu
file Graph derive M.
y two types of stream course
udden change conditions or ht stream line e images. The between ridges a tree and its iented in wide reas of nil or uence.
basin has been irection maps, elineate those epresent those
neate network from higher systems like nt study area is ork where the feeding main as of the wadi. as carried out from different ived river. The ide exact flow delineates flow ovides greater e resolution of ng as show in 0m resolution of river course of the Terrain derived from on elevations ate 3D profile re 6d.
ed from 10m
Figure
Figure
Figur
e 6b. Showing R
e 6c. Showing Ri
re 6d. Showing c stream lengt
iver Profile Grap DEM.
iver Profile Grap DEM.
comparison of st th based on diffe
ph derived from
ph derived from
tream elevation erent DEM.
20m
30m
4.4 Overlay An The drainage ne was overlaid on to check the ext derived drainag stream network channels. The Elevation Mode main and subsi body as shown i
Figure 7a. Sho
Figure 7b.Sho 3
The results obt stream network of densified net but not with d which overlap i DEM as shown
nalysis etwork obtained n Satellite image tent of overlapp ge network and a k flowing thr
derived stream el (DEM) shows idiary channels in Figure 7a.
owing overlaid s 5m DEM on Ge
owing overlaid st 30m DEM on G
tained for overl derived from 3 twork, which on dense details of
in case of strea in Figure 7b.
from Digital Ele e GeoEye-1 (0.5 ping between the also to interpret ough main an m network from s almost exact o which feed the
stream network d eoEye (0.5m).
tream network d GeoEye (0.5m).
apping operatio 0m DEM show nly delineates c f feeding subsid am network deri
evation Model 5m) resolution e imagery and the course of nd subsidiary m 5m Digital overlapping of e main stream
derived from
derived from
ons in case of a greater loss ourse of river diary channels ived from 5m
4.5 Eva valu The ele Hanifa h to check referenc Ministry scale top
Figur
The nu compar been tak The spa are show
Tab
aluation of Stan ues obtained fro evation values
have been taken k and evaluate th ce values. The s y of Municipal a pographic line m
re 8. Showing ov
umber of select ative analysis ba ken along the co atial (x, y) and e wn in Table 1.
ble1. Showing th r
ndard deviation om different res of known spot n as reference for he amount of dev spot height data
and Rural Affair mapping data as
verlaid reference DEM ted reference p ased on different ourse of main ch elevation values
he spatial and ele reference points
n errors for elev solutions of DE
points for the r comparative an viation of result a has been taken
rs (MOMRA) 1 shown in Figure
e elevation point
points for cond t elevation mode hannel in wadiH (z) for the stud
evation values fo vation M e wadi nalysis s from n from :1,000 e 8.
s on
ducting els has Hanifa. dy area
The comparativ DEM and refere deviation than f sequence. The r more errors th deviation values
Table2. Show comput The standard de shows a smooth values for 5m ( increases. The values is shown
Figure 9. Show
4.6 Flood Haza The flood hazar areas and low population, whi indirectly either lying areas, wh both cases decr in flooding like and in the city
ve results obtain ence points show followed by 10m results obtained d han 5m resoluti s can be seen in
wing standard de ted from differen eviation graph d h and positive t (DEM) and beco standard deviat n in Figure 9.
wing standard de valu
ard Map for Wa rd map provides w lying plain ch are altering t r by construction hich possibly h rease infiltration situations. Also and commercia
ned for different w that 5m (DEM m, 20m and 30m delineate that 30 ion of DEM. Table 2.
eviation of eleva nt resolutions of derived from com
trend for compu ome courser as tion graph for
eviation graph fo ues
adi Hanifa information abo ns mostly con
the Wadi baseme n or by dumping have adverse ef n capacity of riv o due to signific al activity affec
t resolution of M) shows less m (DEM) in a 0m (DEM) has The standard
ation values DEM mpared values uted elevation the resolution the computed
or compared
out high reach ncentrated by ent directly or wastes in low ffects because ver and results cant expansion cted the Wadi
badly. construc shown i data pal channel As a re erosion Stagnan
Figure
From t expecte shown directio and othe
Figu
The com morpho to easily which a
Quarrying for ction work unde in Figure 10. Th lm plantations f l, which further esult, the seaso and swept pollu nt water jeopardi
10. Showing und
the deduced dr d flooding dire in Figure 11. I ns for the rainf er towards south
ure 11.Showing f
mparative resul ometric features y interpret the b are possibly dan
stone and ext ercut the banks o here was unregu flanking the Wad r impeded by u
nal flash floods utants into resid ized public healt
dercut banks of f Hanifa.
ainage pattern ections can be In general ther fall water, one t heast directions.
flood hazard ma
lts of DEM and and drainage pa basin with upper ngerous during
tractions of so of the flood chan ulated mineral m di encroached in uncontrolled dum s caused unnec dential neighborh
th.
flood channel in
the scenario fo easily estimat re are two disti towards the nort
ap for Wadi Hani
d its relevant d attern make it po
r and low-lying flash flooding
oil for nnel as mining, n flow mping. cessary hoods.
n Wadi
for the ted as inctive thwest
ifa.
Also more investigations for Wadi-Hanifa show that drainage pattern is helpful in determining the directions of running water and the possible locations where it accumulates. The flow accumulation maps derived from high resolution DEM provide the highest possible areas which receive precipitations and can help to mitigate its directions also.
4.7 Flood Control in the Desert
Riyadh receives an average of 100 millimeters (4”) of rain each year, that’s not much but it tends to come in the form of sudden downpours. Only 10 days per year on average have rain and nearly all come between January and April. Across the Najd desert that surrounds Riyadh, these rains flow naturally into Wadis. Since the Najd tilts from the high ground northwest of Riyadh south and east toward the Gulf coast, all of Najd’s small wadis feed their runoff water into one major artery: Wadi Hanifah. This means that by the time waters reach the edge of Riyadh, they often swelled into potentially destructive flash floods.
5. RESULTS AND DISCUSSIONS Digital Elevation Models play a very important role for watershed management because the surface water features and storm-water runoff within a watershed ultimately drain into other bodies of water. It is essential to consider these downstream impacts when developing and implementing water quality protection and restoration actions. Everything upstream ends up downstream. We need to remember that we all live downstream and that our everyday activities can affect downstream waters.
The flow accumulation networks obtained clearly depicts those areas which are directly at risk during high precipitation conditions and provides zones of high accumulations where water seeps down quickly and simultaneously delineating run-off water.
The inundation map obtained from DEM also provide major change of elevations and maximum approximation for flooding extend during high precipitation, thus inundation maps plays a crucial role in helping decision-makers to take appropriate measures that alleviate and reduce the adverse impact of floods.
No doubt the study provides broader spectrum about the hydrology of the Wadi Hanifa but simultaneously the study visualizes us about the natural disasters which surrounds the Wadi. During high or even in moderate precipitation, water will move directly towards low-lying areas as run-off. The run-off water will directly influence lower reaches as the water absorbing capacity of soil is less due to changing basement and will remain continuously changing with human interventions. The state of architecture is constantly changing due to which the basement of the terrain is also getting altered, which affect the water holding capacity of the underground surface, due to which the water remains localized in the upper surface and results in flood like situations. Thus, current study provides us informative approaches for influence of DEM in watershed management for flood zonation mapping by watershed management modelling and assessment by generating inundation maps.
6. CONCLUSION
Digital Elevation Models play a crucial role for determining hydrological system of Wadis and secondly acts as a key feature in defining flow channels in Wadis for water management and provide clear view about main stream channel, in order to engineer grading and channeling, to control its flow and minimize the destructive effects of floods.
ACKNOWLEDGMENTS
The authors would like to extend their sincere appreciation to the Ministry of Municipal and Rural Affairs for support of this research.
REFERENCES
Azizian, A. & Shokoohi, A. 2015. "Investigation of the Effects of DEM Creation Methods on the Performance of a Semi distributed Model: TOPMODEL." J. Hydrol. Eng., 10.1061/(ASCE)HE.1943-5584.0001204, 05015005
Bates, P.D., Lane, S.N. (Eds.) 2000.High Resolution Flow Modelling in Hydrology and Geomorphology, John Wiley & Sons, 2000.p. 374.
Beven, K. J., Moore, I. D. Eds.1995.Terrain analysis and distributed modelling in hydrology (Advances in Hydrological Processes), John Wiley & Sons, p. 249.
Beven, K.J., 2001. Rainfall-Runoff Modelling: The Primer, John Wiley & Sons Inc p. 372ISBN: 0-471-98533-8, Chapter 3 Data for Rainfall-Runoff Modelling
Bódis,K.,(1999).Geometriai
transzformációk,transzformációsegyenletekésalkalmazásuka geoinformatikában Applications of geometrical transformations in GIS science, Diplomathesis, Szeged p. 52.
Eric K Forkuo., 2013, the use of Digital elevation models for watershed and flood hazard mapping, Department of Geomatic Engineering Kwame Nkrumah University of Science & Technology Kumasi, Ghana pp.56-65.
Garbrecht, J., and Martz, L. W., 1996, Digital landscape parameterization for hydrological applications. In Hydro GIS 96: Applications of Geographic Information Systems in Hydrology and Water Resources Management (Proceedings of the Vienna Conference, April 1996), IAHS Publication no. 235.
Grayson, R., Blöschl Eds. 2000. Spatial patterns in Catchment Hydrology: Observations andmodelling, Cambridge University Press, 2000 ISBN 0-521-63316-8
Janet Nichol., Law K. H, 2008. The influence of DEM accuracy on topographic correction of IKONOS satellite images, Publication PERS vol.74, No.1, pp,47-53
Thesis, Department of physical Geography and Geoinformatics.
Kevin J. McGuire., JeffreyJ.McDonnell., 2006. A review and evaluation of catchment transit time modeling. Vol.330, issues 3-4, pp543-563.
Langacherie, et. al., 1996. Effects of DEM data source and sampling pattern on topographical parameters and on a topography based hydrological modelHydro GIS 96: Application of Geographic Information Systems in Hydrology and Water Resources Management (Proceedings of the Vienna Conference, April 1996). IAHS Publ. no. 235, 1996
Longley, P.A., Goodchild, M. F., Maguire, D.J., Rhind, D.W. (Eds.) (1999): Geographical Information Systems, Volume I. Principles and Technical Issues, Volume II. Management Issues and Applications, 2nd edition, Wiley, New York15
M.Saber.,T.Hamaguchi.,T.Kojiri.,K.Tanaka.2009.
Spatiotemporal runoff features of hydrological modelling in Arabian wadi basins through comparative studies, annuals of Disas.Prev.Res.Inst.,Kyto Univ., No. 52B, 2009
Matthew Teller., 2012. Report on Arab and Islamic cultures and connections
Maune, D.F, Editor 2007. Digital Elevation Model Technologies and Applications: TheDEM User’s Manual, (2nd Edition), AsprsPubns, p. 620, ISBN 1-57083-082-7
Mezősi, G., Bódis, K. 1999. Statistical Evaluation of Landscape Units, In: Kovar, P.Editor, 1999, Nature and culture in landscape ecology. Karolium, Prague, pp. 170-183.
Moore, I. D., Grayson, R. B. and Ladson, A. R. 1991. Digital terrain modelling: A review of hydrological, geomorphological, and biological applications, Hydrological Processes, Volume5 Issue 1, pp. 3 - 30. and In: Beven, K. J., Moore, I. D. (Eds.), 1995, Terrain analysis and distributed modelling in hydrology (Advances in Hydrological Processes), John Wiley &Sons,pp. 7-34.
Olaniyan, O.S,,Akolade, A.S., 2015. Flood Plain Determination using geographical information system (GIS) IJEER Publication vol.3, No.2, pp.22-36