Stanley F. Slater
UNIVERSITY OFWASHINGTON,BOTHELL
John C. Narver
UNIVERSITY OFWASHINGTON,SEATTLE
Narver and Slater’s (1990) finding of a positive relationship between Webster, 1989; Day, 1990, 1994a; Kohli and Jaworski, 1990; market orientation and business profitability is retested in a broad sample Narver and Slater, 1990; Slater and Narver, 1995). In the first of product and service businesses operating in a variety of industries. The rigorous study of the effect of a market orientation on business assessment of the extent of market orientation is provided by the chief performance, Narver and Slater (1990) developed a measure marketing officer, and profitability is assessed by the general manager, of market orientation based on the organizational behaviors thus avoiding the problem of common respondent bias. The analysis of of customer orientation, competitor orientation, and inter-the influence of culture on business performance is extended by including functional coordination. They found a significant relationship a measure of entrepreneurial orientation in the study. The influence of between market orientation and return on investment (ROI) a market orientation on business profitability is then compared with that in a sample of business units belonging to one corporation of an entrepreneurial orientation. The regression coefficient for market operating in the forest products industry. As an indicator of the orientation (.662) is higher in this replication than in the original study importance of this study, by August 1996 the Social Sciences (.501), and the pairwise correlation coefficient for the relationship between Citation Index showed 43 references to it and it is frequently market orientation and profitability is very similar in both studies (.362 cited in both marketing management and marketing strategy and .345, respectively). No relationship is found between entrepreneurial texts (e.g., Boyd, Walker, and Larreche, 1995; Kotler, 1996; orientation and business profitability. Thus, by drawing a sample from Kotler and Armstrong, 1994; Walker, Boyd, and Larreche, a more diverse population, avoiding the common respondent bias problem, 1995) and in tradebooks (e.g., Barabba and Zaltman, 1991). and comparing the effect of a market orientation to that of an entrepreneur- However, another study did not show the same results. In ial orientation, the findings from this balanced replication increase confi- two broad samples of businesses, Jaworski and Kohli (1992) dence in the importance and generalizability of the market orientation– found no relationship between their measure of market orien-profitability relationship found in the 1990 Narver and Slater study. J
tation and managers’ assessments of either ROE or market BUSN RES 2000. 48.69–73. 2000 Elsevier Science Inc. All rights
share. The finding of no results in a broad sample is troubling, reserved.
because it raises concerns about the generalizability of Narver and Slater’s (1990) result.
The Narver and Slater (1990) study also has two important research design limitations. But using business units from one
M
arket orientation is the business culture thatpro-corporation as their sampling frame, Narver and Slater gained duces outstanding performance through its
commit-access to entire top management teams in the subject strategic ment to creating superior value for customers. The
business units (SBUs), thus increasing confidence in the relia-values and beliefs implicit in this culture encourage: (1)
con-bility of their measures (Huber and Power, 1985; Slater, 1995). tinuous cross-functional learning about customers’ expressed
However, increased confidence in the internal validity of the and latent needs and about competitors’ capabilities and
strate-study comes at the expense of external validity (i.e., generaliz-gies; and (2) cross-functionally coordinated action to create
ability of the findings). It is possible, based on the Narver and and exploit the learning (e.g., Shapiro, 1988; Deshpande and
Slater study, that the market orientation–profitability relation-ship is corporation- or industry-specific. Another limitation
Address correspondence to: Dr. S. F. Slater, University of Washington, Bothell, of the Narver and Slater study concerns common respondent Department of Business Administration, 22011 26th Avenue, Bothell, WA
98021, USA. bias, because all of their measures are averages of the responses
Journal of Business Research 48, 69–73 (2000)
2000 Elsevier Science Inc. All rights reserved. ISSN 0148-2963/00/$–see front matter
from all of the informants in each SBU. Thus, the study uses orientation) and performance by introducing another substan-tive variable and assessing whether the amount of explained the same source for its assessments of both market orientation
and performance. variation in performance is increased when entrepreneurial
orientation is added to the model. Accordingly, the second Balanced replications that combine exact replications of
major study conditions with the manipulation of additional hypothesis:
substantive and/or methodological variables are an important H2: Entrepreneurial orientation and business profitability means for increasing the confidence in previous findings (Saw- are positively related.
yer and Peter, 1983). This balanced replication retests Narver and Slater’s (1990) hypothesis using the control variables that were significant in the earlier study, but it uses a broad sample of businesses and also uses different respondents’ assessment
Research Design
of market orientation and business performance in a business
unit to address the limitations in the original study. Thus, the
Sample
first hypothesis: The data were collected from 53 single-business corporations of SBUs of multibusiness corporations in three western cities H1. Market orientation and business profitability are
posi-by teams of MBA students from Strategic Management and tively related.
Marketing Strategy classes. Responses represent a wide variety of businesses (53% product, 47% service).
Data Collection
Entrepreneurial Orientation
Questionnaires were completed by the general manager, chief
and Business Performance
marketing officer, and chief human resources management We further extend the original study by considering the influ- officer in each business. Each respondent provided informa-ence of entrepreneurial orientation on profitability. It could tion about a unique set of constructs, described in the Mea-be argued that a market orientation, with its focus on under- sures subsection. This was done to avoid concern about com-standing latent needs, is inherently entrepreneurial (Kohli and mon respondent bias in survey research of this type. The Jaworski, 1990). However, Hamel and Prahalad (1994, p. 83) drawback to this type of research design is that, because it warn that a market focus, even one that is concerned with requires the cooperation of multiple informants in a business, uncovering latent needs, may miss the emergence of new it requires personal contact, which limits the number of busi-markets or segments. Others (e.g., Hayes and Wheelwright, nesses that can be included in the sample.
1984; Brown, 1991) argue that a market orientation coupled Several items were on two or more questionnaires to assess with traditional market research techniques cannot avoid fo- inter-rater reliability. We included responses from all infor-cusing the company’s efforts on the expressed needs of cus- mants in our initial calculation of coefficientaand found that
tomers, leading to incremental line extensions instead of inno- neither theafor the market orientation scale nor theafor the
vative new products. entrepreneurial orientation scale dropped below .7, indicating Where a market orientation is primarily concerned with adequate inter-rater agreement. A variety of scaling tech-learning from various forms of contact with customers and niques, described in the Measures subsection, were used to competitors in the market (Narver and Slater, 1990; Day, reduce the possibility of common method bias.
1994a), entrepreneurship is primarily concerned with learning
from experimentation (Dickson, 1992). Furthermore, an en-
Measures
trepreneurial orientation encompasses such values andbehav-We used existing scales with demonstrated measurement iors as innovativeness, risk taking, and competitive aggressive- properties for the market orientation (Narver and Slater, 1990) ness (Lumpkin and Dess, 1996), which are not explicit in a and entrepreneurial orientation (Naman and Slevin, 1993) market orientation. Thus, entrepreneurial values may enhance
constructs. We refer you to the cited sources for additional the prospects for developing a breakthrough product or
identi-information about these measures. GM means the general fying an unserved market segment, both of which are fertile
manager is the primary informant, and MK refers to the chief ground for developing competitive advantage (Hamel and
marketing officer. Responses from the chief human resources Prahalad, 1994). Webster (1994, p. 14) argues that managers
(HR) officer were used to assess inter-rater reliability. must create, “an overwhelming predisposition toward
entre-preneurial and innovative responsiveness to a changing mar- MARKET ORIENTATION (MK). We exclude two items from the original scale, one of which was concerned with inter-SBU ket.” In practice, a market orientation and entrepreneurial values
should complement each other (Slater and Narver, 1995). relationships that are not relevant to this study, and both of which had item-to-total correlations of less than .4 with their This study extends the research on the relationship between
13-item measure uses a 1 (not descriptive) to 5 (very descrip- tested with a multiple regression model employing the pre-viously described independent variables. Because the power tive) Likert-type scale (a 50.77). We conducted an
explor-atory factor analysis of the data and found three interpretable of a statistical test to reject a null hypothesis correctly is largely determined by sample size (Sawyer and Ball, 1981, p. 275), factors (all with eigenvalues greater than 1.0) that closely
cor-respond to the customer orientation, competitor orientation, both OLS and stepwise regression were used because of the and interfunctional coordination dimensions that Narver and large number of independent variables and the relatively small Slater hypothesized. Cronbach’sas for the subscales are 0.77, sample. Stepwise regression searches for the set of variables
0.40, and 0.61, respectively. that best explains variation in the data (Neter, Wasserman, and Kutner, 1983). An inspection of the scatter diagram showed no ENTREPRENEURIAL ORIENTATION (MK). Naman and Slevin’s
outliers with respect to the market orientation–profitability (1993) 7-item measure uses a 1 (not descriptive) to 5 (very
relationship (Table 2). descriptive) Likert-type scale (a 50.75).
PERFORMANCE (GM). The general manager was asked to as-
Discussion and Conclusions
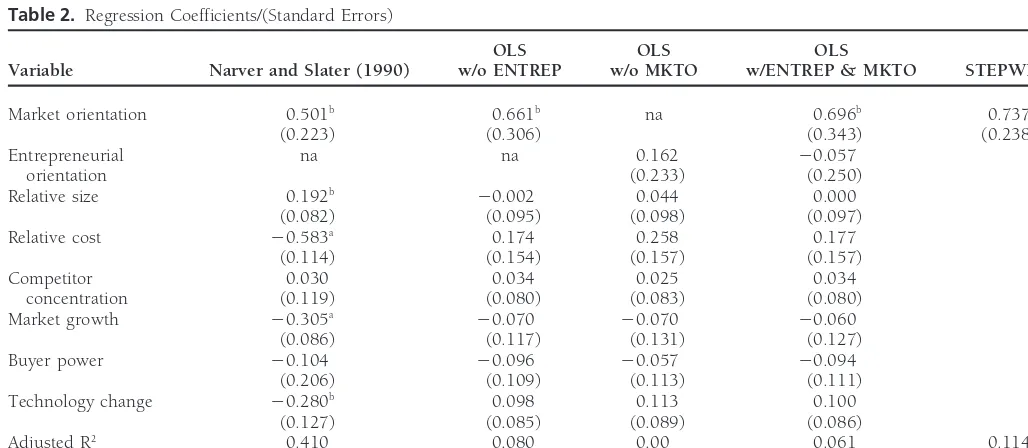
sess “the return on investment of your business over the pastHypothesis 1, market orientation and business profitability are 3 years relative to your primary competitors in your principal
positively related, is supported by both the OLS (p, 0.05)
market” on a 1 to 5 scale from “far below” to “far exceeds.”
and stepwise regression results (p,0.01), despite the
rela-Subjective measures of performance are frequently used in
tively small sample. As Sawyer and Peter (1983, p. 124) con-strategy research and have been shown to be reliable and valid
tend, because we would expect virtually always to find a (Dess and Robinson, 1984).
significant result in a study with high statistical power (i.e., a large sample), “researchers should have more confidence in
Control Variables
the study with the smaller sample.” In this study, market We include the following control variables that were related
orientation is the only significant predictor of profitability in to performance (p , 0.05) in Narver and Slater’s (1990)
either equation. regression model. Theory (e.g., Porter, 1980; Scherer, 1980)
Further supporting Narver and Slater’s (1990) result is the suggests that these variables can affect business performance.
finding that the regression coefficient for market orientation RELATIVE SIZE (GM). This was assessed with a 1–7 semantic in this study (0.662 in the OLS model and 0.737 in the differential scale from “one of the largest” to “one of the stepwise model) is somewhat higher than the coefficient found smallest” in our principal market. in the earlier study (0.501). The smaller adjusted R2s in this
study than in the Narver and Slater study may be attributable RELATIVE COST POSITION (GM). This was assessed with a 1–5
to the diversity of businesses in the sample (Slater, 1995) and scale from “very bad” to “very good.”
the lack of explanatory power provided by the set of control COMPETITIOR CONCENTRATION (MK). This was assessed with variables, not because of a weaker relationship between market a 1–7 semantic differential scale from “The four largest competi- orientation and profitability. In fact, the measure of bivariate tors in this industry account for a very large proportion of total association, the Pearson correlation coefficient, was 0.345 in industry sales” to “The four largest competitors in this industry Narver and Slater and is 0.362 in this study, providing further account for a very small proportion of total industry sales.” evidence that this relationship is robust across industry
bound-aries. And, according to Sawyer and Ball (1981), the R2s are MARKET GROWTH (GM). This was assessed on a 1–7 semantic
in the range that is often considered theoretically important differential scale from “no growth” to “demand growth is very
in social science research. We believe that the present findings high.”
reinforce Narver and Slater’s conclusion (1990, p. 34) that, BUYER POWER (MK). This was measured with a 1–7 semantic “after controlling for important market-level and business-differential scale from “Buyers are price takers” a “Buyers
level influences, market orientation and performance are have substantial bargaining power.”
strongly related.”
Surprisingly, entrepreneurial values do not add to the ex-TECHNOLOGICAL CHANGE (MK). This was measured with a
planatory power of the model; thus,H2is not supported. One 1–7 semantic differential scale from “The production/service
possible explanation is that entrepreneurial orientation has an technology is well established and not subject to very much
indirect effect on profitability, operating through product devel-change” to “The modes of production/service change often
opment or market development. If that is the case, measures and in a major way.”
of new product success or sales growth would be more likely to be directly affected by entrepreneurial orientation than would
Analysis and Results
a measure of profitability. It is also possible that entrepreneurialorientation has a delayed effect on profitability. In that case, a Table 1 contains descriptive statistics and a correlation matrix
Table 1. Descriptive Statistics and Correlation Coefficients
Mean
Variables SD MKTOR ENTREP RSIZE RCOST COMPC MKGRO BUYPOW TECHCHG ROI
Market 3.30 1.00 orientation (0.664)
Entrepreneurial 3.24 0.515a
orientation (0.814) 1.00
Relative size 5.19 0.248c 0.113 1.00
(1.84)
Relative cost 3.06 0.285b 0.273b 20.087 1.00
(1.15)
Competitor 3.30 20.056 0.002 20.081 0.114 1.00
concentration (2.06)
Market growth 4.55 0.098 0.367a 20.226c 0.282b 0.064 1.00
(1.50)
Buyer power 4.26 0.117 0.004 20.071 20.136 20.144 20.242c 1.00
(1.57)
Technology 4.30 0.107 0.078 0.193 20.119 0.116 20.071 20.008 1.00
change (1.95)
ROI 3.26 0.362a 0.167 0.117 0.240c 0.092 0.014 20.099 0.188 1.00
(1.20)
ap<0.01.
bp<0.05.
cp<0.10, two-tailed tests.
of detecting a significant relationship in a study with low This balanced replication increases our confidence in the existence of a positive relationship between market orientation statistical power. Understanding how entrepreneurial values
influence business effectiveness and the nature of their rela- and business profitability. Using responses from a broad cross section of businesses and using different informants to supply tionship with market orientation (there is a 0.52 correlation
between entrepreneurial orientation and market orientation) information about the independent variables and the depen-dent variable, a result that is very similar to the Narver and is an important area for future research.
Table 2. Regression Coefficients/(Standard Errors)
OLS OLS OLS
Variable Narver and Slater (1990) w/o ENTREP w/o MKTO w/ENTREP & MKTO STEPWISE
Market orientation 0.501b 0.661b na 0.696b 0.737a
(0.223) (0.306) (0.343) (0.238)
Entrepreneurial na na 0.162 20.057
orientation (0.233) (0.250)
Relative size 0.192b 20.002 0.044 0.000
(0.082) (0.095) (0.098) (0.097) Relative cost 20.583a 0.174 0.258 0.177
(0.114) (0.154) (0.157) (0.157)
Competitor 0.030 0.034 0.025 0.034
concentration (0.119) (0.080) (0.083) (0.080) Market growth 20.305a 20.070 20.070 20.060
(0.086) (0.117) (0.131) (0.127) Buyer power 20.104 20.096 20.057 20.094
(0.206) (0.109) (0.113) (0.111) Technology change 20.280b 0.098 0.113 0.100
(0.127) (0.085) (0.089) (0.086)
Adjusted R2 0.410 0.080 0.00 0.061 0.114
F value na 1.65 0.97 1.42 7.68a
DV5Return on investment.
n553.
ap<0.01.
Deshpande, Rohit, and Webster, Frederick E., Jr.: Organizational
Slater (1990) result (magnitude of regression coefficients and
Culture and Marketing: Defining the Research Agenda.Journal of correlations between market orientation and profitability) is
Marketing53 (January 1989): 3–15.
found. Furthermore, market orientation, as a component of
Dess, G. G., and Robinson, R. B.: Measuring Organizational
Perfor-business culture, seems to be more important than an
entre-mance in the Absence of Objective Measures.Strategic Management
preneurial orientation. Journal5 (July–Sept 1984) 265–273.
Dickson, Peter Reid: Toward a General Theory of Competitive Ratio-nality.Journal of Marketing56 (January 1992): 69–83.
Future Research on Market
Hamel, Gary, and Prahalad, C. K.:Competing for the Future,Harvard
Orientation
Business School Press, Boston, MA. 1994.Hayes, R. H., and Wheelwright, S. C.:Restoring Our Competitive Edge: This study provides additional support for the importance of
Competing Through Manufacturing, John Wiley & Sons, New York.
a market orientation. A significant research objective is to 1984. identify the organizational processes that take full advantage
Huber, George, P., and Power, Daniel: Retrospective Reports of
Stra-of a market-oriented culture. For example, Day (1994b, p. 41) tegic-Level Managers: Guidelines for Increasing Their Accuracy. suggests that successfully implementing a market orientation Strategic Management Journal6 (1985): 171–180.
requires developing, “superior market-sensing, customer-link- Jaworski, Bernard, J., and Kohli, Ajay K.: Market Orientation: Ante-ing, and channel-bonding capabilities.” These three areas cedents and Consequences. Marketing Science Institute Working
Paper, Report #92-104. 1992.
alone represent a interesting line for future research. How
Kohli, Ajay K., and Jaworski, Bernard J.: Market Orientation: The
do we measure them? Does a market-sensing capability look
Construct, Research Propositions, and Managerial Implications.
different in a high-tech industrial market than it does in a
Journal of Marketing54 (April 1990): 1–18.
consumer packaged-goods market? Are all of these capabilities
Kotler, Philip:Marketing Management, 9th ed. Prentice Hall,
Engle-required to obtain the maximum benefit from a market
orien-wood Cliffs, NJ. 1996.
tation? Slater and Narver (1995) suggest that market
orienta-Kotler, Philip, and Armstrong, Gary:Principles of Marketing, Prentice
tion is one component in the architecture of a learning
organi-Hall, Englewood Cliffs, NJ. 1994.
zation. Does a market orientation lead to a superior learning
Lumpkin, G. T., and Dess, Gregory: Clarifying the Entrepreneurial
capability? What other organizational capabilities are required Orientation Construct and Linking It to Performance. Academy to optimize organizational learning? These, and many other of Management Review21(1) (1996): 135–172.
issues concerning how businesses operationalize a market- Naman, John L., and Slevin, Dennis P.: Entrepreneurship and the oriented culture remain to be explored. Concept of Fit: A Model and Empirical Tests.Strategic Management
In conclusion, we believe that this replication provides Journal14 (1993): 137–153.
strong support for the existence of a positive relationship Narver, John C., and Slater, Stanley F.: The Effect of a Market Orientation on Business Profitability.Journal of Marketing
(Octo-between market orientation and performance. Future research
ber 1990): 20–35.
should focus on the processes for developing and reinforcing
Neter, John, Wasserman, William, and Kutner, Michael:Applied Lin-a mLin-arket-oriented culture Lin-and for implementing it through
ear Regression Models, R. D. Irwin, Inc., Homewood, IL. 1983.
organizational structure, systems, capabilities, and strategies.
Porter, M. E.: Competitive Strategy, The Free Press, New York, NY. 1980.
The authors gratefully acknowledge the comments of Douglas MacLachlan
Sawyer, Alan, and Ball, Dwayne: Statistical Power and Effect Size in
and Jeffrey Ferguson and the financial support of the Committee for Research
Marketing Research.Journal of Marketing Research(August 1981):
and Creative Works at the University of Colorado—Colorado Springs, where
275–290.
the first author was a faculty member when this research was conducted.
Sawyer, Alan, and Peter, J. Paul: The Significance of Statistical Signifi-cance Tests in Marketing Research.Journal of Marketing Research
References
(May 1983): 122–133.Barabba, Vincent, and Zaltman, Gerald:Hearing the Voice of the Mar- Scherer, F. M.:Industrial Market Structure and Economic Performance,
ket, Harvard Business School Press, Boston, MA. 1991. Rand McNally, Inc., Chicago. 1980.
Boyd, Harper, Walker, Orville, and Larreche, Jean-Claude:Marketing Shapiro, B. P.: What the Hell is Market Oriented?Harvard Business Management: A Global Strategic Approach,R. D. Irwin, Chicago, Review(November–December 1988): 119–125.
IL. 1995. Slater, Stanley: Issues in Conducting Marketing Strategy Research. Brown, John Seely: Research That Reinvents the Corporation.Har- Journal of Strategic Marketing3 (1995): 257–270.
vard Business Review69 (January-February 1991): 102–111. Slater, Stanley, and Narver, John: Market Orientation and the Learn-Day, G. S.:Market-Driven Strategy, Processes for Creating Value, The ing Organization.Journal of Marketing59 (July 1995): 63–74.
Free Press, NY. 1990. Walker, Orville, Boyd, Harper, and Larreche, Jean-Claude:Marketing Day, G. S.: Continuous Learning About Markets.California Manage- Strategy: Planning and Implementation, R. D. Irwin, Chicago, IL.
ment Review(Summer 1994a): 9–31. 1995.
Day, G. S.: The Capabilities of Market-Driven Organizations.Journal Webster, Frederick E., Jr.: Executing the New Marketing Concept.
Marketing Management3(1) (1994): 9–16.