www.elsevier.com / locate / econbase
Productivity convergence in OECD manufacturing industries
a,b ,
*
a,c a,dM.A. Carree
, L. Klomp
, A.R. Thurik
a
Faculty of Economics, Centre for Advanced Small Business Economics, Erasmus University Rotterdam, P.O. Box 1738,
3000 DR Rotterdam, The Netherlands b
Faculty of Economics and Business Administration, Maastricht University, Maastricht, The Netherlands
c
Statistics Netherlands, Voorburg, The Netherlands
d
EIM Small Business Research and Consultancy, Zoetermeer, The Netherlands
Received 8 September 1998; accepted 9 September 1999
Abstract
The extent of b- and s-convergence of average labor productivity across manufacturing industries in 18 OECD countries over the period 1972–1992 shows large inter-industry differences. One reason for these differences is knowledge and capital barriers preventing the occurrence of catch-up. We find the level of average labor productivity, as a proxy for these barriers, is correlated with the extent of convergence. 2000 Elsevier Science S.A. All rights reserved.
Keywords: Convergence; Labor productivity; Manufacturing
JEL classification: J24; L60
1. Introduction
The extent to which economies converge has received abundant attention by economists and politicians. Research has concentrated on the question of convergence of GDP per capita but much less so on the question of convergence of labor productivity at the disaggregated level of industries. The mechanisms behind catch-up and convergence of GDP per capita can never be established unless the developments of its lower level of aggregation equivalent of labor productivity are well understood. The current analysis aims at estimating the extent of convergence in labor productivity at the industry level and relating it to a simple measure of physical capital and knowledge barriers, viz. the average level of labor productivity. Industries with high barriers may also be expected to be industries with relatively low degrees of convergence.
*Corresponding author. Tel.: 131-10-4081398; fax: 131-10-4089172.
E-mail address: [email protected] (M.A. Carree)
Recently, Bernard and Jones have published a series of papers on productivity convergence at the sector level (Bernard and Jones, 1996a–c). They claim thatb-convergence at the macro level of GDP per capita has not been caused by productivity convergence in the manufacturing sector but instead by convergence in the service sector (see also Gouyette and Perelman, 1997). Arguments for catch-up resulting from technology transfer in manufacturing between countries and / or globalization of the manufacturing sector therefore seem not to have empirical support. However, the lack of convergence found within the manufacturing sector does not reveal the spread of the extent of convergence across manufacturing industries. Differences in convergence rates across industries help to understand why productivity gaps between countries exist and (dis)appear. Dollar and Wolff (1993) pay some attention to convergence at the industry level in their Chap. 3. The current paper is a more formal approach to this line of research.
The convergence debate has been increasingly shifting into a debate on econometric techniques with claims that the rates of convergence have been overestimated (Lichtenberg, 1994) or underestimated (Islam, 1995; Lee et al., 1998). A first choice a researcher is confronted with is whether to consider b-convergence or s-convergence. b-convergence implies that less developed countries or industries perform better (catch up) on average when compared to more developed countries or industries. The effect of GDP per capita or productivity in the first period on its relative change in the consecutive period should therefore be negative. The idea behinds-convergence is that the variance of (log) GDP per capita or productivity decreases as production techniques become more similar. It can easily be shown thats-convergence is a sufficient condition forb-convergence, but not the other way around (Lichtenberg, 1994; Quah, 1993). In this paper we consider bothb-convergence
1
and s-convergence and compare the results when either of these two measures is chosen.
The remainder of this paper is organized as follows. In Section 2 we discuss a simple model of endogenous technological progress to explain differences in speed of convergence across industries. In Section 3 the two measures of convergence are introduced. Next, the measurement of average productivity level at the industry level is discussed. In Section 4 the results are presented for the 28 manufacturing industries in the OECD countries. The measures of convergence are compared and related to the initial level of labor productivity. The last section is used for concluding remarks and questions for future research.
2. Convergence of productivity
In this section a model of endogenous technological progress is presented. Technological progress is assumed to be a function of conscious action by agents who may be involved in production work, R&D and learning from other countries’ technological lead.
Assume that Aijt is a measure for (labor) productivity in industry i, country j and time period t. The objective function is a weighted combination of productivity in this period and in the next period. Employees in the industry may be engaged either in producing or in improvement of technology. Technology can be improved by transferring technologies from the country with the technological lead, or by independently undertaking R&D. The extent to which imitation improves technology is
1
max max
assumed proportional to ln(A /Aijt it ) where Ait is the maximum of the productivities across the countries in industry i. The larger the distance to the most productive country the more opportunities to learn in case capital and knowledge barriers are not too high. The extent to which undertaking R&D improves technology is assumed to be proportional to ln(A ). Countries lagging in theirijt technology performance are less likely to produce innovations than highly productive industries using modern technologies. This idea is related to the concept of ‘absorptive capacity’ (Cohen and Levinthal, 1989).
The objective function is equal to:
n 12n
max hA (1ijt 2a)(12b)j Aij,t11 with 0,n,1 (1)
ab
max
subject to Aij,t115A (1ijt 1au1ln(A ))(1ijt 2bu2ln(A /Aijt it )) (2)
where a is the share of time spent on undertaking R&D and b is the share of time (R&D effort excluded) spent on imitation efforts. The growth of labor productivity may be increased by increasing the parametersa and b. However, this goes at the expense of productivity in the current period. The optimal values for these two parameters are:
n n
]]] ]]]]]
a512n2u ln(A ) and b512n1 max (3)
u ln(A /A )
1 ijt 2 ijt it
The optimal growth rate of labor productivity, ln Aij,t112ln A , can be derived from Eq. (2) andijt
max
equals 2 ln(12n)1ln(11u1 ln(A ))ijt 1ln(12u2 ln(A /Aijt it )). Using the fact that ln(11x)¯x
max
when x is close to zero, the optimal growth rate can be approximated by 22n1u2 ln Ait 1(u12
u2) ln A . As in Romer (1990) the optimal growth rate is positively affected by the research successijt coefficient and negatively by the discount rate. The model predicts convergence in case the technology transfer success coefficientu2 is larger than the research success coefficient u1. That is, industries faced with high knowledge barriers and / or with absorptive capacity being an important determinant of successful R&D efforts will tend not to have a high catch-up rate.
The empirical question is whether opportunities for technology diffusion for a specific industry are large enough to have productivities across countries converging over time. An important source of lack of technology diffusion is the prevalence of knowledge barriers, which is related to the complexity of the production technology. High complexity of the technology is bound to lead to high knowledge barriers and to the importance of being able to assimilate and exploit information, i.e. having a high absorptive capacity. Hence, the difference betweenu1 andu2 is a rising function in the complexity of the technology.
3. Testing for convergence at the industry level
There are two main approaches to test for convergence. The first is to measureb-convergence and the second is to measure s-convergence. In this section we discuss these two measures. This is followed by a short discussion of the measurement of productivity levels. We end the section with a brief review of the data set of 28 manufacturing industries.
ˆ
sit the standard deviation of yijt across the countries in year t. The measure ofb-convergence is then derived from the least-squares regression of yijT on a constant and yij 1 where 1 is the first period of investigation and T the last period. For each industry i we have the following regression equation:
yijT5ai1(12bi)yij 11´ij (4)
The estimate of bi indicates the rate of b-convergence, with 0 implying no convergence and 1 implying complete convergence. Whether the rate of convergence is significantly different from zero is derived from the t-value of the estimatedbi. It is clear that in the current study biis equal tou22u1 for industry i. A larger value ofu22u1 corresponds to a less complex production technology and, hence, more possibilities for catch-up.
Some authors have criticized the use of theb-convergence criterion as it may indicate convergence when in fact there is regression to the mean (Friedman, 1992). A solution to this problem is to consider the development of the standard deviation of yijtover time. The rate ofs-convergence can be
ˆ ˆ
measured by the change in the value of the standard deviation from period 1 to period T, i.e.siT2si 1. The extent to which this convergence measure is significantly different from zero is measured by a test statistic recently introduced by Carree and Klomp (1997). Their T -statistic has a standard normal3 distribution under the null hypothesis of no s-convergence and is computed as follows:
2 2
where N is the number of countries.
Our measure for labor productivity is value added per employee. We deflate industry value added by the purchasing power parity (US51) and divide it by the number of employees in the industry. The use of a general price index instead of an industry-specific price index is largely a consequence of lack of price data for value added across the countries in our data set. Additionally, the quality and composition of the industry product package changes quite significantly over a two-decade period,
2
which complicates the use of price data. Our data set is the OECD STAN Database 1970–1995 (OECD, 1997). It provides us with data on 28 manufacturing industries over the 1972–1992 period at the three-digit ISIC level. The countries for which data are available are Australia, Austria, Belgium, Canada, Denmark, Finland, France, (West) Germany, Greece, Italy, Japan, the Netherlands, New Zealand, Norway, Portugal, Sweden, the United Kingdom and the United States. It should be stressed that some of the data points in the OECD STAN Database are estimated by the OECD Secretariat to achieve international comparability at a detailed industry level.
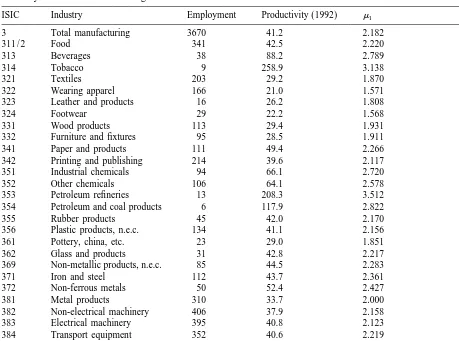
Table 1 shows some key figures on the data set of 28 manufacturing industries retrieved from the OECD STAN Database. Data are available for 18 countries with the exception of ‘petroleum and coal products’ (ISIC 354) for which data are available for 16 countries and ‘other manufacturing’ (ISIC
2
Table 1
a Summary statistics of manufacturing industries
ISIC Industry Employment Productivity (1992) m1
3 Total manufacturing 3670 41.2 2.182
323 Leather and products 16 26.2 1.808
324 Footwear 29 22.2 1.568
331 Wood products 113 29.4 1.931
332 Furniture and fixtures 95 28.5 1.911
341 Paper and products 111 49.4 2.266
342 Printing and publishing 214 39.6 2.117
351 Industrial chemicals 94 66.1 2.720
352 Other chemicals 106 64.1 2.578
353 Petroleum refineries 13 208.3 3.512
354 Petroleum and coal products 6 117.9 2.822
355 Rubber products 45 42.0 2.170
356 Plastic products, n.e.c. 134 41.1 2.156
361 Pottery, china, etc. 23 29.0 1.851
362 Glass and products 31 42.8 2.217
369 Non-metallic products, n.e.c. 85 44.5 2.283
371 Iron and steel 112 43.7 2.361
372 Non-ferrous metals 50 52.4 2.427
‘Employment’ is the average employment (in 1000 number engaged) in the industries across the countries. ‘Productivity (1992)’ is the value added (in $1000) per employee in 1992.m1is the logarithm of the value added (in $1000) per employee in 1972 (Year 1).
39) for which they are available for 17 countries. The first row of the table shows the data for the ‘total manufacturing’ sector. The third column of Table 1 shows the average employment in 1992 (in 1000 persons) per industry across the countries. The average employment in the manufacturing sector per country is about 3.7 million persons. Industries with many employees on average include ‘non-electrical machinery’ (ISIC 382), ‘electrical machinery’ (ISIC 383), ‘transport equipment’ (ISIC 384), ‘food’ (ISIC 311 / 2) and ‘metal products’ (ISIC 381). These five industries provide on average about half of total manufacturing employment. The fourth column shows the average value added per employee (in $1000), i.e. our measure of labor productivity, also in 1992. The last column of Table 1 shows the logarithm of the labor productivity in 1972. This is highly correlated (correlation coefficient of 0.98) with the same variable in 1992.
is far higher than the other industries. These are ‘tobacco’ (ISIC 314) and ‘petroleum refineries’ (ISIC 353). These two industries are capital-intensive and provide only a fraction of total manufacturing employment. The ‘tobacco’ industry is a somewhat special case as it is confronted with relatively high taxes resulting in higher value of sales. The correlations computed in Section 4 are based upon each of the industries in Table 1 with the exception of ‘total manufacturing’ (ISIC 3) and ‘other manufacturing’ (ISIC 39). However, we will also discuss results when leaving out the two industries with the lowest average employment, viz. ‘tobacco’ (ISIC 314) and ‘petroleum and coal products’ (ISIC 354). The first industry is affected by high sales taxes while the second industry is not observed in two of the 18 countries.
4. Results for 28 OECD manufacturing industries
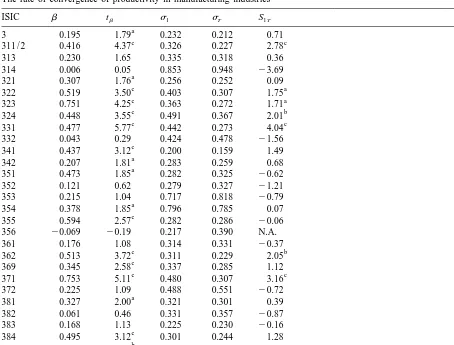
The convergence estimates for labor productivity are presented in Table 2. In the second column of the table the estimate ofbiis presented followed in the third column by the corresponding t-value. For ‘total manufacturing’ (ISIC 3) the estimated rate of b-convergence is about 0.2. It is significantly different from zero (i.e. no convergence) only at the 10% significance level. Ten out of 28 industries have a rate of b-convergence of labor productivity that is significantly in excess of zero at the 1% significance level. This number increases by six when considering a 10% significance level. The fourth and fifth column of Table 2 show the value of the standard deviation of the logarithm of labor productivity in the years 1972 and 1992. A decrease of this value indicates that productivity differences across countries have declined over this 20-year period. In the sixth column the S -statistic, introduced in Eq. (5), is presented. According to this statistic only seven industries show1T a significant F-convergence at the 10% significance level.
The results for labor productivity show that s-convergence is indeed a sufficient but not necessary condition for b-convergence. Each industry showing a significant positive value of the S -statistic1T also has a significant positive value of bi. However, there are also industries [‘industrial chemicals’ (ISIC 351) and ‘rubber products’ (ISIC 355)] which show significant b-convergence but have an
ˆ
increase in the value of sit. This may be interpreted as evidence for regression to the mean. The
ˆ ˆ
correlation between the estimated values ofbi andsiT2si 1 is quite strong: 20.78. When leaving out the ‘tobacco’ (ISIC 314) and ‘petroleum and coal products’ (ISIC 354) industries, this correlation is 20.76.
The results confirm the finding by Bernard and Jones (1996a,b) and Gouyette and Perelman (1997) that labor productivity in the manufacturing sector is only slowly or even not at all converging.
3
However, they also show that the spread of the speed of convergence across industries is large. We
3
The standard likelihood ratio test of the equality of thebi’s across industries has a value of 49.3 (larger than the critical 2
Table 2
a The rate of convergence of productivity in manufacturing industries
ISIC b tb s1 sT S1T
314 0.006 0.05 0.853 0.948 23.69
a
332 0.043 0.29 0.424 0.478 21.56
c
341 0.437 3.12 0.200 0.159 1.49
a
342 0.207 1.81 0.283 0.259 0.68
a
351 0.473 1.85 0.282 0.325 20.62
352 0.121 0.62 0.279 0.327 21.21
353 0.215 1.04 0.717 0.818 20.79
a
354 0.378 1.85 0.796 0.785 0.07
c
355 0.594 2.57 0.282 0.286 20.06
356 20.069 20.19 0.217 0.390 N.A.
361 0.176 1.08 0.314 0.331 20.37
c b
372 0.225 1.09 0.488 0.551 20.72
a
381 0.327 2.00 0.321 0.301 0.39
382 0.061 0.46 0.331 0.357 20.87
383 0.168 1.13 0.225 0.230 20.16
c
384 0.495 3.12 0.301 0.244 1.28
b
385 0.396 2.18 0.307 0.290 0.32
39 0.106 0.63 0.582 0.642 20.82
a
For the industries corresponding to the ISIC codes, see Table 1. The superscripts a, b and c mean significant convergence at the 10%, 5% and 1% significance levels. N.A. means ‘not available’.
claim that one of the reasons for this spread is the variety in the complexity of production technologies, or the existence of knowledge and capital barriers. A possible proxy for the complexity of production technologies is the level of labor productivity. Industries with high levels of labor productivity use, on average, technologies of a higher complexity and capital intensity than industries with a low level of labor productivity.
The relationship between the rates of b-convergence and s-convergence on the one side and the logarithm of labor productivity in 1972, m1i, on the other side is computed by the correlation
ˆ ˆ ˆ ˆ
coefficients of bi with m1i and of siT2si 1 with m1i. We also employbi weighted with the reciprocal of its standard error, i.e. the t-value t . The correlation between the estimated values ofbi bi for the 27 industries and their m1i is –0.27. The correlation between the t-values of bi and m1i is somewhat
ˆ ˆ
4
‘tobacco’ (ISIC 314) and ‘petroleum and coal products’ (ISIC 354) industries are excluded. That is, we find evidence for industries with a relatively high labor productivity having a low rate of
5
(especially s-)convergence of productivity. This is in line with high knowledge or capital barriers preventing quick catch-up.
5. Conclusion
We investigate convergence of average labor productivity across manufacturing industries in 18 OECD-countries over the period 1972–1992. For each industry we determine the extent of b -convergence ands-convergence and their statistical significance. The results show large inter-industry differences in the extent of convergence, part of which can be explained from differences in the level of average labor productivity. This level may function as a proxy for knowledge or capital barriers preventing catch-up occurring.
Low knowledge barriers which allow for imitation of new technologies and which limit the degree of absorptive capacity necessary for technological progress may facilitate convergence. High knowledge barriers which make imitation difficult and which can generate technological gaps into lasting ones may hamper convergence. This may be a reason for the lack of convergence of GDP per capita found in many large data sets including developing countries while there is ample evidence of convergence having taken place for developed countries (Carree and Klomp, 1997).
The current analysis leaves some questions unresolved. First, the use of the level of labor productivity as a measure for capital and knowledge barriers is an indirect approach. Do more direct measures give the same conclusion as our indirect measure? Second, what is the effect of industries being more or less internationally oriented? Gersbach and Baily (1996), for example, claim that an industry in which there is only local competition (such as the Japanese food industry) rank quite low on the productivity scale. Resolving these and other questions will allow us to better understand when convergence takes place and when it does not.
4
We tested whether these correlation coefficients are sensitive to outliers. For the sample of 25 industries (‘tobacco’ and ‘petroleum and coal products’ industries excluded) we find two outliers. Both are capital-intensive industries in Belgium that have increases of labor productivity which are much larger than for any other observation. These two industries are the ‘petroleum refineries’ (ISIC 353) and the ‘iron and steel’ (ISIC 371) industries. The rate of convergence for those two industries decreases substantially when Belgium is excluded from the sample. The estimates of b, t ,b s1 and sT for the ‘petroleum refineries’ (ISIC 353) industry change to –0.079, 0.38, 0.628 and 0.843, respectively, when excluding the Belgian refineries from the sample. Similarly, the estimates ofb, t ,b s1andsT for the ‘iron and steel’ (ISIC 371) industry change to 0.392, 2.14, 0.337 and 0.315, respectively. The correlation between convergence and productivity becomes stronger as a result of excluding the two Belgian industries. The correlation coefficients between the estimates ofb, t andb
Ds and the logarithm of labor productivity in 1972 change to –0.40, –0.39 and10.62, respectively. That is, the correlation coefficients are somewhat sensitive to outliers but when removing these outliers the results are reinforced.
5
Acknowledgements
This study benefited from a grant by the Ministry of Economic Affairs, Directorate of General Economic Policy, The Hague.
References
Baumol, W.J., Blackman, S.A.B., Wolff, E.N., 1989. Productivity and American Leadership: The Long View, MIT Press, Cambridge, MA.
Baumol, W.J., Nelson, R.R., Wolff, E.N., 1994. Convergence and Productivity: Cross-National Studies and Historical Evidence, Oxford University Press, Oxford.
Bernard, A.B., Jones, C.I., 1996a. Comparing apples to oranges: Productivity convergence and measurement across industries and countries. American Economic Review 86, 1216–1238.
Bernard, A.B., Jones, C.I., 1996b. Productivity across industries and countries: Time series theory and evidence. Review of Economics and Statistics 78, 135–146.
Bernard, A.B., Jones, C.I., 1996c. Productivity and convergence across US states and industries. Empirical Economics 21, 113–135.
Carree, M.A., Klomp, L., 1997. Testing the convergence hypothesis: A comment. Review of Economics and Statistics 79, 683–686.
Cohen, W.M., Levinthal, D.A., 1989. Innovation and learning: the two faces of R&D. Economic Journal 99, 569–596. Dollar, D., Wolff, E.N., 1993. Competitiveness, Convergence, and International Specialization, MIT Press, Cambridge, MA. Friedman, M., 1992. Do old fallacies ever die? Journal of Economic Literature 30, 2129–2132.
Gersbach, H., Baily, M.N., 1996. Explanations of international productivity differences: Lessons from manufacturing. In: Wagner, K., van Ark, B. (Eds.), International Productivity Differences: Measurement and Explanations, Contributions to Economic Analysis, Vol. 233, Elsevier, Amsterdam.
Gouyette, C., Perelman, S., 1997. Productivity convergence in OECD service industries. Structural Change and Economic Dynamics 8, 279–295.
Hooper, 1996. Comparing manufacturing output levels among the major industrial countries. In: OECD, Paris. Islam, N., 1995. Growth empirics: A panel data approach. Quarterly Journal of Economics 110, 1127–1170.
´ ˆ
Le Pen, Y., 1997. Convergence internationale des revenus par tete: Un tour d’horizon. Revue d’Economie Politique 107, 715–756.
Lee, K., Pesaran, M.H., Smith, R., 1998. Growth empirics: A panel data approach — A comment. Quarterly Journal of Economics 113, 319–323.
Lichtenberg, F.R., 1994. Testing the convergence hypothesis. Review of Economics and Statistics 76, 576–579.
OECD, 1996. Industry productivity: International comparison and measurement issues. OECD Proceedings, OECD, Paris. OECD Economic Analysis and Statistics Division, 1997. OECD STAN Database 1970–1995, OECD, Paris.
Quah, D., 1993. Galton’s Fallacy and tests of the Convergence Hypothesis. Scandinavian Journal of Economics 95, 427–443. Romer, P.M., 1990. Endogenous technical change. Journal of Political Economy 98, S71–S102.