Contents lists available atScienceDirect
Journal of Air Transport Management
journal homepage:www.elsevier.com/locate/jairtraman
The impact of air transportation, railways transportation, and port container
tra
ffi
c on energy demand, customs duty, and economic growth: Evidence
from a panel of low-, middle-, and high -income countries
Haroon Ur Rashid Khan
a,b, Muhammad Siddique
c, Khalid Zaman
d,∗, Sheikh Usman Yousaf
e,
Alaa Mohamd Shoukry
f,g, Showkat Gani
h, Sasmoko
i, Aqeel Khan
j, Sanil S. Hishan
k,
Hummera Saleem
laSchool of Finance, College of Business and Public Management, Kean University, NJ, USA bWenzhou-Kean University Campus, Wenzhou, PR China
cDepartment of Business Administration, University of the Punjab, Gujranwala Campus, Pakistan dDepartment of Economics, University of Wah, Quaid Avenue, Wah Cantt, Pakistan
eHailey College of Banking and Finance, University of the Punjab, Lahore, Pakistan fArriyadh Community College, King Saud University, Riyadh, Saudi Arabia gKSA Workers University, Cairo, Egypt
hCollege of Business Administration, King Saud University, Muzahimiyah, Saudi Arabia iBina Nusantara University, Faculty of Humanities, Jakarta, Indonesia
jFaculty of Education, Universiti Teknologi Malaysia, 81310 Skudai, Johor, Malaysia kFaculty of Management, Universiti Teknologi Malaysia, 81310 Skudai, Johor, Malaysia lDepartment of Economics, Wuhan University, Wuhan, China
A R T I C L E I N F O
Keywords:
Air transportation Railways transportation Container port traffic Energy demand Customs duty Per capita income
Panel cointegration techniques
A B S T R A C T
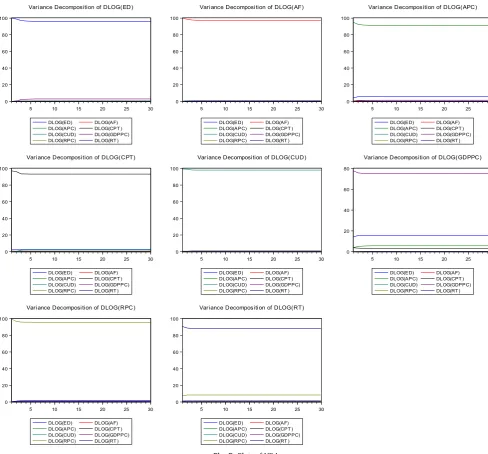
The transportation sector is highly sensitive due to the excessive use of energy, which though generates sufficient amount of income in terms of customs duty that supports country's per capita income; however, its effect largely the energy security issues across the globe. This study examines the impact of air transportation, railways transportation, and container port traffic on energy demand, customs duty, and economic growth in a panel of 40 heterogeneous countries, which comprises 16 low income & lower middle income (LI&LMI) countries and 24 upper middle & high income (UM&HI) countries for the period of 1990–2015. The study employed panel econometric techniques which account for cross-sectional dependence and heterogeneity. The results show that air-railways transportation has a positive and significant relationship with the energy demand (ED) in ag-gregated panel, whereas air-railways passengers carried positively influenced ED in LI&LMI countries, and railways transported goods (RT) significantly increases ED in UM&HI countries. Air freight (AF) and railways passengers carried (RPC) escalate customs duty (CUD) in aggregated panel, while RPC positively influences CUD in LI&LMI countries, and AF significantly increases CUD in UM&HI countries. Container port traffic (CPT) po-sitively influenced per capita income (GDPPC) across countries. The causality estimates confirmed the bidir-ectional relationship, unidirbidir-ectional, reverse causality, and no causal relationships between the studied variables with different transportation modes. The estimates of impulse response function (IRF) suggest that transporta-tion (except RPC) and growth factors will positively influence ED in aggregated panel while differential impacts of transportation and growth factors will affect CUD over a next 30 years time period. The variance decom-position analysis (VDA) shows that GDPPC will largely influence by ED and least influenced by CUD, while CPT will greatly affect by CUD and least influenced by AF, over a next 30 years period. The overall results provoked the need of transportation energy infrastructure that desirable for long-term sustainable growth across countries.
1. Introduction
The relationship between transportation sector and energy demand
is a paramount concern of the global world related to the energy effi -ciency and regulations that strive hard to maintain the energyflows for sustainable development. The air transportation, road/railways
https://doi.org/10.1016/j.jairtraman.2018.04.013
Received 19 February 2017; Received in revised form 12 April 2018; Accepted 13 April 2018
∗Corresponding author.
E-mail addresses:[email protected],[email protected](K. Zaman).
Journal of Air Transport Management 70 (2018) 18–35
transportation, and port transportation are the diverse modes of transportation that required different energy levels to support its op-erations. It is evident that massive gain in urbanization leads to an increase in the global expansion of transport mobility, which is account for 28% energy demand. Out of which, 70% energy demand is attrib-uted by goods transported and passengers carried across regions. The transport sector is highly sensitive to the environment, as nearly around 95% energy comes from oil–based fuels that threaten the global en-vironment (IIASA, 2014). The latest report of International Energy Outlook (IEO, 2016a) presented the crucial facts of world energy de-mand, which simulated that global energy demand is expanded by 549 quadrillion British thermal units (Btu) in 2012 to 629 and 815 quad-rillion Btu in 2020 and 2040 respectively, which will be an increase of about 48% during 2012–2040. The building sector, industrial sector, and transportation sector marginally added energy demand is about 1.5%, 1.2%, and 1.4% per annum respectively, which will an increase energy demand around 42%, 33.6%, and 39.2% respectively, during the next 28 years i.e., from 2012 to 2040. The Air Transport Action Group (ATAG, 2016) presented the facts that airflight globally pro-duced 781 million tonnes of carbon emissions in the year 2015 while human-induced carbon emissions are about over 36 billion tonnes of carbon emissions. In the same year, around 3.57 billion passengers worldwide carried by the airlines. The aviation industry is responsible for 12% carbon emissions compared to the road transportation that is accounted for around 74%. The global aviation industry supported about 62.7 million jobs directly and indirectly with the tourism based activities, while it generates about $664 billion of GDP per year, which is expected to exceed the threshold of $1 trillion to world GDP by 2026. These facts provide good insights to understand the transportation in-tensive energy profile, which further required strong policy framework to optimize our energy sources by specific government actions and plans to balance the need of energy demand worldwide.
The emissions due to road/railways transportation, although con-sider the global concern of GHG emissions and carbon dioxide emis-sions, however, due to electrified trains & cars and improved vehicle efficient technologies, this sector substantially reduces the global en-vironmental concerns (Saleem et al., 2018). Despite the major sus-tainability reforms in this sector, around 1/5th of the European GHG emissions are accountable for the road emissions, which further dete-riorate in many European cities, as it is above the European designated threshold level of mitigating carbon emissions (EEA, 2016). About 15% of the carbon emissions in EU countries are accountable for local cars, vans, and light-duty vehicles, while 6% carbon emissions are due to heavy-duty vehicles that may restricted by new light and heavy-duty vehicle legislations to set binding emissions target (EU, 2017). The rail contributes less than 1.5% in European transport emissions, which will further reduces carbon emissions till 2020 by 40% and 50% by 2030 that shows significant carbon reduction policies for sustainable devel-opment in this region (CER, 2015). The other source of emission is port emissions, which is contributed about 10% of the global pollutants, mainly responsible is the ship-based activities, including 6% is the ocean-going vessels, 0.8% is due to harbor craft, 1.64% due to cargo shipments, 0.9% is the trucks in ports, and 0.6% is due to locomotives (POLB, 2016). The port emissions largely received attention in sus-tainable policy agenda due to high mass GHG emissions, which re-quired substantial policies and programs to introduce sustainable port based activities to reduce air pollutants (Winnes et al., 2015).
The motivation of the study is to developed an integrated econo-metric framework where energy demand, customs duty, and economic growth is subject to the change by different transportation modes, in-cluding air transportation, railways transportation, and port transpor-tation, which provide strong policy actions to re-consider the economic decisions by healthy and wealthy transportation. This motivation fur-ther initiated to study this topic in a broader way to generalize the findings in a global perspective. The present study examined the impact of air transportation, railways transportation, and port traffic container
on energy demand, customs duty and economic growth in a panel of 40 diversified countries.
The study used heterogeneous panel cointegration technique to achieve the desired study objectives, i.e., panel cross-sectional depen-dence tests, second generation panel unit root test, Johansen Fisher panel cointegration test, heterogeneous panel causality test, impulse response function, and variance decomposition analysis, for robust in-ferences. These tests confirmed the cross-sectional correlation, sta-tionary properties of the selected variables in terms of its order of in-tegration, cointegration relationships between the candidate variables, causal relationships between transportation and growth factors, fore-casting impulse response shocks for examining the positive and/or negative error shocks over subsequent points of interval, and forecast variance error shocks that is used tofind the relative importance of variable shocks in the models, for the next 30 years time period. These tests are prerequisites to perform panel cointegration to handle the cross-sectional dependence among the panel countries and serial cor-relation problem from the given model, thus its gives robust parameter inferences for sound policy conclusions.
2. Literature review
Transportation is an important factor for international tourism to reach the specific tourist destinations, as perBecken (2002)estimates for tourists' arrival data in New Zealand with respect to energy demand, presented the fact that air transportation consumed 27.8 PJ energy while its resulting impact on carbon emissions about 1.9 million tonnes. These estimates emphasized the need for sustainable tourism and transportation instruments by adding renewable energy sources in country's energy profile that would helpful to reduce the risk of climate change and air pollution worldwide.Becken et al. (2003)further pro-voked the need of‘energy bills’that add up into the international and domestic tourists of New Zealand by using energy demand with dif-ferent travel choices. Although the energy demand of international tourist is almost four times higher than the domestic tourists in a country, however, the transportation bill is largely contributed by do-mestic tourist i.e., about 73% compared to the international tourists i.e., about 65%. The study concluded that energy bill is the best saving energy technique that may affect the tourist travel choices to alter their travel styles for saving energy. Berndt and Botero (1985) identified different modes of transportation and their level of energy demand in the Mexican transport sector and confirmed that country's income played a dominating role to affect air-railway's energy consumption compared to the energy prices, while gasoline and diesel fuel demand for the motor vehicles mode is influenced by energy prices. The policies to balance energy prices and sustainable economic growth would helpful to reduce energy demand at countrywide. Lu et al. (2009) forecasted the trend analysis of vehiclefleet associated with the energy consumption and its resulting output in a form of carbon emissions, by using Grey forecasting model in the context of Taiwan and found that for the next 19 years period, road transportation considerably increases vehiclefleet by 3.64%, energy demand by 3.25% and carbon emissions by 3.23%, which is associated with lower and upper bound values. For the year 2025, the vehiclefleet will be 30.2 million and 36.3 million vehicles, followed by energy demand will fall in between the range of 25.8 and 31.0 million kiloliters, and carbon emissions estimate about 61.1 million metric tonnes and 73.4 million metric tonnes in low to high bound values. This forecasted trend exhibits the need of long-term policy plans to reduce carbon emissions that are intensified by trans-portation energy demand, and it should be associated with green transportation instruments for broad-based growth.Yan and Crookes (2010)assessed the trend analysis of road transportation's energy de-mand and its associated carbon emissions, and indicated the serious problems of energy security, urban pollution and risk of climate change. The study concluded in favor of carbon mitigation polices to reduce energy demand and promote the zero carbon policy for China
H.U. Rashid Khan et al. Journal of Air Transport Management 70 (2018) 18–35
transportation sector.Anable et al. (2012)concluded that although the usage of final energy demand in a form of electricity and vehicles' electrification system partially helpful to reduce carbon emissions in the U.K economy, however, the impact of electricity decarburization future is yet to be delayed till further renewable energy-transportation reforms not been implemented in this sector.Ong et al. (2012)concluded that road transportation is widely recognized for high-level fuel consump-tion that leads to increasing the risk of climate change; while it appears that the trend of gasoline fuel consumption and diesel consumption in future is attached with environmental issues that require sound policy implication for sustainability in transportation energy.Hu et al. (2010) discussed the different energy sources with implications of sustainable development in China and concluded with the simulated facts that vehicle population and fuel demand will be projected to increase about 400 million and 350 million tonnes respectively, at the end of 2030. The country is technically equipped with renewable energy sources and the development of public transport with alternative fuels supply, however, trade inefficiency, government's possible intervention in transport energy market for sustainable reforms and customer's un-wanted desire may attach with technical inefficiency in a country that need urgent attention to improve road transportation efficiency for sound growth.
Kim and Moon (2008)introduced hydrogen energy as a transpor-tation fuel to reduce the dependency of conventional petroleum tech-nologies that linked with the severe environmental constraints, while the energy projection till 2040 is evaluated in the context of Korea for analyzing the role of hydrogen energy in road transportation sector and found a sustainable solution to mitigating carbon emissions by im-proving road transportation energy and energy security in a country. Saidur et al. (2007) found that road transportation is efficient sub-sector as compared to the marine and air transportation in Malaysia, while energy efficiencies and exergy efficiency of Malaysian transpor-tation sector is higher than to Norway but lower than from Turkey. The results emphasized the need to identify the potential losses of exergy and energyflows in their country profile.Liao et al. (2009)suggested the carbon reduction strategy by replacing the long-haul truck with the intermodal coastal shipping and truck movements significantly depress the carbon emissions due to the efficient usage of maritime fuel in Taiwan. Liao et al. (2010)further examined the impact of port con-tainer traffic and carbon emissions in Northern Taiwan and found the significant carbon reductions due to changes in the transshipments routes from the ports of Keelung, Kaohsiung, and Taichung to the Taipei port. The study emphasized the need for port container traffic routes that would helpful to reduce carbon emissions and improve transship-ments activity to country's income.Charles et al. (2007)considered that air transportation has an amplified future with respect to passengers carried and transport goods; therefore, it is considered to be the most potential regional driver of economic growth. Shabbir and Ahmad (2010)analyzed the data trend of urban transportation, energy demand and different air pollutants in two twin cities of Pakistan, namely Is-lamabad and Rawalpindi, and developed a LEAP model to forecast the variable's relationship and trends till 2030. The results provoked the need for optimum transportation policy to delimit the projected growth of fuel consumption to reduce air pollution.He and Chen (2013) dis-cussed the potential of electrified road vehicles, including light & heavy trucks, motorcycle, and other hybrid vehicles, which reduces the con-sumption of energy that helpful to reduce anthropogenic pollutants activities from China's road transportation. The study concluded with some policy implications in favor of transport sustainability with elec-tric and hybrid vehicles that consummately save energy and reduce carbon emissions.Chen and He (2014)proposed an integrated trans-portation vehicle framework, which helpful to reduce different notor-ious air pollutants in China, including PM2.5, PM10-2.5, and O3. The results show that PM2.5pollution is more threaten to the human health, economic wealth, and residential welfare as compared to the other pollutants, which required deeper investigation to device strong
environmental policy for transportation, including ‘plug-in hybrid electric vehicles’that gives greater benefit to balancing the country's air quality and improve health indicators. The country's welfare is subject to the alternative and sustainable transport policy for sustainable de-velopment. Yang and He (2016) investigated the gasoline & diesel transport fuel system in the provincial data set of China and estimated the fuel-emissions elasticity to check its impact on resident's health losses. The study concludes that country's rapid economic growth and transportation development seriously affected the socio-economic status, which is resulted in the resident's poor health. The policies to manage the fluctuations of international oil prices helpful to reduce fewer emissions that reduce health concerns at countrywide.
He and Qiu (2016)proposed an integrated framework to estimate different travel demands, including land, water, and air transportation and projected the‘business-as-usual scenario’for 2050. The results re-veal that environmental and health both influenced by changes in dif-ferent travel demand in China, while it is suggested that co-benefits of resident's health and wealth are attributed by alternative transport fuel policies for long-term sustainable development.He et al. (2017) ex-amined the impact of oil pricefluctuations and transportation fuel de-mand on Chinese residents' health by using the data set of 306 cities during the period of 2002–2012. The results conclude that rise of fuel prices up to 30% substantially reduces the air pollution by 1,147,270 tonnes, premature deaths by 16,149 cases (and 15,534 cases in non-linear health model) and economic health by 13,817.953 (and 13,291.4 in non-linear health model)) million RMB Yuan. The study concludes that there is a dire need of significant strategy to balance the oil price uncertainty and transportation fuel demand that may helpful to reduce the health damages of the country's residents. Qiu and He (2017a) discussed the opportunities of green transport policies in China and proposed a new concept of‘pollution rebound effect (PRE)’for ana-lyzing the effectiveness of green transportation policies and found the negative values of PRE both in the short- and the long-run. The result implies that the negative value tend to shows that green transportation policies largely supported the country's sustainable environmental agenda that is less polluted by road transportation.Qiu and He (2017b) further analyzed the green traffic policies to analyze different air pol-lutants concentrations in pilot cities of China and found that sulfur dioxide concentrations (10.71%), nitrogen dioxide concentrations (11.26%) and PM10concentrations (9.85%) largely decreases by im-plementation of green traffic policies in Chinese pilot cities, which is considered one of the favorable policy instrument for sustainable de-velopment in a country.Cansino and Román (2017)collected the data of Spanish air traffic for the period of 2010–2014 and projected the results for 2020 with concretefindings that revolved around structural adjustments programs of aircraft design, which helpful to reduces GHG emissions by improving energy efficiency. The projected results are substantially in favor of‘Winglet’project that reduces carbon emission by 66.29 Gg-59.56 Gg for the period of 2015–2020.Tomita et al. (2017) proposed an efficient railways transportation system, which is based upon‘superconducting materials’that is less sensitive to carbon emis-sions up to 3.6 × 10⁵ ton-CO2 per year globally. This material may further helpful to increase the regenerating efficiency of power trans-mission, reduced power loss, balancing the power load in different substations, and less voltage drop. The study concludes that the su-perconducting feeder may be the promising solution to reduce the global energy issues.Table 1presented the recent literature on trans-portation and energy demand across the globe.
The above cited studies confirmed the strong relationship between transportation and energy demand across the globe. The green aviation fleet management (see, Lee et al., 2017), hybrid-electric and uni-versally-electric aircraft (see,Schmidt et al., 2016), sustainable jet fuel market (see,Smith et al., 2017), jet fuel tax (see,González and Hosoda, 2016), and green airline marketing strategies (see,Niu et al., 2016), all strategies would helpful to reduce global air emissions and climatic variations. The current study learned from the cited literature on
Table 1
Current literature on the relationship between transportation and energy demand.
Authors Time Period Country Results Comparison with the current study
Achour and Belloumi (2016a)
1971–2012 Tunisia Causality relationships running between:
TVAD→RIFS RTEC→RIFS TCO2→RIFS GCF→RIFS
The cited studies used different transportation framework in relation with carbon emissions, investment, energy, and economic growth, while this study used all three transportation, i.e., air-railways-port transportation with macroeconomic indicators, including energy demand, custom duty, and economic growth in dynamic panel modeling for robust policy inferences. Achour and Belloumi
(2016b)
1985–2014 Tunisia The impact of EG, TRINT, POP, and TRSTR on EC is positive, while the effect
of EINT on EC is negative. Taylan and Demirbas
(2016)
Next 10 years forecast data
Saudi Arabia Country's growth is highly dependent on energy demand and transportation
sector.
The custom duty, energy demand, and economic growth is dependent upon the air-railways-port transportation.
Zhang and Gao (2016) 1995–2011 Regional panel data of China Tourism sector largely affected environment in Eastern China, while TLG hypothesis is verified in Eastern, Western, and Central China.
The current study not directly linked with the carbon emissions and tourism development, while it's analyzed the transportation sector to influence economic growth, energy demand, and custom duty in heterogeneous panel of countries.
Paramati et al. (2017) 1991–2013 28 EU countries The causality relationships running between: i) TOUR→CO2 (in Eastern EU countries) ii) EG→TOUR
CO2→TOUR (in Western EU countries) Ling-Yun and Lu-Yi
(2016)
Forecast till 2050 China Travel and transport sector is associated with increase air pollution that
consequently affect on resident's health in a country. Zaman et al. (2017) 1995–2013 Panel of 11 selected
Transition economies.
Travel items expenditures and tourism receipts increases carbon emissions and income. The causality running between:
EC→CO2 FDI→O2 EG→CO2 TOUR→FDI TOUR→EG
Transportation expenditures will influence CO2 emissions and EG in next decade.
Higham et al. (2016) 68 in-depth interviews
Australia, Germany, Norway, and the United Kingdom.
Norwegians are less likely to be in favor of government intervention in the form of imposing taxes for air travel transportation, whereas the rest of the three countries participants are in favor of transportationflexible strategies to adjust travelers with reasonable charges.
The current study is macro-oriented formulation of panel of countries that analyzed the performance of transportation sector in economic development.
Chai et al. (2016) 1971–2011 China RTED significantly increases by 0.33% and 1.26% for every 1% increase in
country's economic growth and urbanization respectively.
The current study confirmed the importance of air-railways-port transportation to increase country's economic growth. Hakim and Merkert
(2016)
1973–2014 Panel of South Asian
countries
The causality relationships running between: EG→APT
EG→AFV
Khan et al. (2017) 1990–2014 19 countries panel data Air-railways transportation increases inbound tourism. The causality relationships running between:
INBTOUR→RLGT
AFV→TOP TRVLS→AFV
Khan et al. (2016) 2007–2015 15 countries panel data Logistics indicators promote sectoral contribution to GDP and countries' growth.
The study not analyzed the different logistics activities; however, transportation is one of the logistics components that are used in this study to find its role in economic development.
(continued on next page)
H.U.
Rashid
Khan
et
al.
Jo
urn
al
o
f A
ir Tran
spo
rt M
an
age
m
en
t 7
0 (2
01
8) 1
8–3
5
different dimensions, i.e., i) how different transportation modes in-creases air pollutants, ii) does transportation may affect energy de-mand? iii) By which channel transportation influenced the economic activities, iv) to what extent transportation sector contributes to gen-erating sufficient tourism income for the countries, etc. The study presented the comparison with the previous literature for common understanding to the real phenomenon.
The current study is different from the cited studies in different perspectives, i.e., i) it examines the dynamic relationships between different transportation systems and growth-specific factors in hetero-geneous panel of countries, ii) it does not account for transport asso-ciated carbon emissions, while its include energy demand, custom duty, and economic growth in air-railways-port transportation mechanism, iii) it describes the channel through which energy and customs duty influenced by different transportation modes, and iv) it describes the causal and forecasting relationships between transportation and growth factors. The real contribution of the study is to add the number of promising factors of transportation including air transport passenger carried, air freight charges, railways passengers carried, railways goods transported, and port container traffic, which covered three modes of transportation i.e., aviation transportation, railways transportation, and port transportation for robust inferences. The customs duty included in the transportation sector tofind the total receipts of transportation, which further support to increase country's economic growth. Finally, energy factor is used to assess the sustainability agenda which com-promised by high –fuel transportation energy for utilizing its opera-tions. The contribution in terms of utilizing the dynamic modeling technique is further taking the edge from the previous studies, which suffered from cross-sectional dependency and its appropriate econo-metric testing procedures. The study estimated long-run parameter es-timates, causality relationships, and innovation accounting matrix in panel cointegration framework that handled the possibility of serial correlation and cross-sectional dependency among the panel countries. 3. Data source and methodology
The following variables are used to examine the impact of air-rail-ways transportation, port container traffic, and customs duty on energy demand in a panel of low income-lower middle-income countries and upper middle-high income countries, i.e., energy demand in kg of oil equivalent per capita (denoted by ED), air transport freight in million ton-km (denoted by AF), air transport passengers carried (denoted by APC), railways goods transported in million ton-km (denoted by RT), railways passengers carried in million passenger-km (denoted by RPC), container port traffic in TEU: 20 foot equivalent units (denoted by CPT), customs and other import duties as % of tax revenue (denoted by CUD), and GDP per capita in constant 2010 US$ (denoted by GDPPC). The missing data isfilled by the preceding and/or successive values of the respective variable's values to prevent it from loss of a degree of freedom. The time series data is selected for the period of 1990–2015 while the selected countries being made in three set of panel groups i.e., an aggregate panel of 40 countries, low income-lower middle-income countries (total = 16), and upper middle-high income countries (total = 24). The data is taken fromWorld Bank (2015a). The list of the countries being used as a sample for this study is shown inTable Ain appendix.
These countries are selected because of the following reasons i.e., i) Progressive reforms to build an air-railways infrastructure in their
country profile.
ii) Handling port container traffic as a medium of transportation. iii) Revenue generation from customs and other import duties to
sup-port country's economic growth, and
iv) Dependence on energy usage to regulate air-railways transportation and port container traffic for making a healthy profit to support economic development.
It is imperative that the sound transportation systems helpful to offer greater benefits to the economy by reducing significant poverty alleviation and boosts economic development through fiscal manage-ment policies, however, it requires sound and effective government regulatory mechanisms to sustained transportation by supporting public-private partnerships and some other viable commercial ap-proaches (World Bank, 2015c). The energy intensification in transpor-tation mainly comprises petroleum products, biofuels, natural gas, and electricity, however, the share of petroleum product is comparatively higher than the other sources of energy transportation. There are dif-ferent modes of energy transportation is available across countries in-cluding gasoline energy used on road vehicles, aviation, and boats; diesel fuel mostly used in heavy vehicles and ships; kerosene used in jet airplanes and helicopters; compressed and liquefied natural gases use in private and government vehicle fleets; and electricity is plug with government mass transit system (EIA, 2016). The share of petroleum and other liquid fuels used in transportation at worldwide reaching the maximum share of 96% in 2012 and it will drop to 88% till 2040. The natural gas share will increase from 3% to 11% during the period from 2012 to 2040, while the electricity share will be very less augmented in the transportation sector to growth i.e., 1% till 2040 (IEO, 2016b). The importance of energy consumption in transportation sector emphasized the need of strong policy vista for long-term economic development across countries.
The study used the following regression equations in order to ex-amine the impact of air-railways transportation on energy demand, customs duty, and economic growth in a panel of low income-lower middle income countries and upper middle-high income countries, i.e.,
= + + +
Where, ED, AF, APC, RPC, RT, CPT, CUD, and GDPPC represent for energy demand, air freight, air transportation passengers carried, rail-ways passengers carried, railrail-ways transported goods, container port traffic, custom duty, and GDP per capita. The variables are in natural logarithmic form to show elasticity estimates. The subscripts i.e., ‘i' denotes for sample countries (total = 40) and‘t’denotes for time period (from 1990 to 2015).
Equation(1)shows the impact of air-railways transportation, port container traffic, and customs duty on energy demand in a panel of countries. The impact of transportation is expected to have a positive impact on energy demand, as transportation sector requires more en-ergy to smoothly functioning the air-railways and port mechanisms. The customs duty and economic growth both used as macroeconomic determinants of country's developmental action plans which expected to increase along with an increase energy demand across nations.
Equation(2)shows the impact of air-railways transportation, port container traffic, and energy demand on customs & other imports duty in a panel of countries. The expected relationship between transporta-tion sector and customs duty is positive, as higher transportatransporta-tion freight charges, goods transportation, and passengers carried considerably in-crease the customs and other excise duties for the countries. The impact of energy demand and economic growth further expected to escalates customs and other excise duty across countries.
Finally, equation (3) shows the impact of transportation sector,
energy demand, and customs duty on per capita income in a panel of countries. The impact of transportation is expected to have a positive relationship with the countries’economic growth, which mediated by energy demand and customs duty. The energy demand and customs duty served as developmental instruments to promote economic growth in a panel of countries.
The study used the following sequential econometric techniques to obtain the robust statistical inferences, i.e.,
Step-I.Cross-Sectional Dependence Tests
Firstly, the CD (cross-sectional dependence) tests are employed to identify the dynamic properties of cross-sections in a longitudinal study to analyze whether the cross-sections in a panel unit process are mu-tually dependent or vice versa. Pesaran (2004), Breusch and Pagan (1980), andBaltagi et al. (2012) proposed the Pesaran CD test (and Pesaran scaled LM test), Breusch-Pagan LM test, and bias-corrected scaled LM test respectively. These tests helpful to recognize whether the given series are cross-sectional dependence or independence, failure to do so may lead to serious biased results in a form of unaccounted re-sidual dependence, loss of estimator efficiency, and invalid t-statistics. The significant CD tests rejected the null hypothesis of no cross-sections correlation and accepted the alternative hypothesis of cross-sections dependence in a panel unit system.
Step-II.Second Generation Panel Unit Root Test
After identifying the cross-section dependence in the given series, the study may not proceed for conventional panel unit root tests due to lower power, while it's required the second generation panel unit root tests that assume sectional dependence. The study used cross-sectional augmented (CIPS) panel unit root test as proposed byPesaran (2007)to analyze the order of integration for the candidate variables. The significant CIPS panel unit root statistics at level confirmed that the given variable is level stationary, while the reverse is hold for diff er-enced stationary series when the variable is not significant at level and significant atfirst difference. The panel unit root test is the requirement for qualifying long-term and cointegration relationships between the variables, therefore, after identifying the order of integration of the variables' series, the study proceed to estimate panel cointegration tests. Step-III.Panel Cointegration Test
The study may not proceed for Westerlund (2007) panel coin-tegration test due to more than six covariates in each equations, therefore, we forced to used Johansen Fisher panel cointegration test that are widely used panel cointegration technique to provide robust inferences. The insignificant trace and maximum eigenvalue reject to fail the null hypothesis of no cointegration while significant values confirmed the cointegration relationships between the variables. Step-IV.Panel Fully Modified OLS
Pedroni (2001)developed the non-parametric approach that is ac-counted for both the endogeneity and serial correlation problems from the given data set of the variables. As panel least square regression created the nuisance problem and lead to asymptotic biased parameter estimates that linked with serious problems of endogeneity and auto-correlations, while panel Fully Modified OLS (FMOLS) is the desirable econometric approach to estimate the long-run parameter estimates that addressed both the endogeneity and serial correlation problems. In this study we employed Pedroni's non-parametric approach, i.e., panel FMOLS estimator to obtain robust statistical estimates for policy con-clusions.
Step-V.Dumitrescu and Hurlin Panel Causality Test
The study further estimate the causal relationships between air-railways transportation, port container traffic, customs & other import duties, energy demand, and economic growth in a diversified panel of countries. The study usedDumitrescu and Hurlin (2012)panel causality test due to multiple reasons i.e.,
H.U. Rashid Khan et al. Journal of Air Transport Management 70 (2018) 18–35
i) It is wellfitted causality test that perform well in either both the time dependent model and/or cross-sectional dependent model, i.e.,
T>NorT<Nboth are equally valid for estimation purposes. ii) This test is well performed in either unbalanced and/or balanced
panel data.
iii) It accounts for cross-sectional dependence.
iv) The null hypothesis is Homogenous Non Causality (HNC) and evaluated it's against alternative hypothesis of heterogeneous non causality (HENC). The null hypothesis of HNC is defined as:
= ∀ =
v) If the null hypothesis is accepted than we deduced that both the variables does not Granger cause each other and the causal re-lationship is independent with each other, while if we reject the null hypothesis of HNC and accept the HENC hypothesis, it implies that both the variables Granger cause each other and the variable ‘X’ Granger causes the variable‘Y’for all the individuals of the panel. vi) The significant Wald statistics and Zbar statistics confirmed the HENC hypothesis and showed the directional causality between the variables while reverse is hold for accepting the HNC hypothesis of no causality between the variables.
Step–VI.Impulse Response Function (IRF) and Variance Decomposition Analysis (VDA)
The innovation accounting technique is applied on the given data set for examining the forecast relationship between the selected vari-ables. The IRF and VDA technique is applied that provides an empirical illustration about economic shocks pertaining from one variable to other in order to change their magnitudes over a period of time. The vector error correction model is the fundamental test to calculate IRF and VDA. The VDA test is performed when variables forecast errors break down in to its components, which provides random innovation effect on each variable that is associated with the‘response variable’. The IRF affects the current and future values of one variable and the other endogenous variables. It implies that one standard error shock may affect one variable either positively, negatively, or in both direc-tions in response of other variables‘i' at time period‘t + s’with the other variable‘j’at time period‘t’. The mathematical notion is as under:
= +
Where,‘Y’represents endogenous variables andµis the forecast error term.
These empirical sequential steps will allow finding the robust parameter estimates and deducing the policy implications in a given set of countries.
4. Results
Table 2shows the descriptive statistics of the selected variables, as the average value of air freight transport is 1753.659 million ton-km in aggregate panel, 194.855 million ton-km in the panel of low income and lower middle income countries (LI&LMI), and 2792.861 million ton-km in the panel of upper middle and high income (UM&HI) coun-tries. The air transport passengers carried have a mean value of 35063993 passengers in the aggregate panel of countries, 6525975 passengers in the LI&LMI countries panel, and 54089339 passengers in UM&HI countries. The minimum value (maximum and average value) of railways goods transported is about 0.695 (2839124, 176218.8) million ton-km in aggregate panel, 0.695 (665810, 41465.210) million ton-km in LI&LMI countries, and 168.709 (2839124, 266054.5) million ton-km in UM&HI countries. The average value (and standard devia-tion) of railways passengers carried is about 48732.71 (and 139433)
million passenger –km in aggregate panel, 46408.570 (and 159042.300) million passenger–km in LI&LMI countries, and 50282.14 (and 124771.7) million passenger–km in UM&HI countries. The mean value of container port traffic is about 5728008 TEU: 20 foot equivalent units in aggregate panel, 1766973 TEU: 20 foot equivalent units in LI& LMI countries, and 5728008 TEU: 20 foot equivalent units in UM&HI countries with positively skewed distribution with high kurtosis value. The minimum value (maximum, average value) of customs and other import duties is about 0.0013 (44.441, 9.621) % of tax revenue in aggregate panel, 1.606 (44.441, 18.052) % of tax revenue in LI&LMI countries, and 0.0013 (23.899, 4.001) % of tax revenue in UM&HI countries. The average value of energy demand and GDP per capita is about 2048.187 kg of oil equivalent per capita and 13986.89 US$ re-spectively in aggregate panel, 592.505 kg of oil equivalent per capita and 1355.590 US$ respectively in a panel of LI&LMI countries, and 3018.642 kg of oil equivalent per capita and 22407.76 US$ respectively in UM&HI countries respectively. These statistics provide a rough sketch to observe the trend analysis of the respective variables in a panel of LI&LMI countries, UM&HI countries and in aggregate panel.
Table 3shows the results of correlation matrix. The results show that air transport freight, air passengers carried, railways goods trans-ported, and container port traffic has a positive correlation with energy demand and per capita income while these have a negative correlation with the custom duty, however, the results have been changed in re-lationship with railways passengers carried and energy demand. The relationship between custom duty and railways passenger carried is positive, while there is a negative correlation between railways pas-sengers carried and per capita income in aggregate panel.
The results of correlation coefficient in the panel of LI&LMI coun-tries show that air passengers carried, railways goods transported and container port traffic have a positive correlation with the energy de-mand and per capita income while the impact of these factors have a negative correlation with the custom duty. The railways passengers carried have a positive correlation with energy demand, custom duty, and per capita income, while air transport freight exert a negative correlation on energy demand and custom duty and a positive corre-lation with the per capita income in a panel of countries. Finally, the correlation results in the panel of UM&HI countries show that air transportation factors have a positive correlation with the energy de-mand, and per capita income, while these factors have a negative cor-relation with the custom duty. The railways passengers carried are negatively correlated with the energy demand and per capita income, while it is positively correlated with the custom duty. Railways trans-ported goods and container port traffic both have a positive correlation with the energy demand, while both of the factors negatively correlated with the per capita income. The differential impact of custom duty on railways transported goods and container port traffic, as it has a posi-tive correlation with the railways transported goods, while it is nega-tively correlated with the container port traffic. Thus the overall cor-relation results comes to the conclusion that air transportation factors largely positive with energy demand in aggregate panel and UM&HI countries, while in a panel of LI&LMI countries, the positive impact of air passengers carried support the energy demand while it becomes negative by using air transportation freight. However, one thing is all clear that air and railways transportation factors largely supported the per capita income in majority of the selected panel countries over a period of time.
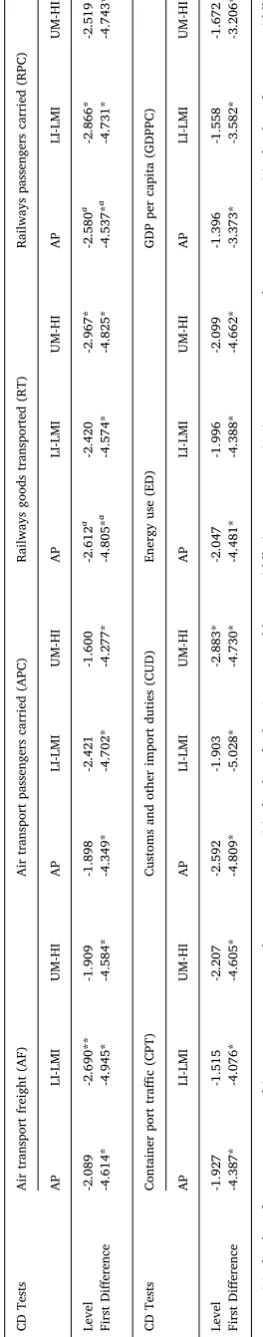
The estimates of cross-sectional dependence test are presented in Table 4for ready reference. The results confirmed the viability of cross-sectional dependence (CD) among heterogeneous countries in the panel setting, as largely, all of the prescribed cross-sectional tests show the significant probability value except in case of air transport freight and railways transported goods in the panel of LI&LMI countries, where Pesaran CD test does not correspond to the significant probability va-lues, however, the remaining three CD tests including Breusch-Pagan LM test, Pesaran scaled LM test and Bias-corrected scaled LM test
Table 2
Descriptive statistics.
Descripti-ve Statistics
Air transport freight (AF) in million ton-km Air transport passengers carried (APC) in numbers Railways goods transported (RT) in million ton-km Railways passengers carried (RPC) in million passenger–km
AP LI-LMI UM-HI AP LI-LMI UM-HI AP LI-LMI UM-HI AP LI-LMI UM-HI
Mean 1753.659 194.855 2792.861 35063993 6525975 54089339 176218.8 41465.210 266054.5 48732.71 46408.570 50282.14
Maximum 40617.740 1851.327 40617.74 7.98E+08 98927860 7.98E+08 2839124 665810 2839124 1158742 1158742 815699
Minimum 0.004 0.004 0.593232 96444 96444 318300 0.695 0.695 168.709 10.465 33 10.465
Std. Dev. 5177.499 281.966 6476.807 1.04E+08 14427654 1.30E+08 523881.7 117260.100 654481.5 139433 159042.300 124771.7
Skewness 5.489 2.902 4.20231 5.401 4.078 4.143 3.487 3.296 2.576 4.535 4.786 3.982
Kurtosis 35.654 14.619 21.43989 33.095 20.663 19.824 14.198 14.085 8.192 26.231 27.107 20.932
Countries 40 16 24 40 16 24 40 16 24 40 16 24
Descripti-ve Statistics
Container port traffic (CPT) in TEU: 20 foot equivalent units
Customs and other import duties (CUD) in % of tax revenue
Energy use (ED) in kg of oil equivalent per capita GDP per capita (GDPPC) in constant 2010 US$
AP LI-LMI UM-HI AP LI-LMI UM-HI AP LI-LMI UM-HI AP LI-LMI UM-HI
Mean 5728008 1766973 5728008 9.621 18.052 4.001 2048.187 592.505 3018.642 13986.89 1355.590 22407.76
Maximum 1.82E+08 11900763 1.82E+08 44.441 44.441 23.899 8056.864 4856.586 8056.864 75768.79 3977.224 75768.79
Minimum 78285 207577 78285 0.0013 1.606 0.0013 115.7091 115.709 723.846 160.321 160.321 725.978
Std. Dev. 15879677 2336104 15879677 9.987 10.289 4.089 1894.571 678.343 1822.476 17624.49 845.782 18439.04
Skewness 7.166 2.244 7.166 1.344 0.549 1.616 1.153 3.711 0.846 1.401 0.891 0.793
Kurtosis 65.902 8.119 65.902 4.178 2.554 6.049 3.560 17.201 2.913 3.971 2.984 2.633
Countries 40 16 24 40 16 24 40 16 24 40 16 24
Note: AP shows aggregate panel, LI-LMI shows low income-lower middle income countries, UM-HI shows upper middle-high income countries.
H.U.
Rashid
Khan
et
al.
Jo
urn
al
o
f A
ir Tran
spo
rt M
an
age
m
en
t 7
0 (2
01
8) 1
8–3
5
Table 3
Correlation matrix.
Correlation Air transport freight (AF) Air transport passengers carried (APC)
Container port traffic (CPT) Customs and other import duties (CUD)
Energy use (ED) GDP per capita (GDPPC) Railways passengers
carried (RPC)
Railways goods transported (RT)
AP LI-LMI UM-HI AP LI-LMI UM-HI AP LI-LMI UM-HI AP LI-LMI UM-HI AP LI-LMI UM-HI AP LI-LMI UM-HI AP
LI-LMI UM-HI
AP
LI-LMI UM-HI
AF 1 1 1
APC 0.975 0.848 0.975 1 1 1
CPT 0.568 0.827 0.545 0.565 0.857 0.541 1 1 1
CUD -0.209 -0.036 -0.124 -0.202 -0.171 -0.120 -0.160 -0.215 -0.020 1 1 1
ED 0.505 -0.035 0.487 0.502 0.049 0.498 0.161 0.029 0.045 -0.585 -0.393 -0.397 1 1 1
GDPPC 0.366 0.259 0.283 0.335 0.361 0.258 0.078 0.533 -0.054 -0.534 -0.402 -0.475 0.800 0.537 0.711 1 1 1
RPC 0.190 0.782 0.249 0.186 0.674 0.208 0.592 0.534 0.819 0.017 0.024 0.068 -0.006 0.053 -0.045 -0.055 0.005 -0.113 1 1 1
RT 0.735 0.616 0.726 0.758 0.554 0.750 0.656 0.391 0.645 -0.118 -0.078 0.110 0.404 0.452 0.358 0.101 0.166 -0.029 0.466 0.895 0.554 1 1 1
Note: AP shows aggregate panel, LI-LMI shows low income-lower middle income countries, UM-HI shows upper middle-high income countries.
Table 4
Cross-sectional dependence tests.
CD Tests Air transport freight (AF) Air transport passengers carried (APC) Railways goods transported (RT) Railways passengers carried (RPC)
AP LI-LMI UM-HI AP LI-LMI UM-HI AP LI-LMI UM-HI AP LI-LMI UM-HI
LMBP 5935.362* 747.081* 2383.163* 10449.14* 1688.876* 3819.508* 6124.812* 710.313* 2796.513* 6590.962* 750.868* 2782.884*
LMPS 129.513* 39.445* 88.665* 243.795* 100.237* 149.800* 134.309* 37.071* 106.258* 146.112* 39.689* 105.678*
LMBC 128.713* 39.125* 88.185* 242.995* 99.917* 149.320* 133.509* 36.751* 105.778* 145.312* 39.369* 105.198*
CDP 14.493* -0.568 20.646* 90.630* 35.299* 55.715* 5.659* -0.049 3.751* 7.963* 3.202* 3.490*
CD Tests Container port traffic (CPT) Customs and other import duties (CUD) Energy use (ED) GDP per capita (GDPPC)
AP LI-LMI UM-HI AP LI-LMI UM-HI AP LI-LMI UM-HI AP LI-LMI UM-HI
LMBP 13948.50* 2009.701* 5258.864* 5263.994* 883.257* 1800.980* 7599.959* 1553.005* 2301.877* 14899.29* 2428.061*
5364.461-*
LMPS 332.393* 120.946* 211.063* 112.515* 48.235* 63.885* 171.658* 91.467* 85.205* 356.466* 147.951* 215.557*
LMBC 331.593* 120.626* 210.583* 111.715* 47.915* 63.405* 170.858* 91.147* 84.725* 355.666* 147.631* 215.077*
CDP 109.960* 39.601* 70.033* 24.569* 8.308* 14.440* 20.422* 9.489* 12.063* 118.807* 48.059* 72.057*
Note: AP shows aggregate panel, LI-LMI shows low income-lower middle income countries, UM-HI shows upper middle-high income countries. CD shows cross-sectional dependence test. LMBPshows Breusch-Pagan LM test, LMPSshows Pesaran scaled LM test, LMBCshows Bias-corrected scaled LM test, and CDPshows Pesaran CD test. * shows 1% level of significance.
H.U.
Rashid
Khan
et
al.
Jo
urn
al
o
f A
ir Tran
spo
rt M
an
age
m
en
t 7
0 (2
01
8) 1
8–3
confirmed the significant probability value which indicates that the said variables dependently cross-sectional over a period of time.
The aggregated panel and UM&HI countries confirmed the depen-dence of cross-sectional among the countries in the panel settings in all of the prescribed CD tests accordingly. The results provoked the need of sophisticated econometric technique that should address the possible cross-sectional dependence among panel of countries for robust results. Table 5 shows the estimates of cross-sectional augmented panel unit root test (CIPS test), which is designed for handling the cross-sectional dependence of the selected variables in the panel setting. The results show that air transport freight is differenced stationary variable in aggregate panel and UM&HI countries, while it is level stationary in LI& LMI countries. The air transport passengers carried contain a unit root problem and have a differenced stationary series in the panel of selected countries. The railways transported goods is differenced stationary in aggregate panel and LI&LMI countries, while this relationship exhibit level stationary in UM&HI countries. The railways passengers carried is non-stationary series at level (becomes stationary atfirst difference) in aggregate panel and UM&HI countries while it is level stationary in LI& LMI countries.
The variable of container port traffic is differenced stationary series in the aggregate panel and LI&LMI countries, while it is non-stationary series at level in UM&HI countries. The data of energy demand and per capita income is highly volatile and have an incoherent series that drastically moves upward and downward over a period of time, which was decomposed byfirst differenced to confined the smoothness of data accordingly. Therefore, the order of integration of both the variables are one, i.e., I(1) variables, in the entire selected panel of countries.
Table 6shows the estimates of Fisher panel cointegration test and confirmed the long-run cointegrated relationships between the selected variables. The Fisher trace test and maximum eigenvalue test, both confirmed the eight cointegration equations in aggregate panel, LI&LMI countries, and UM&HI countries. The significant values of trace test and eigenvalue tests confirmed the cointegrated relationships between the variables, which imply the need of further econometric tests to obtain the robust parameter estimates across countries.
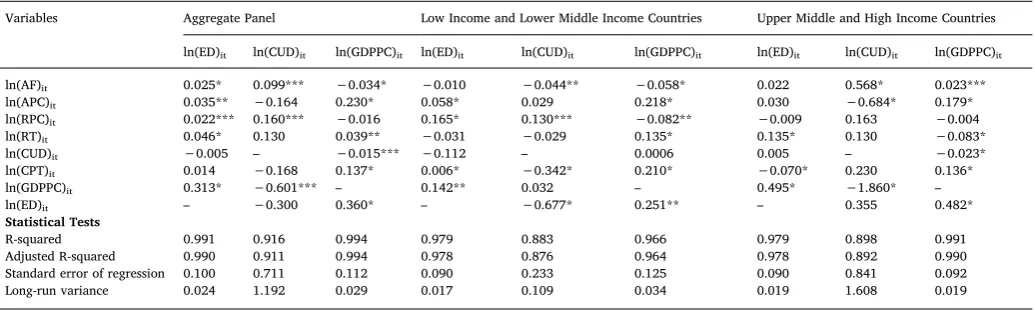
Table 7shows the parameter estimates by panel fully modified OLS estimator. The results show that air transport freight has a positive relationship with energy demand with an estimated elasticity of 0.025% while air passengers carried, railways passengers carried, and railways transported goods have a significant and positive estimated elasticity values of 0.035%, 0.022%, and 0.046% respectively, over energy demand. The results confirmed the strong association of air-railways indicators and energy demand, which implies that transpor-tation sectors required more energy in order to perform their functions efficiently; hence, it substantially increases air transport freight that is largely associated with high energy in aggregated panel. The results are consistent with the previous studies of Vanek and Morlok (2000), Chapman (2007),Jacobson and Delucchi (2011),Schipper et al. (2011), etc. The studies confined the role of transportation sector that required more energy to regulate economic operations (Vanek and Morlok, 2000), while alternate transport fuels may serve the purpose to support economic and environmental issues via the technological upgrading and provision of new sustainable technologies for climate projection (Chapman, 2007). The renewable energy sources to materialize the socio-economic issues (Jacobson and Delucchi, 2011), while transport associated emissions decomposed by sustainable instruments are con-sidered the significant policy instruments for sustainable development. In LI&LMI countries, the impact of air transport freight and railways transported good on energy demand is disappeared as both the vari-ables statistically insignificant over a period of time, however, the im-pact of air and railways passengers carried on energy demand is sta-tistically positive, which shows more energy is needed in order to carrying the passengers from one place to another in a region. The transportation fuel consumed more energy that resulted in greater
carbon emissions and GHG emissions, while goods transportation Table
5
H.U. Rashid Khan et al. Journal of Air Transport Management 70 (2018) 18–35
further enhance the energy demand to perform economic functions certainly compromised environment accordingly (Lenzen, 1999). In a panel of UM&HI countries, air transportation indicators become more unvoiced due to statically insignificant relationship with energy de-mand in a region, however, railways transported goods is statically significant and positively impact on energy demand, which shows more energy is needed to transported goods one place to another. The port container traffic increases energy demand in the panel of LI&LMI countries while it decreases substantially in the UM&HI countries. The following are the possible reasons, which include i) the effect of high fuel costs, which substantially increases the energy demand (Notteboom and Vernimmen, 2009), ii) logistics activities on the port affect the volume of freight distribution that is one step forward for port regionalization (Notteboom and Rodrigue, 2005), iii) movement in port containers required more energy to sustain their operation, however, its impact on carbon changes is cumbersome for project investment (Liao et al., 2010), iv) the determinants of transport maritime cost is basis on port efficiency (Sánchez et al., 2003), and v) energy efficient modes helpful to balanced the port freight volume that lessen the environ-mental issues (Roso et al., 2009). The GDP per capita has a statistically significant and positive impact on energy demand, as if there is 1% increase in the per capita income, energy demand increases by 0.313% in aggregated panel, 0.142% in LI&LMI countries, and 0.495% in UM& HI country. The results are in line with the many previous studies that provoked the need of sustainable energy demand to perform transpor-tation sector efficiently (see,Agrawal et al., 2007;Lund and Kempton, 2008, etc.). Energy efficiency was considered one of the vital
component that helpful to reduce carbon emissions from transportation sector (Ramanathan and Parikh, 1999) while hydrogen energy was considered the sustainable fuel that reducing the dependency of pet-roleum oil and promoted the energy efficiency, which is vital for ful-filling the demand of road transportation sector (Kim and Moon, 2008). Although, the sustainable energy instruments are somehow vital for mitigating carbon emissions and greenhouse gas emissions, however, the cost of adoption of the renewable sources somehow greater than the traditional energy was used in transportation sector. The uncertainty is still prevailed with the solar, wind and other bioenergy fuels, i.e., whether it will reduce carbon emissions largely as per desired level by using the renewable energy sources in transportation sector. These uncertainties required more knowledge transfusions that vital for sup-port transsup-portation sector moving in a sustainable mode (Johansson, 2009). Energy sector requires more concentrated efforts to utilize en-ergy technologies and approaches to perform its smooth functioning that fulfilled the global energy security (Armstrong et al., 2016), while in the similar means energy intensity support to reduce fossil fuel en-ergy demand from transportation sector that would be the good enough to design transportation sector on sustainable nodes (Achour and Belloumi, 2016a).
The air transport freight has a positive impact on custom duty in aggregated panel and UM&HI countries, while this result is averted in LI &LMI countries. The air passengers carried substantially decline the customs duty in UM&HI countries, while this result is not further sup-ported in aggregated panel and LI&LMI countries due to insignificant statistic values. The railways passengers carried support to increase Table 6
Johansenfisher panel cointegration test.
Number of Cointegration
Fisher Trace Test Statistics Fisher Maximum Eigenvalue
Aggregate Panel Low income and Lower Middle Income Countries
Upper Middle and High Income Countries
Aggregate Panel Low income and Lower Middle Income Countries
Upper Middle and High Income Countries
None 304.0* 154.3* 149.7* 377.7* 191.1* 186.6*
At most 1 2012.0* 713.7* 1299.0* 2570.0* 1034.0* 1536.0*
At most 2 1818.0* 694.3* 1124.0* 957.4* 376.1* 581.2*
At most 3 1136.0* 422.3* 713.4* 588.0* 226.5* 361.5*
At most 4 693.6* 246.4* 447.3* 384.2* 147.7* 236.5*
At most 5 388.4* 130.6* 257.8* 241.0* 86.82* 154.2*
At most 6 230.6* 72.19* 158.4* 193.5* 57.22* 136.3*
At most 7 153.3* 56.78* 96.57* 153.3* 56.78* 96.57*
Note: * indicates 1% level of significance.
Table 7
Panel FMOLS estimates.
Variables Aggregate Panel Low Income and Lower Middle Income Countries Upper Middle and High Income Countries
ln(ED)it ln(CUD)it ln(GDPPC)it ln(ED)it ln(CUD)it ln(GDPPC)it ln(ED)it ln(CUD)it ln(GDPPC)it
ln(AF)it 0.025* 0.099*** −0.034* −0.010 −0.044** −0.058* 0.022 0.568* 0.023***
ln(APC)it 0.035** −0.164 0.230* 0.058* 0.029 0.218* 0.030 −0.684* 0.179*
ln(RPC)it 0.022*** 0.160*** −0.016 0.165* 0.130*** −0.082** −0.009 0.163 −0.004
ln(RT)it 0.046* 0.130 0.039** −0.031 −0.029 0.135* 0.135* 0.130 −0.083*
ln(CUD)it −0.005 – −0.015*** −0.112 – 0.0006 0.005 – −0.023*
ln(CPT)it 0.014 −0.168 0.137* 0.006* −0.342* 0.210* −0.070* 0.230 0.136*
ln(GDPPC)it 0.313* −0.601*** – 0.142** 0.032 – 0.495* −1.860* –
ln(ED)it – −0.300 0.360* – −0.677* 0.251** – 0.355 0.482*
Statistical Tests
R-squared 0.991 0.916 0.994 0.979 0.883 0.966 0.979 0.898 0.991
Adjusted R-squared 0.990 0.911 0.994 0.978 0.876 0.964 0.978 0.892 0.990
Standard error of regression 0.100 0.711 0.112 0.090 0.233 0.125 0.090 0.841 0.092
Long-run variance 0.024 1.192 0.029 0.017 0.109 0.034 0.019 1.608 0.019
Note: *, **, and *** shows 1%, 5%, and 10% level of significance.
customs duty in aggregated panel and LI&LMI countries. The container port traffic largely decreases custom duty, as if there is 1% increase in port container traffic, the custom duty decreases by 0.342% in a panel of LI&LMI countries. The per capita income decreases custom duty in aggregated panel with the elasticity estimate of 0.601% while it creases by 1.860% in UM&HI countries. Finally, energy demand de-creases customs duty by the estimated elasticity value of 0.677% in a panel of LI&LMI countries. The results are in line with the energy transportation sustainable agenda and provoked the need of reducing transportation for healthier development (Yan and Crookes, 2010). It is
evident that energy sustainable agenda is compromised by number of factors, including traffic inefficiency, customer's choice, and govern-ment actions, which are closely connected with the urbanization, peo-ple's well-being, and economic development (Hu et al., 2010), hence the policy should be related for private vehicles with cost-effective choices in carbon constrained environment (Grahn et al., 2009). The urban transport sector is highly linked with the greater environmental pressure, which is compromised the environmental sustainable agenda; therefore, the investment in the‘innovative bus transit transport’may be the good substitution in the existing transport infrastructure that will Table 8
Panel Heterogeneous non-causality test.
S.No. Null Hypothesis Aggregate Panel Low Income and Lower Middle Income Countries Upper Middle and High Income Countries
W-Stat. Zbar-Stat. Prob. W-Stat. Zbar-Stat. Prob. W-Stat. Zbar-Stat. Prob.
1 AF ¥ ED 3.79697 3.92605 9.E−05 3.50901 2.02520 0.0428 5.02295 5.42850 6.E−08
ED ¥ AF 3.68208 3.63721 0.0003 3.76356 2.42993 0.0151 24.9881 44.3073 0.0000
2 APC ¥ED 3.10570 2.18820 0.0287 4.17015 3.07639 0.0021 4.22420 3.87307 0.0001
ED ¥ APC 4.56492 5.85667 5.E−09 5.70995 5.52467 3.E−08 4.87693 5.14413 3.E−07
3 CPT ¥ ED 4.89811 6.69430 2.E−11 3.07825 1.34028 0.1802 4.02745 3.48993 0.0005
ED ¥ CPT 5.43038 8.03243 9.E−16 2.98622 1.19397 0.2325 3.16835 1.81697 0.0692
4 CUD ¥ED 3.67962 3.63103 0.0003 4.44421 3.51215 0.0004 3.17400 1.82797 0.0676
ED ¥ CUD 3.37220 2.85817 0.0043 2.96124 1.15425 0.2484 4.35413 4.12607 4.E−05
5 GDPPC ¥ED 5.27163 7.63332 2.E−14 5.15818 4.64736 3.E−06 4.03253 3.49982 0.0005
ED ¥GDPPC 3.51420 3.21517 0.0013 3.23565 1.59056 0.1117 2.38839 0.29812 0.7656 6 RPC ¥ED 4.18020 4.88949 1.E−06 4.83608 4.13522 4.E−05 2.90186 1.29802 0.1943
ED ¥ RPC 4.36667 5.35827 8.E−08 2.26101 0.04089 0.9674 3.84790 3.14028 0.0017
7 RT ¥ ED 3.83315 4.01699 6.E−05 4.49200 3.58814 0.0003 4.67192 4.74491 2.E−06
ED ¥ RT 2.94441 1.78272 0.0746 5.72528 5.54904 3.E−08 4.67459 4.75012 2.E−06
8 APC ¥AF 4.41738 5.48574 4.E−08 5.99316 5.97496 2.E−09 11.1394 17.3392 0.0000
AF ¥APC 16.4983 35.8571 0.0000 6.76943 7.20922 6.E−13 3.31460 2.10176 0.0356
9 CPT ¥ AF 4.20258 4.94575 8.E−07 4.20718 3.13527 0.0017 2.02202 −0.41532 0.6779
AF ¥CPT 5.21014 7.47874 8.E−14 3.30735 1.70456 0.0883 2.93859 1.36955 0.1708
10 CUD ¥AF 3.64777 3.55095 0.0004 5.42286 5.06819 4.E−07 3.99297 3.42277 0.0006
AF ¥ CUD 3.09550 2.16255 0.0306 3.53396 2.06486 0.0389 2.82020 1.13900 0.2547 11 GDPPC ¥ AF 4.48279 5.65020 2.E−08 7.00418 7.58248 3.E−14 7.02703 9.33110 0.0000
AF ¥GDPPC 2.72729 1.23688 0.2161 2.82636 0.93979 0.3473 2.99320 1.47590 0.1400 12 RPC ¥ AF 3.67555 3.62078 0.0003 3.18804 1.51486 0.1298 4.44812 4.30911 2.E−05
AF ¥ RPC 3.21315 2.45831 0.0140 2.09902 −0.21667 0.8285 3.88891 3.22014 0.0013
13 RT ¥AF 4.59995 5.94473 3.E−09 1.70818 −0.83810 0.4020 4.14496 3.71876 0.0002
AF ¥RT 5.09487 7.18895 7.E−13 5.44066 5.09649 3.E−07 5.54167 6.43860 1.E−10
14 CPT ¥ APC 9.08089 17.2098 0.0000 4.40192 3.44492 0.0006 4.23091 3.88612 0.0001 APC ¥ CPT 4.69653 6.18753 6.E−10 77.4238 119.549 0.0000 3.08147 1.64779 0.0994
15 CUD ¥APC 2.89608 1.66121 0.0967 8.59901 10.1182 0.0000 3.31796 2.10832 0.0350 APC ¥CUD 3.08609 2.13891 0.0324 3.75572 2.41746 0.0156 5.65971 6.66847 3.E−11
16 GDPPC ¥APC 7.01789 12.0234 0.0000 5.25414 4.79993 2.E−06 5.98017 7.29252 3.E−13
APC ¥GDPPC 2.92647 1.73760 0.0823 3.24980 1.61306 0.1067 2.64602 0.79982 0.4238 17 RPC ¥APC 3.94409 4.29590 2.E−05 3.45691 1.94236 0.0521 6.63862 8.57474 0.0000
APC ¥RPC 3.17295 2.35727 0.0184 3.88577 2.62423 0.0087 2.65643 0.82010 0.4122 18 RT ¥APC 3.17025 2.35047 0.0187 2.30324 0.10804 0.9140 5.84636 7.03194 2.E−12
APC ¥ RT 5.50126 8.21063 2.E−16 3.51959 2.04202 0.0411 3.93799 3.31571 0.0009
19 CUD ¥ CPT 4.29931 5.18893 2.E−07 4.19544 3.11661 0.0018 2.82337 1.14518 0.2521
CPT ¥ CUD 32.8184 76.8858 0.0000 4.30245 3.28676 0.0010 3.26440 2.00401 0.0451 20 GDPPC ¥CPT 5.68976 8.68451 0.0000 4.61957 3.79098 0.0002 5.77763 6.89809 5.E−12
CPT ¥GDPPC 2.88753 1.63973 0.1011 3.10851 1.38840 0.1650 3.33640 2.14422 0.0320 21 RPC ¥ CPT 5.36594 7.87042 4.E−15 2.79592 0.89139 0.3727 5.14217 5.66065 2.E−08
CPT ¥ RPC 3.14817 2.29496 0.0217 7.45438 8.29830 0.0000 3.74043 2.93099 0.0034 22 RT ¥CPT 4.42911 5.51525 3.E−08 2.35152 0.18480 0.8534 4.68455 4.76952 2.E−06
CPT ¥ RT 3.77063 3.85982 0.0001 6.15116 6.22619 5.E−10 2.81704 1.13284 0.2573
23 GDPPC ¥CUD 5.31441 7.74087 1.E−14 3.36854 1.80186 0.0716 6.54035 8.38337 0.0000
CUD ¥ GDPPC 3.24524 2.53900 0.0111 4.30036 3.28343 0.0010 2.99010 1.46986 0.1416 24 RPC ¥ CUD 4.20367 4.94849 7.E−07 2.96103 1.15391 0.2485 4.99299 5.37014 8.E−08
CUD ¥ RPC 5.22601 7.51864 6.E−14 5.64421 5.42014 6.E−08 3.51498 2.49197 0.0127
25 RT ¥CUD 3.75134 3.81133 0.0001 2.80067 0.89894 0.3687 4.52147 4.45193 9.E−06
CUD ¥ RT 4.15069 4.81528 1.E−06 3.29653 1.68736 0.0915 2.70966 0.92375 0.3556
26 RPC ¥ GDPPC 3.62624 3.49683 0.0005 3.47856 1.97679 0.0481 3.72469 2.90035 0.0037 GDPPC ¥RPC 4.76379 6.35663 2.E−10 4.39672 3.43665 0.0006 5.00851 5.40036 7.E−08
27 RT ¥ GDPPC 2.65708 1.06038 0.2890 1.69043 −0.86633 0.3863 3.30152 2.07629 0.0379
GDPPC ¥RT 5.24036 7.55471 4.E−14 2.96925 1.16698 0.2432 6.75443 8.80026 0.0000
28 RT ¥ RPC 4.14911 4.81131 1.E−06 4.47808 3.56601 0.0004 3.92979 3.29974 0.0010
RPC ¥ RT 4.72996 6.27158 4.E−10 5.18725 4.69358 3.E−06 4.42511 4.26429 2.E−05
Note: ¥ indicates“does not homogenously cause”(i.e., one variable does not homogenously cause other variable).
H.U. Rashid Khan et al. Journal of Air Transport Management 70 (2018) 18–35
improve energy efficiency and reduce carbonization accordingly (Meng et al., 2017). The disposition of old vehicles may considered the effi -cient strategy to reduce energy demand (Deendarlianto et al., 2017), while promotion of energy cleaner production and reduction in the intensity of traffic energy will helpful to achieve global sustainable energy agenda (Chen and Lei, 2017).
The impact of air transport freight has a negative impact on per capita income in aggregated panel and panel of LI&LMI countries while it has a positive relationship between the variable in the panel of UM& HI countries. The air passengers carried substantially improves the country's economic growth in a panel of selected countries while the results are averted when using railways passengers carried in a panel of LI&LMI countries. The relationship between railways transported goods and per capita income is positive in case of aggregated panel and LI& LMI countries while it becomes negative in the panel of UM&HI countries. The custom duty does not translated in to positive growth rate in the country's profile; however port container traffic and energy demand considerably improves the country's economic growth. The
results provoked the need of strategic decision for delimiting the port emissions, which is widely visible in the seaport cargo carriers (Villalba and Gemechu, 2011), however, in the recent days, cargo shipping in the international merchandize trade has been largely documented for sound economic development across Europe (Grossmann et al., 2007). The sea port energy management is imperative for broad-based growth, while this area still not been discussed widely, as it is required effective energy management strategy to coordinate power generation and re-newable uptakes for sustained growth (Acciaro et al., 2014). The rail and maritime transportation largely produced carbon emissions (Jebli and Belloumi, 2017) while it is suggested that shipping and ports in-formation should be well estimated for better environmental quality (Tichavska and Tovar, 2017).
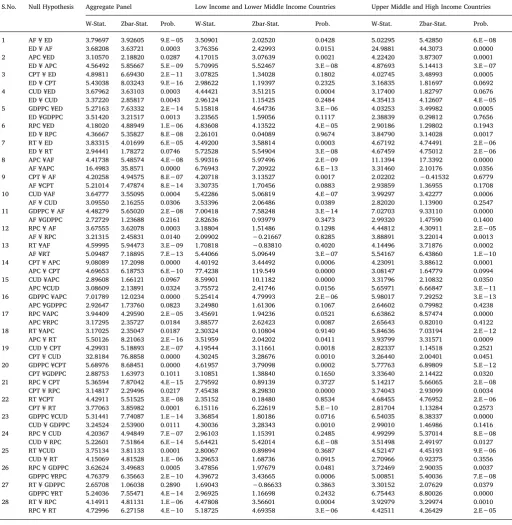
Table 8shows the panel Granger causality estimates and confirmed the different causal channels among the selected variables across countries. The results show that air transport freight and energy de-mand co-move with each other in both of the directions in the panel of LI&LMI countries while the causality running from energy demand to
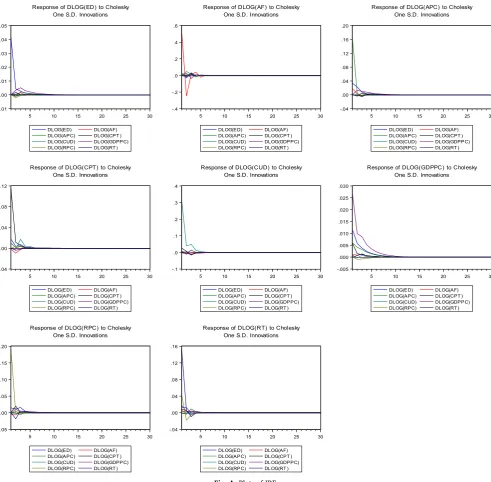
Fig. A.Plots of IRF.
air transport freight in the panel of aggregated panel and UM&HI countries. There is a unidirectional causality running from air transport passengers carried to energy demand across countries. The results are in line with the previous studies ofChang and Chang (2009), where air cargo expansion co-move with economic growth in the context of Taiwan, whileFernandes and Pacheco (2010)confirmed the growth led air transportation demand in Brazil.Christofakis et al. (2013) empha-sized the regulations of port traffic to improve its efficiency and com-petitiveness for economic gains. The causality results confirmed the feedback relationship between container port traffic and energy de-mand in UM&HI countries, which implies that both the variables moves in a same direction during the study time period. The bidirectional causality running between custom duty and energy demand in ag-gregated panel while the unidirectional causality running from custom duty to energy demand in a panel of LI&LMI countries and UM&HI countries. Energy–led growth hypothesis (see,Apergis and Tang, 2013, Sinha and Mehta, 2014; etc.) is supported in aggregated panel while growth–led energy hypothesis (see,Awokuse, 2003supported export led growth hypothesis) in UM&HI countries.
There is a unidirectional causality running from railways trans-ported goods and energy demand in LI&LMI countries while this
relationship is averted in aggregated panel where energy–led trans-portation hypothesis is found significantly. The container port traffic in LI&LMI countries, custom duty, and railways passengers carried in aggregated panel have a bidirectional causality with the air transport freight, while there is a unidirectional causality running from custom duty and per capita income to air transport freight in UM&HI countries. The Granger causality running from air transport freight in LI&LMI countries, container port traffic in aggregated panel and UM&HI countries, per capita income in UM&HI countries, and railways trans-ported goods in aggregated panel to custom duty. The feedback re-lationship is found between container port traffic, custom duty in LI& LMI countries, per capita income in aggregated panel and air passengers carried respectively.
The bidirectional causality exists between custom duty and con-tainer port traffic in LI&LMI countries while there is unidirectional causality running from per capita income to port traffic in aggregated panel and LI&LMI countries. The feedback hypothesis is confirmed between railways goods (in LI&LMI countries) & passengers carried (UM&HI countries) and per capita income, while this relationship is changed and becomes in unidirectional causality in port container traffic (in UM&HI countries), custom duty (in aggregated panel and LI&
Fig. B.Plots of VDA.
H.U. Rashid Khan et al. Journal of Air Transport Management 70 (2018) 18–35