Association Studies of Traits in Indonesian Rice
James W. Baurley1, Bens Pardamean1Anzaludin S. Perbangsa1, Dwinita Utami2, Habib Rijzaani2, and Dani Satyawan2
1 Bioinformatics Research Group, Bina Nusantara University, Jakarta, Indonesia
[email protected] http://www.binus.edu
2 Indonesian Center for Agricultural Biotechnology and Genetic Resources Research
and Development, Bogor, Indonesia
Abstract. Asian rice is a staple food in Indonesia and worldwide, and its production is essential to food security. Cataloging and linking genetic variation in Asian rice to important traits, such as quality and yield, is needed in developing superior varieties of rice. We develop a bioinfor-matics workflow for quality control and data analysis of genetic and trait data for a diversity panel of 467 rice varieties found in Indonesia. The bioinformatics workflow operates using a back-end relational database for data storage and retrieval. Quality control and data analysis procedures are implemented and automated using the whole genome data analysis toolset, PLINK, and the [R] statistical computing language. The 467 rice varieties were genotyped using a custom array (717,312 genotypes total) and phenotyped for 12 traits in four locations in Indonesia across multiple seasons. We applied our bioinformatics workflow to these data and present prototype genome-wide association results for a continuous trait - days to flowering. Two genetic variants, located on chromosome 4 and 12 of the rice genome, showed evidence for association in these data. We conclude by outlining extensions to the workflow and plans for more sophisticated statistical analyses.
Keywords: data analysis, workflow, agriculture genetics, genome-wide association study, bioinformatics, statistical genetics.
1
Introduction
Indonesia is located in one of the most biodiverse regions in the world. Studying the biodiversity unique to this region for agriculturally important species can lead to crop and animal improvements.Oryza saliva or Asian rice is a staple food in Indonesia and worldwide, and its production is essential to food security. Cataloging and linking genetic variation in Asian rice to important traits, such as quality and yield, is needed to develop new varieties of rice with superior properties.
The 389 Megabase (Mb) Asian rice genome consist of 12 chromosomes [1]. Throughout the genome, sequence variations called single-nucleotide polymor-phism (SNP) are common. At these locations (or loci), the alternative nucleotides
Linawati et al. (Eds.): ICT-EurAsia 2014, LNCS 8407, pp. 356–364, 2014. c
are called alleles, and the two alleles from the paired chromosomes are called SNP genotypes. High-throughput genotyping and sequencing technologies have revolutionized agriculture genetics, allowing for genome-wide interrogation of thousands of SNPs. Recent research using these technologies, have focused on genome-wide genotyping of a rice diversity panel consisting of 413 varieties from 82 countries [2]. While this research has identified genetic regions associated with many complex traits, there is still much to learn about the genetics of rice varieties specific to Indonesia.
The Indonesian Center for Agricultural Biotechnology and Genetic Research and Development (ICABIOGRAD) has developed an unique rice diversity panel of 467 rice varieties found in Indonesia. The panel was planted in a greenhouse (BG) with controlled environment and three fields at different elevations, located in the cities of Citayam, Subang, and Kuningan. The rice was planted in multiple seasons. The diversity panel was genotyped with two panels of 384 and 1,536 SNPs on the GoldenGate platform (Illumina, Inc). The rice was also extensively phenotyped at each location (see Table 1). Given the complexity and volume of the data collected, center researchers needed an efficient and easy system to manage these data and perform numerous genetic association analyses by traits and location.
We designed and implemented a custom bioinformatics workflow for the ge-netic association study of these traits in Indonesian rice. In the next sections, we present the workflow design, the specifics of the implementation, and prototype results.
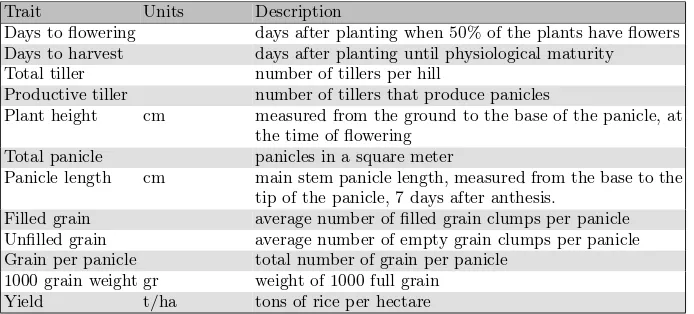
Table 1.Rice complex traits measured on 467 rice varieties in 4 locations
Trait Units Description
Days to flowering days after planting when 50% of the plants have flowers
Days to harvest days after planting until physiological maturity
Total tiller number of tillers per hill
Productive tiller number of tillers that produce panicles
Plant height cm measured from the ground to the base of the panicle, at
the time of flowering
Total panicle panicles in a square meter
Panicle length cm main stem panicle length, measured from the base to the
tip of the panicle, 7 days after anthesis.
Filled grain average number of filled grain clumps per panicle
Unfilled grain average number of empty grain clumps per panicle
Grain per panicle total number of grain per panicle
1000 grain weight gr weight of 1000 full grain
2
Methods
2.1 Bioinformatics Workflow
We constructed a workflow that captures the bioinformatics needed for data quality control and analysis for both genotypes and phenotypes (trait) (Figure 1). Quality control procedures were designed to process the panel of 467 rice varieties captured across the four locations and the genetic data generated from the 384 and 1,536 genotyping arrays. The output of the quality control steps were cleaned data ready for downstream statistical modeling. These datasets were inputs to multi-step analyses pipelines. The output were summary tables and figures of statistical association (Figure 1). The workflow was implemented using a combination of software tools and custom programming that included a relational database, the whole genome association analysis toolset PLINK [3], and the [R] statistical language [4].
Fig. 1.Bioinformatics workflow of rice genetic and phenotypic data
2.2 Rice Relational Database
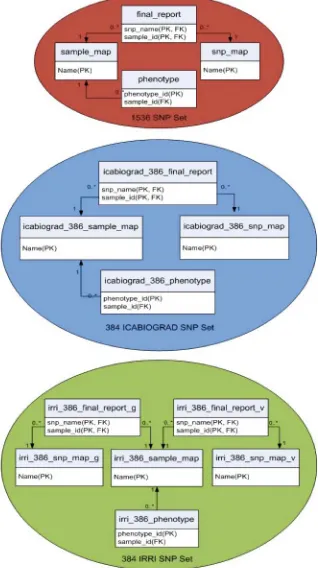
The bioinformatics workflow operates on a backend relational database for data storage and retrieval. We selected PostgreSQL as a database management system (DBMS) because it is open source and well known for its security, scalability, and active developer community. The entity-relationship diagram for the rice database is presented in Figure 2.2.
Institute (IRRI). The snp map table describe the SNPs contained on the array, such as where (chromosome and position); the polymorphic nucleotides - adenine (A), cytosine (C), thymine (T), and guanine (G); and attributes of the array design. The sample map table contains data on the DNA samples and links to the trait data. The final report contains the genotypes for all the samples as well as information on the quality of the genotype calling. Trait data is stored in the phenotype table and linked to the sample map by a one-to-many relationship.
The primary key for final report is the combination of sample index and snp index and dramatically improves the speed of sample based data retrieval (i.e., queries by sample). A second index for final report with the order of the columns reversed allows for quick retrieval of SNP-based queries (e.g., genotypes for particular SNPs). Once the genotype data is imported into the database, the data can be extracted (in whole or by subsets) using Structured Query Language (SQL). This allows for sophisticated filtering and quality control.
2.3 Quality Control
For phenotypes, the database is queried using the RPostgreSQL package in [R]. Various [R] scripts and functions are then called to summarize the distribution of each trait by location. Histograms and box plots are used to visually compare the distributions and assess normality. Summaries of each variable are created (i.e., minimum, quartiles, maximum) and outliers are reported for verification.
For the array data, the genotypes are exported from the database into PLINK and converted to binary format for improved performance. The genotype call rate (i.e., the rate of non-missing genotypes) for SNPs and samples are computed and removed if less than 75%. The minor allele frequency (MAF), the frequency of the least common allele, are computed and SNPs with a MAF<0.05 are flagged as rare variants. When samples were duplicated, genotype concordance is computed to identify SNPs that were not consistently called by clustering algorithms.
Plots are created to evaluate if the clustering algorithm was correctly assigning genotypes. A database query retrieves the r, theta, allele1 ab, and allele2 ab columns from the final report table for particular SNPs. The polar intensities (r, theta) are plotted and compared to the called genotypes AA, AB, BB. When there are genotype misclassifications or missingness, further investigation into the clustering algorithm and assumptions are needed. The quality control steps yield cleaned datasets ready for statistical analyses.
2.4 Data Analysis
Descriptive statistics for each trait are generated in [R] and stratified by location and season/year. Descriptive statistics for continuous variables are expressed as mean, median, standard deviation, and ranges. Analyses of continuous variables are performed using t-test or an analysis of variance (ANOVA), as appropriate. Discrete variables are expressed as frequencies and percentages. The analyses of discrete variables are performed using the appropriate chi-squared test. Fishers exact test are used for small cell sizes (< 5). For the phenotypes, all tests of significance are two-tailed, with statistical significance set atp <0.05.
Principal components analysis (PCA) was implemented in [R] to correct for stratification in the rice diversity panel [5]. The top principal components are used as covariates in regression modeling.
The workflow uses generalized linear models (GLM) to model the relationship between traits and each of the 1,536 genotypes. This analysis is stratified by location and season/year. The dataDcontain the trait variableY and a matrix ofP explanatory variables X(which included each SNP and the top principal components as covariates). The expected value ofYi, the trait variable for rice
varianti, depends on the linear predictors through the link functiongsuch that,
g(µi) =β0+
0, 1, or 2 for the number of minor alleles. For continuous traits, the identity link function (i.e., linear regression) is used. For binary traits, the logit link function is used,g(πi) = log
The workflow concludes with summarizes of the results obtained from previous steps. Quantile-quantile (QQ) plots are generated for each trait to compare the observedp-value distribution to the expected uniform distribution. Additionally, Manhatten plots are generated to show the p-value results of each association scan by rice chromosome, withp-values less than the user-defined genome-wide threshold for statistical significance highlighted.
3
Prototype Results
The rice database consists of 17 tables in three schemas, the 1,536 and 384 SNP arrays from ICABIOGRAD and the IRRI 384 SNP array as an standard for assessment. The size of database is 280 Megabytes (Mb). The bioinformat-ics workflow (Figure 1) was run on the largest genotyping array (1,536 SNPs). With the entire diversity panel genotyped, there were 717,312 genotypes in the final report.
A PLINK file was generated and quality control was performed. 16 rice sam-ples and 139 SNPs were removed with poor call rates (<75%). 451 samples and 1397 SNPs were available for statistical analysis. Principle components (PC) analysis was performed using all SNPs, and the first four PCs were included in model 1 as covariates.
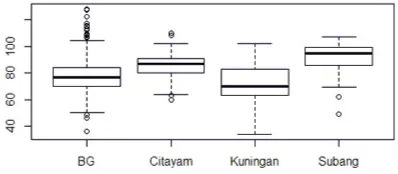
The days to flowering trait was used for prototyping. A summary of the dis-tribution for this trait by location is presented in Figure 3. The box plot shows that there is variation in this trait by location.
Fig. 3.Boxplot for days to flowering by location (n=467)
Fig. 4.Genome-wide association results for days to flowering, greenhouse
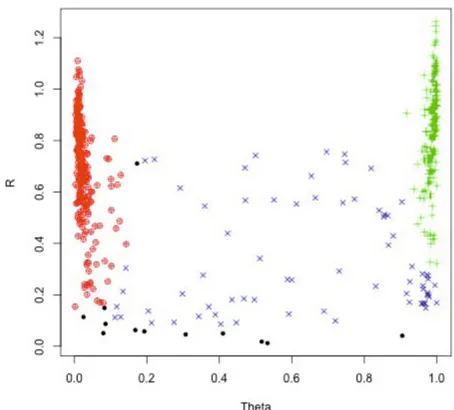
Fig. 5.Clustering for top associated SNP
For the top associated SNP, the polar intensities were plotted versus the called genotypes. Intensities with the homozygous genotypes AA and BB were colored in red and green respectively. Heterozygous genotypes AB were plotted in blue. Uncalled genotypes were plotted in black. The graphic illustrates that for this SNP there was a distinct cluster for homozygous genotypes (AA and BB) and a large cluster for heterozygous genotypes (AB). There were 12 samples with no genotype for this SNP.
4
Conclusions
We developed a custom bioinformatics workflow for a genome-wide association study of traits in Indonesian rice. The workflow consisted of a relational database and multi-step quality control and data analysis procedures automated in PLINK and [R]. The prototype results demonstrated that the workflow is useful for summarizing and visualizing the complex data from this study.
Future work includes configuring the workflow to run for all traits, locations, and seasons. Additionally, improvements to the clustering algorithm and statisti-cal modeling framework may be made. Given the small sample sizes in this study and that rice is highly homozygous, an alternative algorithm such as ALCHEMY may improve genotype calling [6]. Model 1 may be extended to account for the relatedness among the rice varieties using a mixed model [7]. Environmental factors include the habitat, location, season, and year are possible modifiers of the relationship between genetics and traits. The statistical framework can be modified to consider gene-environment interactions (GxE).
This bioinformatics workflow gives researchers the tools needed to easily and consistently quality control and analyze complex data. This research will help locate genes that are important for developing new rice varieties that ensure future food security in Indonesia.
Acknowledgements. This research is funded by the Indonesian Center for Agricultural Biotechnology and Genetic Resources Research and Development, Indonesian Agency for Agricultural Research and Development, Ministry of Agri-culture, Indonesia. Computing support by AWS in Education Grant award.
References
1. International Rice Genome Sequencing Project: The map-based sequence of the rice genome. Nature 436(7052), 793–800 (2005)
2. Zhao, K., Tung, C.W., Eizenga, G.C., Wright, M.H., Ali, M.L., Price, A.H., Norton, G.J., Islam, M.R., Reynolds, A., Mezey, J., McClung, A.M., Bustamante, C.D., McCouch, S.: Genome-wide association mapping reveals a rich genetic architecture of complex traits in Oryza sativa. Nat. Commun. 2, 467 (2011)
4. R Development Core Team.: R: A Language and Environment for Statistical Com-puting. R Foundation for Statistical Computing, Vienna, Austria,
http://www.R-project.org/, ISBN 3-900051-07-0
5. Price, A.L., Patterson, N.J., Plenge, R.M., Weinblatt, M.E., Shadick, N.A., Reich, D.: Principal components analysis corrects for stratification in genome-wide associ-ation studies. Nat. Genet. 38(8), 904–909 (2006)
6. Wright, M.H., Tung, C.W., Zhao, K., Reynolds, A., McCouch, S.R., Bustamante, C.: ALCHEMY: a reliable method for automated SNP genotype calling for small batch sizes and highly homozygous populations. Bioinformatics 26(23), 2952–2960 (2010)
7. Yu, J., Pressoir, G., Briggs, W.H., Vroh Bi, I., Yamasaki, M., Doebley, J.F., Mc-Mullen, M.D., Gaut, B.S., Nielsen, D.M., Holland, J.B., Kresovich, S., Buckler, E.S.: A unified mixed-model method for association mapping that accounts for multiple levels of relatedness. Nat. Genet. 38(2), 203–208 (2006)