SUB THEME: ECONOMICS
HOUSEHOLD POVERTY IN RURAL INDONESIA: A CASE STUDY
OF SENUJUH VILLAGE, WEST KALIMANTAN
Susilo Nur Aji Cokro Darsono1, Mongkon Donkwa2
1Master of Rural Development Management, Khon Kaen University, Thailand 2Faculty of Education, Khon Kaen University, Thailand
Email: susilonuraji@hotmail.com
Abstract
The purpose of this study was to describe household poverty in rural Indonesia by case study of one underdeveloped village in West Kalimantan Province. The study was conducted in Senujuh Village, Sejangkung Sub-district, Sambas Regency, West Kalimantan. There are 352 Households in Senujuh Village, with a sample of 80 poor households which find out based on the Simple Random Sampling from 105 household which listed as poor. The instrument of data collection used questionnaires and interviews. The study use Descriptive Statistics to describe the household poverty in rural area. The results showed that 53.8% head household had income between 25
• 50 USD per month per capita, 45% head household were not passed elementary
school, 26.3% had 4 family members in one household, 41.3% had working days in between 11•15 days per month, 38.8% head household were 30 •40 years old and
46.3% head household had loan in between 1•10 USD per month.
Keywords: Household Poverty, Kalimantan, Rural Poverty
INTRODUCTION
Poverty is a complex problem that faced by almost developing countries since many years ago. It is interlinked with many factors, such as education, employment, income, health, age, gender, natural resources, environment, political conditions and etc. According to Coudouel et al. (2002) poverty is the abilities or resources which have by households or individuals today to meet their needs. World Bank (World Bank, 2008) categorizes poverty into extreme poverty which is living less than US$ 1.25 per day and moderate poverty which is living less than US$ 2 per day. While, according to Indonesian Statistic Center, poverty defined as lack of economic ability to fulfill basic needs. So, poor people is the people who have average of monthly expenses below the poverty line (Statistics Indonesia, 2015).
increased to 28,513 million people which consists of urban poverty such as 10,619 million people and rural poverty such as 17,893 million people (Statistics Indonesia, 2016).
In Indonesia, rural poverty mostly happens in the remote area. Many villages in Indonesia are located in remote area, such as mountainous area, remote islands, forestry area and border area. They lack of access to the capital city, so the income distribution is not equal. Inequality of income distribution makes unequal development. Development in some of rural area is very slow. It makes the people in those area hard to get out of vicious cycle. The poverty condition is difference among one provinces to another provinces in Indonesia (see table 1).
Based on the table 1 (Village Development Index in Kalimantan 2014), it showed that the Village Development Index in West Kalimantan (49.85) is in the second lowest part after North Kalimantan (42.63). With the percentage of underdeveloped village in West Kalimantan such as 50.58 percent, developing village 48.22 percent and developed village only 1.20 percent from the total 1,908 villages. The average of Village Development Index in Kalimantan such as 52.41. In average, Kalimantan Island is underdeveloped in infrastructure condition. It is one of the important thing that should be concern in sustainable development. The economic structure of Kalimantan which is dominated by mining commodities and agricultural commodities needs to improve the infrastructure condition to stimulate development in non-raw materials sectors.
Senujuh village categorized as underdeveloped village in West Kalimantan Province based on the Village Development Index 2014 by Ministry of National Development Planning. Senujuh village is located in Sejangkung Sub-district, Sambas Regency, West Kalimantan Province, Indonesia. Most of the villagers cooking by the fire woods. Drinking water source is from the rain fed. The 85% of Senujuh villagers are farmer and 15% are labor. Their income per capita among 15 •70 US$ per month. Otherwise, national income per capita in Indonesia is 3,650 US$ per year, which is around 340 US$ per month. It is indicate that the villagers in Senujuh village live under the poverty line (Huruswati, 2012).
This research topic is important for development of Indonesia rural area in the future. Poverty in the rural area must be eliminated because the society in rural area also have same right with the society in the big city of Indonesia. The income distribution must be equal so poverty can be reduce. This research leads to poverty which is located in the rural area of West Kalimantan, Indonesia. Hopefully with this research could help the government to further increase its attention in establishing self-sufficient villages in rural area in Indonesia. With the development in the rural areas, are expected to be in the rural communities can get out of the vicious circle of poverty.
DEFINITION OF POVERTY & TYPES OF POVERTY
needs. Poverty according Indonesia Statistical Center is an individual condition which has income per capita in month is not enough to fulfill a minimum basic needs. Minimum basic need is limit of expense per capita per month to fulfill food and non-food.
According to Todaro (2012), poverty can divided into two categories based on the characteristics, such as absolute poverty and relative poverty. While Sachs (2005) divided poverty into 3 classifications, such as extreme (absolute), moderate and relative. Poverty also divided based on the places, such as Rural Poverty and Urban Poverty. The characteristics of poverty in Rural area and Urban area will be have some differences. Perhaps the most valid generalizations about the poor are that they are disproportionately located in rural areas, that they are primarily engaged in agricultural and associated activities, that they are more likely to be women and children than adult males, and that they are often concentrated among minority ethnic groups and indigenous peoples. Data from a broad cross section of developing nations support these generalizations. We find, for example, that about two-thirds of the very poor scratch out their livelihood from subsistence agriculture either as small farmers or as low-paid farmworkers. Some of the remaining one-third are also located in rural areas but engaged in petty services, and others are located on the fringes and in marginal areas of urban centers, where they engage in various forms of self-employment such as street hawking, trading, petty services, and small-scale commerce.
POVERTY MEASUREMENT
Poverty measurement in every countries is different. It based on the standard of living and the poverty line in each country. But in general, according to Aline Coudouel (2002), there are three requirement in measure the poverty level such as:
1. Choose the relevant dimension and indicator of well-being. 2. Select a poverty line in order to classify household as poor or not.
3. Select a poverty measure that will used for reporting whether poverty in population as a whole or population subgroup only.
Indonesia Statistic Center measured the poverty based on the basic needs approach. With this approach, poverty is seen as an economic inability to meet the basic needs of food and non-food which is measured from the expenditure side. So the Poor is the population had an average monthly per capita expenditure below the poverty line. Food poverty line is the value of basic food consumption expenditure is equivalent to 2.100 kcal energy per capita per day. Non-food poverty line is the amount of money to meets the minimum needs of non-food items such as education, health, transportation, etc.
Income is a key concept in almost all definitions and studies of poverty; however,
income is an extremely difficult concept to define and measure/ Uhe term is sometimes
used loosely to refer only to the main component of monetary income for most households
•that is, wages and salaries or business income. Others use the term more widely to include all receipts including lump-sum receipts and receipts that draw on the households capital/
1. income should include only receipts that are recurrent (that is, exclude large and unexpected, typically one-off, receipts);
2. income should only include those components that contribute to current economic well-being, or extend also to those that contribute to future well-being;
3. If the measure of income should allow for the maintenance of the value of net worth (Canberra Group (2001) in (Pantazis, et al., 2006)).
METHODOLOGY
The study area of this research is located in Senujuh Village. Senujuh village is one of the 12 village in Sejangkung Subdistrict. Sejangkung subdistrict is located in Sambas Regency, West Kalimantan Province, Indonesia. In Senujuh village has 4 RT (Rukun Tetangga) which consist of 352 households.
Purposive Sampling is used for choose the study area and Stratified Random Sampling is used in determining sample size from the village. In this research, researcher apply the standard of error in collecting sample such amount 10%. Based on the data above, so the number of sample size that will used in this research can be known by this following calculation:
ðÅ ë
ôÂëÌíÍõ
ðÅ ö÷õ ôÂö÷õÌóS ôÍõ
ðÅ øøS ù With: n = sample size
N = Number of Population e = Standard of error (10%)
Based on the calculation of sample size by Slovin Formula above, so researcher use 80 Household to be used as respondents.
Variables that used in this study are poverty level that identified by the income level, ratio scale as the measurement, education level, family member, working days, age of head household and loan. The primary data of research variables will be carried out by questionnaire and interviews. The data will analyzed with descriptive statistics.
RESULT AND DISCUSSION
Descriptive Statistics
Monthly Income
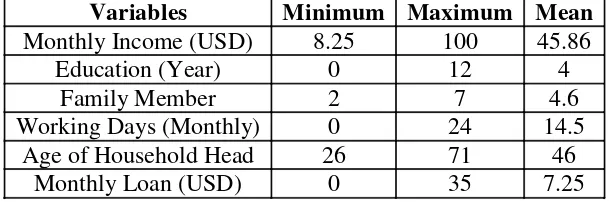
Based on the table (4.1) above, it shows that the minimum income per month is 8,25 USD, the maximum income per month is 100 USD and the average income per month in Senujuh village is 45.86 USD. Based on the survey results, 53.8% head of household had income between 25 USD•50 USD, 16.2% had income between 50 USD•75 USD, while 15% had income below 25 USD per month and another 15% had income more than 75 USD per month.
Education Level
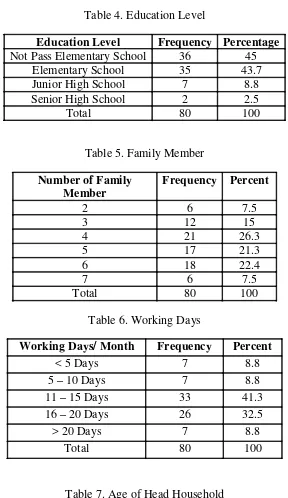
In Senujuh village, based on the survey results, the minimum year of education head of household in this village is zero. It means, they are not pursued the basic education. The maximum education level head of household in Senujuh village is 12 years education (senior high school) while the average is only 4 years education (elementary school) (see table 4.1). Regarding to the data collection in Senujuh Village on March 2016, most of the head of household were not well educated. Based on the table above, 45% head of household did not pass elementary school or did not have any education background. While, 43.7% head of household have primary school background (6 years study), 8.8% have junior high school background (9 years study) and only 2.5% which have senior high school background (12 years study).
Family Member
Based on the results in table 4.1 (Descriptive Statistics), it shown that the minimum family member in Senujuh village was 2 persons, the highest number of family member was 7 persons and the average number of family members was 4 • 5 persons in one household. Based on field survey results, 26.3% household had 4 family members in their household, 22.4% household had 6 family members, 21.3% household had 5 family members. Then, 15% household in Senujuh village had 3 family members, 7.5% had only 2 family members which is the smallest household in this village and 7.5% household had was the biggest household with 7 family members.
Working Days
The second biggest percentage of working days in this study was 32.5% head of household worked for 16•20 days per month. Mostly, head of household who had working days in this category worked as labor in rubber plantation and also farmer who did an extra jobs. Then, number of working days below 5 days, 5•10 days and more than 20 days had the same percentage which was 8.8% of head of household.
Age of Head Household
From the results shown in table 4.1 (Descriptive Statistics), the youngest head of household in this village was 26 years old and the oldest was 71 years old. While, the average head of household was 46 years old. Based on the survey results, age of head household where categorized into groups. The categorization showed that 38.8% head of household were in between 30•40 years old. Then, 23.7% head of household were in between 51•60 years old, 17.5% in between 41- 50 years old, 13.8% in between 61 • 70 years old. While, the youngest head of household which under 30 years old only 3.7% and another 2.5% head of household in Senujuh village were elderly people which more than 70 years old.
Loan
The last variable in this study is monthly loan that taken by head of household. The minimum amount of loan was 0 USD, it means some of the household did not took any loan. The maximum amount of loan was 35 USD and the average amount of loan was 7.25 USD. Based on the survey results, it shown that 31.3% household in Senujuh village did not had any loan. They did not took any loan because of they did not have capability to pay back the loan and another reason is they did not need any loan. Around 25% household had loan below 5 USD, it used to daily consumption and borrowed from family or neighbor. Then, 21.3% household had loan in range 5• 10 USD. Mostly, they took this amount of loan for daily needs and unconditional needs. 8.7% household had loan in between 20•25 USD, they used the money for make small store or constructed their house. 5% household had loan in between 10•15 USD for their daily needs or education needs. While, household which had loan in between 15•20 USD were only 3.7% and loan in between 25 -30 USD and more than 30 USD were only same 2.5% of household.
DISCUSSION
Poverty Condition in Senujuh Village
people, consist of 661 male and 671 female. There are 352 households in Senujuh Village. In Senujuh village only have one Elementary School, it does not have Junior High School and Senior High School. In this village have two small mosque. The distance to the nearest hospital is more than 23 kilometers and in the village also does not have Primary Health Center.
Poverty in West Kalimantan province were spreading in urban and rural area. In September 2015 until March 2016 the percentage of poor in rural area still bigger such as 303,060 people than in urban area such as 78,290 people. Poverty line of West Kalimantan in 2014 was 298,212 rupiahs per capita per month (22.51 USD) and in 2015 was 334,575 rupiahs per capita per month (25.25 USD). In March 2016, poverty line of West Kalimantan was increased to 347,880 rupiahs per capita per month (26.26 USD). Poverty line in West Kalimantan is the lowest poverty line compared with 4 others province in Kalimantan. While, in the percentage of poor people, West Kalimantan was the highest percentage with 381,350 people (7.87 percent). The highest poverty line in March 2016 was North Kalimantan such amount 513,614 rupiahs per capita per month (38.7 USD) (Indonesia Statistics West Kalimantan, 2016)
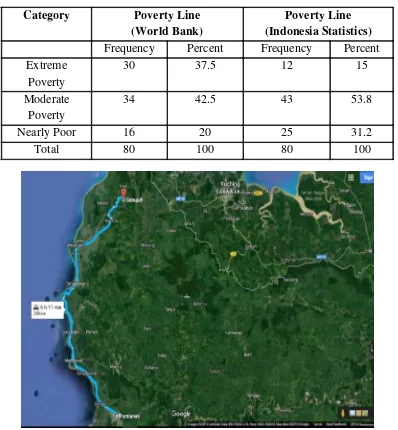
From the result of field surveys it shows the condition of household poverty in Senujuh Village, Sambas Regency, West Kalimantan Province. Based on the monthly income of head household, we categorized the household into 3 poverty category, such as extreme poverty, moderate poverty and nearly poor. There are two basic poverty line which used to categorized household into poverty category such as World Bank poverty line and Indonesia Statistics poverty line. World Bank categorizes poverty into extreme poverty which is living less than US$ 1.25 per day and moderate poverty which is living less than US$ 2 per day. While, Indonesia statistics hada poverty line according to the each Province. The poverty line in West Kalimantan for March 2016 was US$ 26.26 per month. Based on the table 9 (Categories of Poverty in Senujuh Village), according to World Bank shows that 42.5% household lived in moderate poverty, 37.5% household lived as an extreme poverty and 20% household were in nearly poor condition. While, according to Indonesia statistics shows that 53.8% household lived in moderate poverty, 31.2% household lived in nearly poor condition and only 15% household that included into extreme poverty.
It becomes problem for the household that lead by elder people. They were not have good income from their activity, some of them cannot work anymore and only depend on subsidy from government and family. It was occurred because most of the head of household were not have high education level. So, when they were getting old they cannot do anything. More than 50% household in Senujuh village had loan in between 1 •10 USD per month. They will take loan to support their farm, small store or other type of small investments, but some of them also took loan to fulfill their basic needs. The people in this village will took loan based on their ability to pay back. Based on the data, most of the villagers take loans from the debt collector, family and leasing. There is no cooperative in Senujuh village or nearby the village.
CONCLUSION
In this paper we describe the condition of household poverty in rural area of West Kalimantan using a sample of 80 household in Senujuh Village. We then apply descriptive statistics to describe and categorized the household poverty.
Poverty in Senujuh village was still high. In total, 30% of population are living under the poverty line, around 105 household from 352 household still live in poor condition. Based on the results (see table 9), around 40 - 50% head of household in Senujuh Village categorized as moderate poverty which had income between 26.3 • 60 USD per month. Monthly income of household in this village in between 25•50 USD such as 53.8%. Small incentives that earn by the people make the working days affect their average income. More than 50% head of household in Senujuh village were not well educated. 45% head of household not passed elementary school and 43.7% were had elementary school degree or 6 years of education. Based on the results, 26.3% household had 4 family members. Only 7.5% household which had big number of family members such as 7 members. The number of working days in average is between 11 • 15 days per month. Around 41.3% head of household had working days in between 11 • 15 days per month. Mostly, their work as a labor in Palm Tree Plantation. Age of head household in Senujuh village around 38.8% in between 30 •40 years old. While, 2.5% head of household were above 70 years old or in elderly phase. Household in Senujuh village had which had loan in between 1 • 10 USD were about 46.3%. 2.5% household had loan more than 30 USD. While, 31.3% household did not have any loan.
However, this study has put fourth several suggestions for development in Senujuh village:
1. People need to increase the number of working days to increase their average income. Government should do intervention to factory to increase the number of working days. 2. Government should provide good infrastructure and service of education in this village
or village nearby.
4. Government should make development program to reduce the poverty in this village, especially related to the agriculture and fishery.
5. For the further researches, research area may be longer and have a wider sample, can include macroeconomics factors that may contribute to reduction of poverty rate.
REFERENCES
Aniceto C. Orbeta, J. (2005). Poverty, Vulnerability and Family Size: Evidence from the Philippines.ADB Institute Research Paper SeriesNo. 68, 7.
Badan Perencanaan Pembangunan Nasional. (2014). Rencana Pembangunan Jangka Menengah Nasional 2015-2019. Jakarta: Bappenas.
Gujarati, D. N. (2003).Basic Econometrics Fourth Edition. New York: McGraw-Hill/irwin.
Hayati, A. (2012).Analisis Resiko Kemiskinan Rumah Tangga di Provinsi Banten. Jakarta: Fakultas Ekonomi, Magister Perencanaan dan Kebijakan Publik, Universitas Indonesia.
Huruswati, I. (2012). Evaluasi Program Pembangunan Kesejahteraan Sosial Di Desa Perbatasan Kalimantan Barat. Jakarta: P3KS Press.
Indonesia Statistics West Kalimantan. (2016). Tingkat Kemiskinan Provinsi Kalimantan Barat Maret 2016. Pontianak: Indonesia Statistics of West Kalimantan Province.
Nachrowi, N. D., & Usman, H. (2006). Pendekatan Populer dan Praktis Ekonometrika Untuk Analisis Ekonomi dan Keuangan.Jakarta: LPFE Universitas Indonesia.
O'Loughlin, D. (2006). Credit Consumption and Debt Accumulation Among Low-Income COnsumers: key consequences and intervention strategies.Combat Poverty Agency, Working Paper Series06/03, 1-62.
Pantazis, C., Gordon, D., & Levitas, R. (2006). Poverty and Social Exclusion in Britain. Bristol: The Policy Press.
Pressman, S., & Scott, R. H. (2010). Consumer Debt and Poverty Measurement. Focus
Vol.27, No.1, 9-12.
Rumbewas, S. (2005). Poverty in Three Villages in Papua. New Zealand: Massey University.
Sachs, J. D. (2005).The End of Poverty. New York: The Penguin Press.
Setiawan, A. H. (2011). Perekonomian Indonesia. Semarang: Badan Penerbit Universitas Diponegoro.
Statistics Indonesia. (2015, November 07). Badan Pusat Statistic. Dipetik November 07, 2015, dari bps.go.id: www.bps.go.id/Subjek/view/id/23#subjekViewTab1| accordion-daftar-subjek1
Statistics Indonesia. (2016, August 26). Number of Poor People by Province, 2013-2016.
Diambil kembali dari Statistics Indonesia:
https://www.bps.go.id/linkTableDinamis/view/id/1119
Todaro, M. P., & Smith, S. C. (2012). Economic Development 11th Edition. United States of America: Addison-Wesley.
UNDP. (2016, January 28). Human Development Report. Diambil kembali dari United Nations Development Programme: http://hdr.undp.org/en/content/multidimensional-poverty-index-mpi
Wijanarko, V. (2013). Faktor - Faktor yang Mempengaruhi Kemiskinan di Kecamatan Jelbuk, Kabupaten Jember. Jember: Fakultas Ekonomi, Universitas Jember.
World Bank. (2008, September 16).Press Release: New Data Show 1.4 Billion Live On Less Than US$1.25 A Day, But Progress Against Poverty Remains Strong. Dipetik November 10, 2015, dari The World Bank: www.worldbannk.org/en/news/press-
release/2008/09/16/new-data-show-14-billion-live-less-us125-day-progress-against-poverty-remains-strong
APPENDICES
Table 1. Village Development Index in Kalimantan 2014
Province VDI 2014
Village Percentage according to Village Typology
Number of Villages Underdeveloped Developing Developed
West Kalimantan 49.85 50.58 48.22 1.20 1.908
Central Kalimantan 51.32 40.86 58.44 0.70 1.434
South Kalimantan 56.44 20.92 78.17 0.91 1.864
East Kalimantan 56.37 23.17 74.31 2.52 833
North Kalimantan 42.63 71.14 28.19 0.67 447
Kalimantan 52.41 37.80 61.50 1.15 6.486
Source: Indonesia Statistics & Ministry of National Development Planning (2014) Table 2. Descriptive Statistics
Variables Minimum Maximum Mean
Monthly Income (USD) 8.25 100 45.86
Education (Year) 0 12 4
Family Member 2 7 4.6
Working Days (Monthly) 0 24 14.5
Age of Household Head 26 71 46
Monthly Loan (USD) 0 35 7.25
Table 3. Monthly Income
Range of Income Frequency Percent
< 25 USD 12 15
25 USD•50 USD 43 53.8
50 USD•75 USD 13 16.2
> 75 USD 12 15
Table 4. Education Level
Education Level Frequency Percentage
Not Pass Elementary School 36 45
Elementary School 35 43.7
Junior High School 7 8.8
Senior High School 2 2.5
Total 80 100
Table 5. Family Member
Number of Family Member
Frequency Percent
2 6 7.5
3 12 15
4 21 26.3
5 17 21.3
6 18 22.4
7 6 7.5
Total 80 100
Table 6. Working Days
Working Days/ Month Frequency Percent
< 5 Days 7 8.8
5•10 Days 7 8.8
11•15 Days 33 41.3
16•20 Days 26 32.5
> 20 Days 7 8.8
Total 80 100
Table 7. Age of Head Household
Age of Head Household Frequency Percent
< 30 3 3.7
30•40 31 38.8
41•50 14 17.5
51•60 19 23.7
61•70 11 13.8
> 70 2 2.5
Table 8. Loan
Amount of Loan Frequency Percent
No Loan 25 31.3
< 5 USD 20 25
5 USD•10 USD 17 21.3
10 USD•15 USD 4 5
15 USD•20 USD 3 3.7
20 USD•25 USD 7 8.7
25 USD•30 USD 2 2.5
> 30 USD 2 2.5
Total 80 100
Table 9 Categories of Poverty in Senujuh Village
Category Poverty Line (World Bank)
Poverty Line (Indonesia Statistics)
Frequency Percent Frequency Percent
Extreme Poverty
30 37.5 12 15
Moderate Poverty
34 42.5 43 53.8
Nearly Poor 16 20 25 31.2
Total 80 100 80 100