Correspondence:
Vita Muniarti Tarawan, Department of Physiology, Faculty of Medicine, Universitas Padjadjaran Jl. Raya Bandung-Sumedang KM 21 Jatinangor e-mail: [email protected]
Osteoporosis Risk and Body Mass Index Comparison among Urban and
Rural Menopausal Women
Abstract Objective: To compare osteoporosis risk factors between urban and rural menopausal women.
Methods: This study applied the causal-comparative analysis to compare osteoporosis risk factors between urban and rural menopausal women. The subjects included in this study were 40 urban and 40 rural menopausal women who were randomly recruited. The respondents’ bone mass density was measured using densitometry. This study also examined several aspects, including the respondents’ nutritional status (body mass index calculation)
and physical fitness (VO2 max). The correlation between osteoporosis risk
and either nutritional status or physical fitness among urban and rural
menopausal women were tested using Chi square correlation analysis.
Results: This study examined several aspects, including age (years) 58.7±6.1 (urban) and 58.3±6.5 (rural), p=0.815, body mass index (kg/m2) 23.7±3.7
(urban) and 22.7±3.6 (rural), p=0.221, VO2 max (average) 27 (67.5%)
(urban) and 25 (62.5%) (rural), p=0.624. The respondents diagnosed as suffering from osteoporosis were statistically measured for the: nutritional status (body mass index) (under) urban 0%, rural (p=0.789) 2.5%, body mass
index 7.5% urban, rural (p=0.571) 2.5%, physical fitness condition (VO2 max)
(average) urban 7.5%, rural (p=0.850) 5%, VO2 max (poor) urban 7.5%, rural
(p=0.880) 5%. Body mass index and bone mass density calculation results described that the nutritional status of urban and rural menopausal women: normal 12 (30%) vs (32.5%), osteopenia 8 (20%) vs (15%), osteoporosis 3 (7.5%) vs (2.5), p=0.571.
Conclusions: This study shows that there is no significant difference between
osteoporosis risk and nutritional status and physical fitness in urban and
rural menopausal women.
Keywords: Nutritional status, osteoporosis level, physical fitness
IJIHS. 2015;3(1):14–20
Vita Muniarti Tarawan,1 Putri Fatima Adnantami,2 Putra Habibie Adnantama,2 Putra Haqiqie
Adnantama2
1Department of Physiology, Faculty of Medicine, Universitas Padjadjaran
2Faculty of Medicine, Universitas Padjadjaran-Dr. Hasan Sadikin General Hospital
Introduction
Menopause refers to a natural biological ageing symptom found in elderly women which is characterized by a permanent menstruation cessation due to the loss of ovarian follicle function. Other multiple organ dysfunctions and physical changes in menopausal women inhibit gonadotropin stimulation, leading to osteoporosis and climacterium syndrome. In
elderly women over 79 years, the reduction in steroid hormone production is one of the major factors causing osteoporosis.1
Women entering the perimenopausal or postmenopausal periods have to consume sufficient nutrients. The risk for experiencing bone fracture will increase if the nutrition intake is inadequate, indicating low calcium and vitamin D intakes. Flavonoids are bioactive polyphenols found particularly in fruit and vegetables. However, little is known about their roles in bone health in human; some fruits and vegetables contain potassium and magnesium.2 The nutrients that are associated with bone mass density (BMD) are beneficial Received:
July 23, 2014
Revised:
October 11, 2014
to perimenopausal women and elderly men and women. The benefits include preventing bone loss in elderly men.3 Other ways to maintain bone health from osteopenia and to enhance bone mass include adequate calcium and vitamin D supplements consumption and regular exercises.3,4 Vitamin D supplements reduce osteoporosis risks and enhance bone mass in healthy women; however, it can also create kidney stone risk.3−5
This study compares the osteoporosis risk factors between urban and rural menopausal women. Urban women are women who live in cities while rural women live in remote areas. Bone mass density measurements were performed to analyze bone fracture by using densitometry.
Women with osteoporosis and osteopenia should practice regular exercises even if there is only tentative census available on the type and optimal terms for those who are suffering from low BMD or having BMD risk factors, such as poor balance, decreased muscle strength, and diminished agility.6,7 The primary efforts to prevent osteoporosis are doing exercises and managing encouragements.7,8
Several studies have reported soy food as the type of food that can enhance bone mass and inhibit hypoestrogenic effect.9,10 Significant phytoestrogen diet will increase bone mass
in postmenopausal women who suffer from osteoporosis.10 People recognize a variety of healthy foods, including yellow-green colored vegetables, mushrooms, fish, scallops, and fruits may influence BMD, while tallow, meat and oil have the opposite effect.9−11
In order to socialize menopause risk factors, this study aimed to analyze the differences between risk proportion of osteoporosis and the nutritional status as well as the physical activity (physical fitness) in urban and rural menopausal women.
Methods
This study applied the comparative analysis method which aims to examine osteoporosis risk in relation with nutritional status (i.e. body mass index calculation) and physical activity (physical fitness/VO2 max) in both urban and rural menopausal women. The respondents who met the inclusion criteria were those who had never been given hormone replacement therapy, have never experienced any accidental bone fracture, and been given artificial menopause treatment.
The Rule of Thumb approach and sampling method are used in this study in order to recruit potential respondents. The number
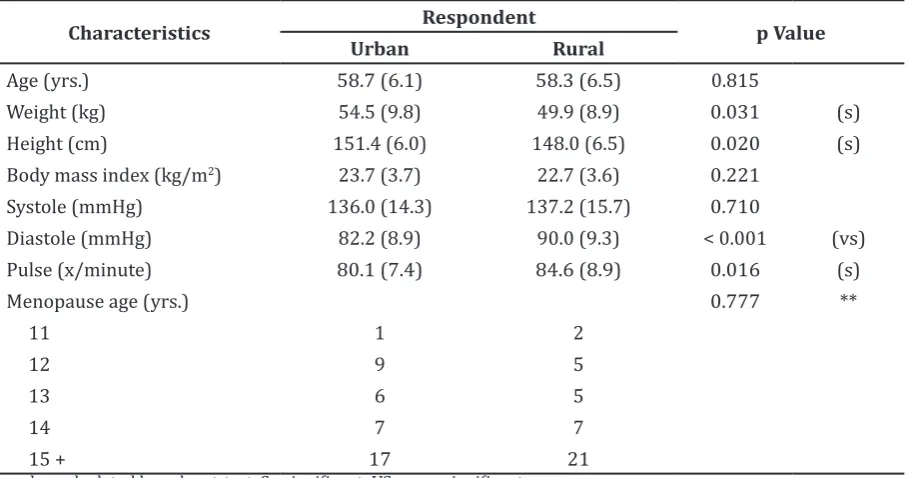
Table 1 Respondent Characteristics
Characteristics Respondent p Value
Urban Rural
Age (yrs.) 58.7 (6.1) 58.3 (6.5) 0.815
Weight (kg) 54.5 (9.8) 49.9 (8.9) 0.031 (s)
Height (cm) 151.4 (6.0) 148.0 (6.5) 0.020 (s)
Body mass index (kg/m2) 23.7 (3.7) 22.7 (3.6) 0.221
Systole (mmHg) 136.0 (14.3) 137.2 (15.7) 0.710
Diastole (mmHg) 82.2 (8.9) 90.0 (9.3) < 0.001 (vs)
Pulse (x/minute) 80.1 (7.4) 84.6 (8.9) 0.016 (s)
Menopause age (yrs.) 0.777 **
11 1 2
12 9 5
13 6 5
of respondents recruited was eighty. These respondents were recruited randomly and by considering the Rule of Thumb approach based on three variables, bone mass density, body mass index, and physical fitness (VO2 max). The respondents involved in this study were 40 urban and 40 rural menopausal women. The rural menopausal women who were involved in this study live in Lembang, West Java, Indonesia.
Two types of variables were studied in this study: independent variables (nutritional status and physical fitness) and dependent variables (osteoporosis risk related to the bone mass density test). The respondents bone mass density, nutritional status, and physical fitness were tested. The equipment
used to measure the respondents bone mass density includes densitometry, a dual-energy X-ray absorptiometry. The nutritional status of the respondents was measured using body mass index calculation. Then, the respondents’ physical fitness was obtained by conducting aerobic trainings and measuring the VO2 max. The respondents VO2 max was measured using the Astrand-Rhyming nomogram. The nomogram was analyzed by using Pearson’s chi-squared test to measure the osteoporosis risk proportion toward nutritional status and physical activity (physical fitness) in urban and rural menopausal women and T-test was used to measure the quantitative average data differences using SPSS 13.0. P value of < 0.05 was considered statistically significant.
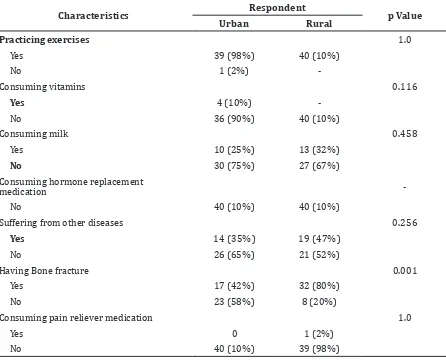
Table 2 Other Related Respondent Characteristics
Characteristics Respondent p Value
Urban Rural
Practicing exercises 1.0
Yes 39 (98%) 40 (10%)
No 1 (2%)
-Consuming vitamins 0.116
Yes 4 (10%)
No 36 (90%) 40 (10%)
Consuming milk 0.458
Yes 10 (25%) 13 (32%)
No 30 (75%) 27 (67%)
Consuming hormone replacement
medication
No 40 (10%) 40 (10%)
Suffering from other diseases 0.256
Yes 14 (35%) 19 (47%)
No 26 (65%) 21 (52%)
Having Bone fracture 0.001
Yes 17 (42%) 32 (80%)
No 23 (58%) 8 (20%)
Consuming pain reliever medication 1.0
Yes 0 1 (2%)
Table 3 Respondent Body Mass Index, Bone Mass Density, and VO2 max
Variable Respondent p Value
Urban Rural
Body mass index
Under 4 (10%) 9 (23%) 0.408
Normal 23 (58%) 20 (50%)
Over 12 (30%) 9 (22%)
Obesity 1 (2%) 2 (5%)
Bone Mass Density
Normal 21 (53%) 21 (53%) 0.891
Osteopenia 16 (40%) 17 (42%)
Osteoporosis 3 (7%) 2 (5%)
VO2 max
Very good 2 (5%) 5 (12%) 0.624
Good 2 (5%) 2 (5%)
Average 27 (68%) 25 (63%)
Poor 9 (22%) 7 (18%)
Very poor - 1 (2%)
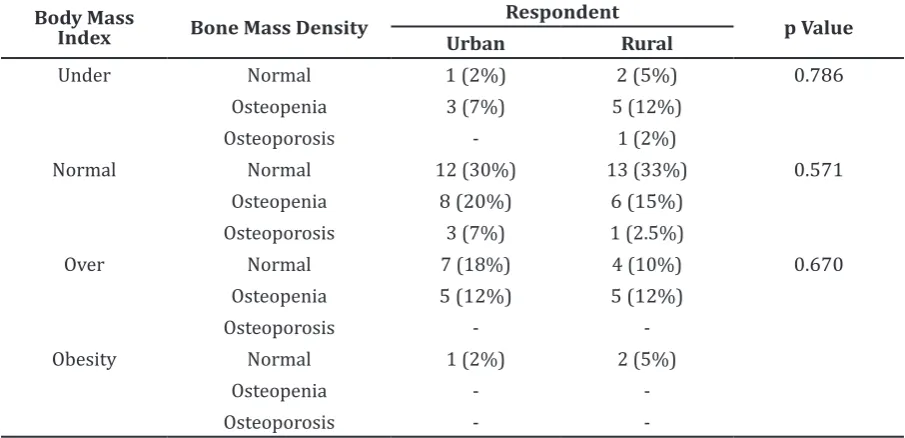
Table 4 Respondent Body Mass Index and Bone Mass Density (Osteoporosis Risk)
Body Mass
Index Bone Mass Density
Respondent
p Value
Urban Rural
Under Normal 1 (2%) 2 (5%) 0.786
Osteopenia 3 (7%) 5 (12%)
Osteoporosis - 1 (2%)
Normal Normal 12 (30%) 13 (33%) 0.571
Osteopenia 8 (20%) 6 (15%)
Osteoporosis 3 (7%) 1 (2.5%)
Over Normal 7 (18%) 4 (10%) 0.670
Osteopenia 5 (12%) 5 (12%)
Osteoporosis -
-Obesity Normal 1 (2%) 2 (5%)
Osteopenia -
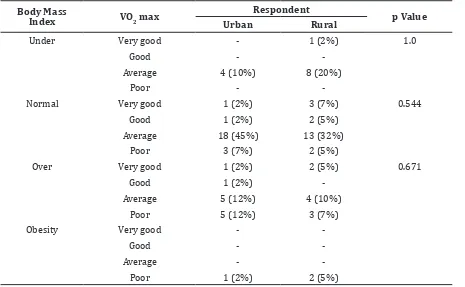
-Table 5 Respondent Body Mass Index and VO2 max
Body Mass
Index VO2 max
Respondent
p Value
Urban Rural
Under Very good - 1 (2%) 1.0
Good -
-Average 4 (10%) 8 (20%)
Poor -
-Normal Very good 1 (2%) 3 (7%) 0.544
Good 1 (2%) 2 (5%)
Average 18 (45%) 13 (32%)
Poor 3 (7%) 2 (5%)
Over Very good 1 (2%) 2 (5%) 0.671
Good 1 (2%)
-Average 5 (12%) 4 (10%)
Poor 5 (12%) 3 (7%)
Obesity Very good -
-Good -
-Average -
-Poor 1 (2%) 2 (5%)
Results
The respondents who were involved in this study were both urban and rural menopausal women. The respondents were tested for their bone mass density, body mass index, and VO2 max. The respondents were interviewed about their habits of exercise as well as their vitamin, milk, hormone enhancer, and also painkiller consumptions using a questionnaire(Table 1).
Urban menopausal women average weight and height calculations were higher than rural menopausal women. The average body mass index did not show any significant relation. On the contrary, the average diastolic blood pressures and pulses were higher among rural menopausal women.
Exercise habit and vitamin, milk, hormone replacement medication, and also painkiller consumptions did not show any statistically significant relation between urban and rural menopausal women (Table 2). The percentage of bone fracture occured in rural menopausal women was higher (80%) than those who live
in urban areas (42%).
Bone mass density, body mass index, and VO2 max did not present any significant difference between urban and rural menopausal women (Table 3). Urban menopausal women body mass index was higher which was contrast with the rural menopausal women’s body mass index whose VO2 max was higher.
Osteoporosis risk, residential geographic location, and body mass index were analyzed to measure the average values. There was no statistically considerable relation, between the osteoporosis risk and body mass index in both urban and rural menopausal women (Table 4).
significant value (p>0.05).
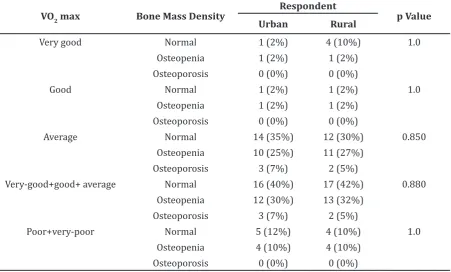
Respondent physical fitness, osteoporosis risk, and residence are presented (Table 6). The osteoporosis risk and physical fitness of the respondents did not show any significant value (p>0.05).
Discussion
This study is a correlational analysis study to assess the correlation between osteoporosis risk proportion and nutritional status and also the physical fitness. There was no significant correlation found between the osteoporosis risk and nutritional status in rural menopausal woman because they drink adequate amount of milk. In contrary, the nutritional status in urban menopausal women was better because they consume healthy foods and drink milk.
In elderly women whose age are over 50 years, the ability of the intestinal wall to absorb calcium is weaker. This decrease in calcium
important to maintain celullar activity. The loss of bone mass phase in elderly woman is a natural ageing process. The decreased renal calcium reabsorption and intestinal calcium absorption enhance the excretion of calcium in urine.1
In this study, the correlation between the risk for osteoporosis and the physical fitness was analyzed (Table 6). The rural menopausal women spend more time in farmlands as their routine physical activities. Meanwhile, urban menopausal women only do daily houseworks, such as washing dishes, sweeping, cooking, and exercising. The data determine that the urban and rural menopausal women physical activities are at the same level; therefore, it is expected that their physical fitness is not significantly different.
There was no significant relation between osteoporosis risk and body mass index in both urban and rural menopausal women. There was also insignificant relation between osteoporosis risk and physical fitness (VO Table 6 Respondent VO2 max, Osteoporosis Risk, and Residential Geographic Location
VO2 max Bone Mass Density
Respondent
p Value
Urban Rural
Very good Normal 1 (2%) 4 (10%) 1.0
Osteopenia 1 (2%) 1 (2%)
Osteoporosis 0 (0%) 0 (0%)
Good Normal 1 (2%) 1 (2%) 1.0
Osteopenia 1 (2%) 1 (2%)
Osteoporosis 0 (0%) 0 (0%)
Average Normal 14 (35%) 12 (30%) 0.850
Osteopenia 10 (25%) 11 (27%)
Osteoporosis 3 (7%) 2 (5%)
Very-good+good+ average Normal 16 (40%) 17 (42%) 0.880
Osteopenia 12 (30%) 13 (32%)
Osteoporosis 3 (7%) 2 (5%)
Poor+very-poor Normal 5 (12%) 4 (10%) 1.0
Osteopenia 4 (10%) 4 (10%)
References
1. Speroff L, Glass RH, Kase NG. Menopause and the perimenopausal transition in clinical gynecologic endocrinology and infertily. 6th ed.
London: Lipincott William & Wilkins; 1999. p. 643–724.
2. Hardcastle AC, Aucott L, Reid DM, Macdonald
HM. Associations between dietary flavonoid
intakes and bone health in a Scottish population. J Bone Miner Res. 2011;26(5):941–7.
3. Macdonald HM, New SA, Golden MHN, Campbell MK, Reid DM. Nutritional associations with bone loss during the menopausal transition:
evidence of a beneficial effect of calcium,
alcohol, and fruit and vegetable nutrients and of a detrimental effect of fatty acids. Am J Clin Nutr. 2004;79:155–65.
4. Engelke K, Kemmler W, Lauber D, Beeskow C, Pintag R, Kalender WA. Exercise maintains
bone density at spine and hip EFOPS: a 3-year
longitudinal study in early postmenopausal
women. Osteoporos Int. 2006;17(1):133–42.
5. Ishikawa S, Kim Y, Kang M, Morgan DW. Effect of weight-bearing exercise on bone health in girls: a meta-analysis. Sports Med. 2013;43(9):875– 92.
6. Wayne PM, Kiel DP, Krebs DE, Davis RB, Savetsky-German J, Connelly M, et al. The
Effects of tai chi on bone mineral density in postmenopausal women: a systematic review.
Arch Phys Med Rehabil. 2007;88(5):673–80. 7. Mayoux-Benhamou MA, Roux C, Perraud A,
Fermanian J, Rahali-Kachlouf H, Revel M. Predictors of compliance with a home-based exercise program added to usual medical care in preventing postmenopausal osteoporosis:
an 18-month prospective study. Osteoporos
Int. 2005;16(3):325–31.
8. Jackson RD, LaCroix AZ, Gass M, Wallace RB, Robbins J, Lewis CE, et al. Calcium plus vitamin
D supplementation and the risk of fractures. N Engl J Med 2006;354(7):669–83.
9. Wu X, Cai H, Gao YT, Dai Q, Li H, Cai Q, et al. Correlations of urinary phytoestrogen
excretion with lifestyle factors and dietary intakes among middle-aged and elderly Chinese women. Int J Mol Epidemiol Genet. 2012;3(1):18–29.
10. Setchell KD, Lydeking-Olsen E. Dietary phytoestrogens and their effect on bone: evidence from in vitro and in vivo human observational and dietary intervention studies. Am J Clin Nutr. 2003;78(3 Suppl):S593–609. 11. Okubo H, Sasaki S, Horiguchi H, Oguma E,
Miyamoto K, Hosoi Y, et al. Dietary patterns