Evidence from a Conditional Food
Supplementation Program
Marian Meller
Stephan Litschig
Meller and Litschigabstract
This paper evaluates the impact of a conditional food supplementation program on child mortality in Ecuador. The program (PANN 2000) was implemented by regular staff at local public health posts and consisted of offering free micronutrient- fortifi ed food for children aged 6–24 months in exchange for routine health checkups. Our regression discontinuity design exploits the fact that the program was initially running only in the poorest communities of certain provinces. We fi nd that its presence reduced child mortality in cohorts with eight months of differential exposure from a level of about 2.5 percent by 1 to 1.5 percentage points.
I. Introduction
Many governments in developing countries implement programs that aim to address nutritional failures in early childhood, raise survival rates, and
im-Marian Meller is a research fellow in economics at Universitat Pompeu Fabra. Stephan Litschig is a post-doctoral researcher at the Institut d’Anàlisi Econòmica-CSIC and affi liated professor with the Barcelona GSE. An earlier version of this paper was entitled “Saving Lives: Evidence from a Nutrition Program in Ecuador.” The authors are grateful to César Carranza, Vicente Chauvin, Silvia Chávez, Germán Flores, Eulalia Maliza, Arturo Noroña, and Mayra Pérez for providing background information on the PANN 2000 program, as well as to Antonio Ciccone, Gabrielle Fack, Irma Clots- Figueras, Albrecht Glitz, Libertad González, Gianmarco León, Hannes Müller, Dina Pomeranz, Prakarsh Singh and Alessandro Tarozzi for helpful comments and advice. The authors also received useful feedback from seminar audiences at UPF and NEUDC Dartmouth. The views expressed in this paper are those of the authors and not necessar-ily those of the Ministry of Public Health of Ecuador. Litschig acknowledges fi nancial support from the Spanish Ministry of Economy and Competitiveness, through the Severo Ochoa Programme for Centres of Excellence in R&D (SEV-2011-0075). The data used in this article can be obtained beginning May 2015 through April 2018 from Stephan Litschig, Institut d’Anàlisi Econòmica-CSIC, Campus UAB-08193 Bel-laterra. Barcelona (Spain), stephan.litschig@iae.csic.es.
[Submitted July 2013; accepted November 2013]
ISSN 0022-166X E- ISSN 1548-8004 © 2014 by the Board of Regents of the University of Wisconsin System
prove human capital formation.1 Recent metastudies conclude that there is convincing evidence, usually based on randomized trials, that specifi c interventions improve the nutritional status of children and save lives under clinical or “ideal” fi eld conditions (Bhutta et al. 2008; Ainsworth et al. 2010).2 For example, community- level effi cacy trials have consistently shown that Vitamin A supplementation reduces child mortal-ity across many different settings (Beaton et al. 1993; Mayo- Wilson et al. 2011).3 Effi cacy trials also provide evidence that complementary feeding interventions can improve growth and micronutrient status and may also reduce morbidity (Dewey and Adu- Afarwuah 2008).4 However, much less is known about the effectiveness of these interventions when conditions for both service delivery and recipient compliance are “routine,” as in typical scaled- up programs, rather than “ideal.”5 Moreover, we know little about the impact of complementary feeding interventions on child mortality, probably because existing studies were not powered to detect small—yet practically important—reductions in mortality.6
This paper provides evidence on the effectiveness of a conditional food supplemen-tation program in reducing child mortality in Ecuador. The Programa de Alimentación y Nutrición Nacional (PANN) 2000 was implemented by regular staff at local public health posts and consisted of offering a free micronutrient- fortifi ed food, Mi Papilla, for children aged 6–24 months in exchange for routine health checkups for the chil-dren.7 We address concerns about endogenous program placement by exploiting that at its inception in August 2000, the PANN 2000 was running for about eight months only in the poorest communities (parroquias)8 of certain provinces, as measured by a community- level consumption poverty index. Under a relatively weak—and to some extent testable—assumption, this assignment rule generated variation in program availability that was “as good as” random locally around the targeting cutoff of 89.05
1. The rationale for these programs is that child undernutrition is associated with increased mortality risk (Black et al. 2008), as well as impaired physical and cognitive development of those children who survive (Victora et al. 2008).
2. Under “ideal” conditions, researchers control both service delivery and compliance with the treatment by recipients. Under “routine” conditions, there is no researcher involvement whatsoever. “Best practice” condi-tions are an intermediary case. These distinccondi-tions are further discussed in Victora, Habicht, and Bryce (2004). 3. However, by far the largest Vitamin A supplementation trial on record, implemented through the Indian public health system, fi nds a small and statistically insignifi cant impact on child mortality (Awasthi et al. 2013).
4. Positive and substantial education impacts of a protein- and energy- fortifi cation intervention in Guatemala have been documented even three decades after it ended (Maluccio et al. 2009).
5. Recognizing the scant evidence on program effectiveness, many studies call for more research in this area. Dewey and Adu- Afarwuah (2008, p. 33) concludes that “The key challenge is how to implement high- quality programmes that are sustainable when delivered on a large scale.” Regarding key evidence gaps, Bhutta et al. (2008, p. 434) concludes that “Given the paucity of effectiveness data, strengthening of monitoring and rigor-ous assessment of large- scale nutrition programmes are imperative.” Similar calls for research on program effectiveness are made in Ainsworth et al. (2010), for example.
6. For example, to have a 90 percent chance of detecting a mortality reduction from 3 percent to 2 percent at 5 percent signifi cance would require a sample size of over 10,000. The vast majority of studies reviewed in Dewey and Adu- Afarwuah (2008) have sample sizes below 1,000.
7. Mi Papilla is designed to provide about 50 percent of required caloric intake; 100 percent of the require-ments of protein, iron, folic acid, and zinc; 60 percent of Vitamin C, the B vitamins, and magnesium; and 30 percent of Vitamin A, calcium, and phosphorus, in addition to other nutrients (Lutter et al. 2008).
percent poverty. We exploit this variation to estimate the effect of the program on child mortality at the community level as measured in the 2001 census using (sharp) regression discontinuity (RD) analysis. We interpret our estimates as intent- to- treat because we do not observe Mi Papilla uptake at the individual level in the census data.
The internal validity of our results hinges on the identifying assumption that com-munities had (at most) only imprecise control over the value of their poverty index. As long as this control was imprecise at best, treatment assignment was randomized around the cutoff (Lee and Lemieux 2010). This identifying assumption is highly plau-sible in our context as the poverty index was created several years before the PANN 2000 was announced. We also test an empirical implication of this assumption, that pretreatment observables should exhibit no discontinuity at the cutoff, which is equiv-alent to testing for balance at baseline in randomized designs. We fi nd no statistical evidence of discontinuities in important determinants of child mortality (Charmarbag-wala et al. 2004), such as household sanitation infrastructure (access to piped water, availability of toilets), mothers’ education, or pretreatment child mortality and health checkups at the community level.9 To our knowledge, there were no other programs at the time that used the same cutoff for targeting as the PANN 2000.
Our main result is that the presence of the program reduced child mortality in co-horts with eight months of differential exposure from a level of about 2.5 percent by one to 1.5 percentage points. The magnitude of this impact is plausible given what we know about program coverage—Mi Papilla was distributed to more than 80 percent of the target population according to program progress reports10—and based on results from effi cacy studies, showing that complementary feeding interventions can improve micronutrient status and may also reduce morbidity. Undernutrition is thought to ac-count for more than 50 percent of deaths of children aged 6–59 months worldwide (Pelletier et al. 1995):11 If the program improved the nutritional status in the target population suffi ciently, one would expect child mortality in the age range 6–24 months to fall approximately by half.12 Assuming an impact of –1 death per 100 children ex-posed to the PANN 2000, a coverage rate of 80 percent, an annual cost per benefi ciary
9. Another key determinant of child mortality is income, which in our analysis is proxied by the poverty index and is thus held constant by design at the cutoff. Two remaining important determinants of child mor-tality are unobserved in our study: the presence of younger siblings in the household and whether the child is vaccinated against diphtheria, tetanus, pertussis (DPT3), measles or polio, for example. The presence of younger siblings cannot bias our estimates because by necessity we focus on mortality of last- born children, as explained below. Vaccination rates were above 90 percent in 2001 according to both WHO- UNICEF and offi cial country estimates (World Health Organization 2013).
10. Because takeup or coverage was below 100 percent, the cohorts we consider had a potential differential exposure to the program of eight months. We usually omit this qualifi cation for expositional simplicity. 11. The estimate for Ecuador in Pelletier et al. (1995) is 32 percent. However, in our sample of parroquias that are all relatively poor and mostly from the Sierra region, the percentage of deaths attributable to the potentiating effects of malnutrition are likely higher. Black et al. (2008) attributes 35 percent of deaths from ages 0–59 months to undernutrition. Given the target population of Mi Papilla (6–24 months), the estimate by Pelletier and colleagues is more appropriate as a reference for our study.
of US$30, and a potential program exposure of eight months, the implied cost of a life saved amounts to about US$30 × 80 × 8/12 = US$1,600.13
We also use administrative data on the number of checkups at local health posts to investigate potential mechanisms for the mortality reduction. While we fi nd small and insignifi cant estimates on average, we do fi nd evidence of an increase in health check-ups in treatment communities of the Sierra region. The magnitude of the discontinuity implies that mothers added about 0.66 visits per month in program communities. This fi nding implies that the mortality reduction we document might be due to improved detection and treatment of common childhood illnesses, such as diarrhea and acute respiratory infection, in addition to a reduced case fatality rate due to improved nutri-tion. While the program design does not allow us to separate whether the food supple-ment or the health checkups drive the mortality reduction, the design does enable us to rule out the infl uence of other common additional program components such as nutrition information and education, which were phased in only at a later stage. Similarly, cash transfers were never part of the PANN 2000 even though the in- kind transfer might have freed up some income to spend on other relevant inputs into child health such as medicines or fuel to boil water.14
We corroborate our results on child mortality reduction in a number of ways. First, we present results on mortality for cohorts that were already too old to be eligible for the program when it started in August 2000. As expected for a program targeted based on age, impact estimates for these cohorts are essentially zero and insignifi cant, even though the confi dence intervals often do not rule out meaningful effects. Second, we estimate the impact on mortality for a broader set of cohorts that were differen-tially exposed to the program for a shorter period—at least one month rather than a full eight months as in our main specifi cation—and fi nd effects that are smaller in magnitude but still consistently negative, which further adds to the plausibility of our results. Third, we test whether there is a jump in mortality rates across communities at the program cutoff in provinces where the PANN 2000 had not been implemented yet and again fi nd no statistical evidence of an effect. Fourth, we test for jumps in mortal-ity rates at the program cutoff in 1990 (before the PANN 2000 implementation) and in 2010 (after the program had been scaled up to the entire country) and again fi nd no statistical evidence of an effect.
The most closely related study to ours by Lutter et al. (2008) also evaluates the PANN 2000—without examining its impact on child mortality—using health cen-ters in one district that initiated the program in May 2002 as the treatment group and neighboring communities, where the program was scheduled to be initiated one year later, as the comparison group. At this later stage, the PANN 2000 also included nutrition information and education components, in addition to the food supplement and health checkups. The results of the Lutter et al. (2008) study show that children
13. This fi gure is consistent with estimated costs per death averted from Vitamin A supplementation trials that range from 90 to 4,127 US$ (2005 prices), with a median of 409 US$ (Fiedler, Sanghvi, and Saunders 2008).
in program communities consumed signifi cantly more energy, protein, fat, iron, zinc, Vitamin A, and calcium than children in neighboring comparison areas due to the fortifi ed food supplement. There were also impacts on height and weight for relatively older children (12–14 months when the program began) and the prevalence of under-weight was reduced by 65 percent. The study also fi nds that the odds of being anemic were 58 percent lower for PANN 2000 children.
Although our own study is silent on nutritional mechanisms due to data limitations, the Lutter et al. (2008) study provides evidence on the entire causal pathway linking availability of the PANN 2000 in the community to Mi Papilla intake at home and to micronutrient status and child weight improvements. Because nutrition information and education components had been phased in by the time of the Lutter et al. (2008) study, it is in principle possible that these components were driving their results. However, it seems unlikely that counseling alone was responsible for the nutritional improvements in Lutter et al. (2008) because that study fi nds no evidence that mothers’ knowledge about appropriate age- specifi c feeding practices improved due to the program. Our fi nding on child mortality reduction during a period when nutrition information and education were not part of the PANN 2000 confi rms the importance of food supple-mentation. Our study also reinforces the internal validity of the Lutter et al. (2008) study because the mortality reduction we fi nd is consistent with its results on nutritional improvements. Taken together, the Lutter et al. (2008) study and ours indicate that food supplementation, rather than nutrition counseling, provided by the PANN 2000 led to nutritional improvements, which in turn contributed to reduce child mortality.
Evaluations of food or micronutrient supplementation programs rarely document impacts on child mortality.15 We are aware of four other evaluations—broadly defi ned to include cash transfer programs with a nutrition component—that report child (or infant) mortality reductions. Two of these studies consider government- run Vitamin A supplementation programs, one from Yemen (Banajeh 2003) and the other, which also included health worker visits, from Nepal (Thapa, Choe, and Retherford 2005). The third study is a Vitamin A fortifi cation trial using commercially marketed mono-sodium glutamate in Indonesia (compared to nonfortifi ed monosodium glutamate) (Muhilal et al. 1988). The fourth study examines the conditional cash transfer program PROGRESA (Barham 2011). Our own study confi rms that conditional food supple-mentation programs can save lives using a comparatively weak identifying assumption with many testable implications (Lee and Lemieux 2010; Lee and DiNardo 2011).16
The one to 1.5 percentage point or 40 to 60 percent mortality reduction for
15. A large literature, recently reviewed in Ainsworth et al. (2010), examines impacts of cash transfer, com-munity nutrition, and early child development programs on anthropometric outcomes. On conditional cash transfers: Attanasio et al. (2005). On community nutrition programs: White and Masset (2007); Hossain et al. (2005); Galasso and Umapathi (2009); Galasso, Umapathi, and Yau (2011); Alderman et al. (2009). On early child development programs: Armecin et al. (2006); Alderman (2007); Alderman et al. (2006); Behrman, Cheng, and Todd (2004).
6–24- month- olds we document in our study is quantitatively in line with existing evi-dence.17 The Vitamin A supplementation coupled with community health worker vis-its analyzed in Thapa, Choe, and Retherford (2005) reduced the odds of dying at age 12–59 months by slightly more than half.18 And the Muhilal et al. (1988) study found a relative mortality reduction for 12–60- month- olds of about 45 percent coming from Vitamin A fortifi cation alone (without food supplementation or health checkups). For infants younger than 12 months, the Muhilal et al. (1988) study found smaller and insig-nifi cant impacts. Barham’s (2011) study also looks at infant mortality and fi nds impacts that are again smaller, about one- fourth to one- sixth the size of our impact estimates.19
Infant or child mortality reductions have also been achieved through health service delivery and infrastructure interventions and it is instructive to compare these to the food or micronutrient supplementation programs discussed above. One example is the integrated management of childhood illness (IMCI) strategy, consisting mainly of health- worker training, health- systems improvements, and family and community activities. Evaluations of IMCI have found a 13 percent reduction in child mortality, statistically signifi cant in Tanzania (Schellenberg et al. 2004) but not in Bangladesh (Arifeen et al. 2009), and a signifi cant 15 percent reduction in infant mortality in India (Bhandari et al. 2012). Other IMCI evaluations also found impacts on neonatal mortal-ity. For health infrastructure interventions there is evidence from Bolivia that health facility upgrading and provision of supplies and equipment reduced child mortality by about 44 percent (Newman et al. 2002). The same study also evaluates health impacts of water supply investments in Bolivia and estimates a child mortality reduction of about 42 percent.
The paper is organized as follows. Section II provides background on nutrition and public health service delivery in Ecuador and describes the PANN 2000 intervention in more detail. Section II also describes the construction of the consumption poverty index that was used to target the program to the poorest communities. In Section III, we discuss the identifying assumption for a causal interpretation of our estimates. We present the data in Section IV. Section V discusses the estimation approach and Section VI evaluates the internal validity of the study. Section VII presents estimation results. We conclude with a discussion of limitations and extensions of our fi ndings.
II. Background and Program Description
A. Child Nutrition Prior to the PANN 2000
In 1999, one year before the PANN 2000 was initiated, an estimated 31.1 percent of children younger than age fi ve in Ecuador were stunted, or chronically
undernour-17. Technically, our mortality measure is for children up to 31 months. Although we do not know the age at death in the census data, we consider it unlikely that the program reduced mortality at age zero to fi ve months or much after the age of 24 months.
ished, according to their height- for- age index. These undernutrition levels rose to 42.8 percent in rural areas, and even 54.3 percent in the central mountain regions, the Sierra (SIISE 2010). As in other countries, most undernutrition in Ecuador occurred between the age of 6–24 months. Micronutrient defi ciencies were similarly widespread— earlier studies had found defi ciencies of iron (anemia) in over 60 percent and of Vita-min A in about 17 percent of children from high- risk groups aged 6–36 months.20 To reduce these nutritional failures, Ecuador had initiated a series of feeding interventions in the 1990s, such as a school meal initiative for children aged fi ve years and older, and some smaller interventions with special components for children aged two to fi ve.
B. Program Components, Costs, and Financing
The PANN 2000 was offi cially launched in August 2000 and was the fi rst large- scale, government- run intervention in Ecuador to specifi cally target the age group of 6–24- month- olds and thus address undernutrition in early childhood.21 The objectives of the program were to reduce child growth retardation, undernutrition, and micronutrient defi ciencies (Ministerio de Salud Pública 2000).22 The four main components of the program as initially planned were: 1) to inform mothers about the importance of good nutrition during early childhood using fl ip chart presentations and other materials; 2) to train health workers so they could advise mothers on appropriate age- specifi c child feeding practices; 3) the distribution of the free micronutrient- fortifi ed food, Mi Papilla; 4) in exchange for health checkups for the children. In its initial stage from August 2000 through the end of March 2001, the information and education components 1) and 2) were still under preparation, leaving provision of the fortifi ed food combined with health checkups as the only two active components during this period (Chauvin 2001).
The food supplement Mi Papilla is designed to provide about 50 percent of required caloric intake; 100 percent of the requirements of protein, iron, folic acid, and zinc; 60 percent of Vitamin C, the B vitamins, and magnesium; and 30 percent of Vitamin A, calcium and phosphorus, in addition to other nutrients (Lutter et al. 2008). After the checkup for the children, mothers would receive a voucher for a two kilogram bag of Mi Papilla powder—a monthly ration—which they could redeem in local pharmacies and food stores. The porridge would be prepared at home by adding boiled or other-wise purifi ed water to the powder.
The initial program stage was fi nanced with $1,340,000 from international donor agencies and $500,000 from the national government (Carranza 2011). By 2003, the external aid share was replaced with government fi nancing, and the yearly cost per benefi ciary at that time was estimated at $29.7 (Gordillo 2005), corresponding to about 0.4 percent of average household income.23 The PANN 2000 budget was
20. For a summary, see Lutter et al. (2007) or Carranza (2011).
21. According to the 1999 Ecuador Living Conditions Survey, Encuesta de Condiciones de Vida (ECV), only 3.6 percent of children 6–24 months old in rural areas were receiving free food by the government before the PANN 2000 started.
22. In a later period, pregnant and lactating mothers also started receiving fortifi ed drinks and nutrition counselling (Carranza 2011).
largely administered through the World Food Program, which purchased the powdered food rations through annual public auctions from private companies on behalf of the government. Private companies also shipped the food rations to pharmacies and food stores in each program community.
C. Administrative Background
Primary health services in Ecuador are provided by the central government. The ad-ministration runs from the ministry of health down to provincial directorates, health areas, and individual health facilities of different types. In rural areas, most regular control visits related to reproductive and child health, such as those required under the PANN 2000, took place in so- called health subcenters or health posts (subcentros/ puestos de salud). These are generally staffed with two or three registered or auxiliary nurses, and possibly a general doctor. Most rural parroquias have one health subcenter or post; those without any are included in the catchment area of the health subcenter/ post in a neighboring community.24 Mothers and their children younger than age fi ve have had universal, free access to primary healthcare since 1999.
Within this public health system, the PANN 2000 was implemented as follows. The ministry promoted the initiative through the provincial directorates among health workers from the parroquias, who typically attended information and training ses-sions at the canton or province headquarters. The parroquias then formed committees that helped to spread information about the program and select benefi ciaries within their area (through health centers, house visits, food stores, community associations, churches, etc.). Targeting fi nal benefi ciaries within communities based on poverty or basic needs soon turned out to be too diffi cult, and the product was essentially offered to every mother who attended the health center with a child in the eligible age range of 6–24 months. While it is possible that some children from comparison communities got Mi Papilla from health posts in neighboring treatment communities, such spill-overs would bias our estimates toward zero.
D. Targeting of the PANN 2000
The community- level consumption poverty index used for program assignment was estimated by ODEPLAN (1999) and is publicly available in the Sistema Integrado de Indicadores Sociales de Ecuador (SIISE 2010). The index measures for each com-munity the proportion of individuals whose estimated consumption falls below the poverty line. The poverty line is the monetary cost of a “basic needs” basket of goods and services, defi ned by the SIISE Poverty Commission (food, housing, education, etc.). The relationship between household per capita consumption and household characteristics is estimated based on the 1995 Living Conditions Survey, Encuesta de Condiciones de Vida (ECV), which contains a detailed questionnaire on house-hold expenditures but is not representative at the parroquia level.25 Based on common
24. In our largest estimation sample one treatment parroquia and three comparison parroquias did not have their own health post.
household characteristics in the ECV and the National Census, Censo Naciónal de Población y de Vivienda, household per capita consumption is projected on the house-holds registered in the 1990 Census. The assignment variable was thus created several years before the PANN 2000 was announced.26
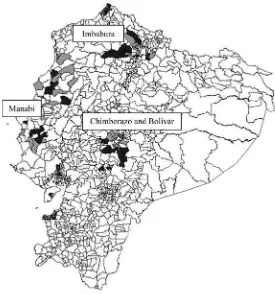
To determine participation in the initial program stage, parroquias in the seven poor-est provinces (Bolívar, Chimborazo, Cotopaxi, Imbabura, Loja, Manabí, and Orellana) were ranked by the consumption poverty index and preselected if it exceeded 90 per-cent, yielding 145 parroquias. Eventually, urban parroquias would be removed from this list to be targeted differently, with their places substituted by the next poorest rural units.27 This left the fi nal cutoff for rural parroquias at 89.05 percent.
The PANN 2000 progress reports in Chauvin (2001) show that in the provinces of Bolívar, Chimborazo, Imbabura, and Manabí, the initially selected rural parroquias coincided sharply with those that report numbers of actually attended children. In con-trast, Cotopaxi and Loja had not initiated the program by March 2001, and the PANN 2000 in Orellana had been extended to the entire province by that time. Based on this program information, we restrict our estimation sample to parroquias from provinces Bolívar, Chimborazo, Imbabura, and Manabí.
For most of our analysis we further restrict the sample of parroquias to those with a poverty index within six percentage points on either side of the 89.05 percent cut-off. Our reason for doing so is that we need to normalize our health checkups out-come by the number of kids of target age, and the offi cially estimated number of 6–24- month- olds in 2000 is only available for the poorest 40 percent of parroquias— corresponding to those with a poverty index above 82.27 percent. For our child mor-tality outcome, we also show results for broader samples, including parroquias with a poverty index within up to ten percentage points distance from the cutoff.
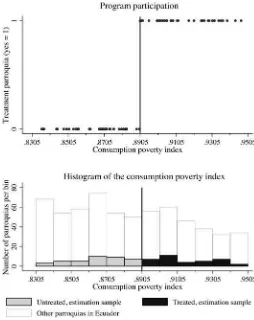
Figure 1 shows the geographical locations of treatment and comparison parroquias in the broadest estimation sample from the four program provinces. The (sharp) fi rst stage and histogram of the consumption poverty index for our estimation sample are depicted in Figure 2.
In the Winter of 2000/2001, the government drafted an emergency plan to increase the coverage of social programs in response to the prevailing economic crisis in Ec-uador. This led to the PANN 2000 being rapidly scaled up throughout the rest of the country from April 2001 onward, thereby ending the initial stage of the program and the quasi- experiment.28 This allows us to identify the impact of the program over the eight- month period from August 2000 to March 2001.
III. Identi
fi
cation
The basic intuition behind the regression discontinuity design is that, in the absence of program manipulation, communities to the left of the treatment-
26. Although there is certainly measurement error in the poverty index, this should be without consequence for our study as long as the mismeasurement does not change discontinuously at the cutoff. Random mea-surement error will bias estimation of the relationship between the poverty index and mortality toward zero. 27. When the PANN 2000 started, rural Ecuador was divided into 22 provinces, 176 cantons, and 776 par-roquias.
determining consumption poverty cutoff should provide valid counterfactual outcomes for communities on the righthand side of the cutoff (where the micronutrient- fortifi ed food, Mi Papilla, was being offered in exchange for health checkups for the children). More formally, let Y denote an outcome variable at the parroquia level (child mortality, number of health checkups per child), τ the (constant) treatment effect, D the indicator function for treatment (availability of the program), X the parroquia consumption pov-erty index, c the cutoff 89.05 percent, f(X) a polynomial function of the povpov-erty index, and U unobserved additional factors that affect outcomes. The model is as follows:
(1) Y = D+ f(X)+U
(2) D =1[X ≥ c].
Figure 1
Treatment and comparison parroquias in the estimation sample
If the potential regression functions E[Y|D =1,X] and E[Y|D =0,X] are both continuous in the poverty index, or equivalently, if E[U|X] is continuous, then the
difference in conditional expectations identifi es the treatment effect at the threshold:29
(3) lim X↓c
E[Y|X]−lim X↑c
E[Y|X]= .
29. With heterogeneous treatment effects, the RD gap identifi es the average treatment effect at the cutoff. See Lee (2008) for an alternative interpretation of the treatment effect identifi ed in this case as a weighted average of individual treatment effects, where the weights refl ect the ex ante probability that a parroquia’s score is realized close to the cutoff.
Figure 2
First stage and histogram of the consumption poverty index
The key assumption for this study concerns the continuity of the potential regres-sion functions, or equivalently, the continuity of E[U|X], which gives the estimand in Equation 3 above a causal interpretation. Intuitively, the continuity assumption re-quires that unobservables vary smoothly as a function of the poverty index and, in particular, do not jump at the cutoff. As shown in Lee and Lemieux (2010), suffi cient for the continuity of the regression functions (or the continuity of E[U|X]) is the as-sumption that individual densities of the treatment- determining variable are smooth. In our case, this assumption explicitly allows for individuals in the community to have some control over their particular value of the poverty index. As long as this control is imprecise, treatment assignment is randomized around the cutoff. As the assignment variable was created several years before the PANN 2000 was announced, we think that the continuity assumption is highly plausible in our context.30 Moreover, in Sec-tion VI below, we test an empirical implicaSec-tion of this assumpSec-tion, namely that pre-treatment observables should exhibit no discontinuity at the cutoff, which is equivalent to testing for balance at baseline in randomized designs.
A fi nal potential concern is that other government policies were also related to the 89.05 percent cutoff. If so, τ would refl ect the combined causal effect of the PANN 2000 and other policies. To our knowledge, however, there are no other programs that used the same cutoff during our study period. This conjecture is corroborated in Section VII below, where we present results on mortality for cohorts that were already too old to be included when the program started, as well as for our main cohorts but before implementation of the PANN 2000 or after its scaling up to the entire country or in provinces where the program had not been implemented yet as of August 2000. As expected for a program targeted based on age, province, and parroquia- level poverty, impact estimates from these falsifi cation tests are essentially zero and insignifi cant even though the confi dence intervals often do not rule out meaningful effects.
IV. Data
The poverty index is based on the political- administrative division in late 1999, which we adopt as an anchor to link parroquia- level data over time. All observations from individual units, such as children and health centers, are therefore aggregated at the parroquia- level based on the late–1999 parroquia borders. We fi rst add the November 1990 and November 2001 National Censuses, as well as the year 1999, 2000, and 2001 rounds of the Census on Health Center Resources and Activities, Recursos y Actividades de Salud (RAS). The National Census and the RAS provide universal coverage of all parroquias in the country and serve as sources for outcomes and control variables used in our analysis. We verifi ed in the program documentation that the PANN 2000 did not contain any performance awards or resource assignment mechanisms that would have created incentives for overstating the number of check-ups in the RAS data. More generally, there is no reason to believe that measurement
error in any of our outcome variables would systematically jump at the poverty index cutoff and thus generate a bias.
A. Child Mortality
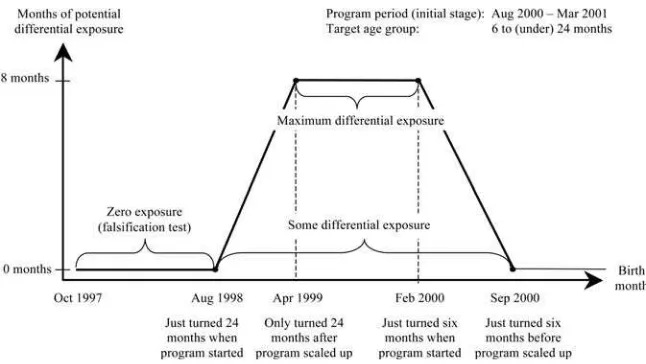
Given the target age of six to (under) 24 months, and an initial program stage that lasted from August 2000 until March 2001 before the PANN 2000 was scaled up, potential differential exposure to the program varied by birth month as illustrated in Figure 3.31 Children born in August 1998 or earlier were never eligible for the pro-gram because they were already 24 months or older when the PANN 2000 began in August 2000. Children born between September 1998 and April 1999 had one to eight potential months of exposure in early treatment parroquias. Although the May 1999 cohort had nine potential months of exposure in treatment parroquias, this cohort had a differential exposure relative to comparison parroquias of only eight months because the program was scaled up in April 2001 when the comparison group cohort was 23 months old and thus eligible for the program for one month. Starting with the March 2000 birth cohort, differential exposure in early treatment parroquias was successively reduced to zero because these cohorts were too young to be included in the initial stage of the program.
Given this potential exposure pattern, we defi ne our maximum differential exposure cohorts—corresponding to eight potential months of differential exposure to the pro-gram—as those born from April 1999 (children who only fell out of target age when the PANN 2000 was extended to comparison parroquias) to February 2000 (those who were just old enough to receive program benefi ts when the program started).
31. We refer to potential exposure because coverage or takeup of the program was below 100 percent.
Figure 3
We use census data—rather than vital statistics—to measure child mortality. We prefer the census data over administrative records because the undercount is likely less severe particularly for the rural parroquias considered in our study.32 One particularity with the census is that it did not collect the mortality history of other children than the last born in a given household. In our analysis, the child mortality rate is thus the percentage of last- born children in a given cohort who had died until census day (November 25, 2001). For the maximum differential exposure cohorts the mortality rate is measured as follows:
Number of last-born children born April 1999 to February 2000 who died by Nov. 2001 Total number of last-born children born April 1999 to February 2000 . This child mortality rate corresponds to 21–31- month- olds and captures about two- thirds of all children in the program cohorts.33 Seventy- fi ve percent of parroquias in our sample had zero to two deaths in the April 1999 to February 2000 birth cohorts by November 2001 and the maximum number of deaths was nine. Because our measure of mortality is driven by the target age of the PANN 2000 and the length of the initial stage of the program before it was scaled up, it is admittedly unconventional. Unfortu-nately we were unable to fi nd any studies comparing the validity and reliability of the zero to 21–31 months mortality rate that we use here to more conventional measures.
As noted above, children born in August 1998 or earlier were already 24 months or older at program inception in August 2000 and likely never received Mi Papilla. For one of our falsifi cation tests we therefore construct the mortality rate of slightly older cohorts born between October 1997 and August 1998 (containing the same number of birth months as our maximum differential exposure cohorts):
Number of last-born children born October 1997 to August 1998 who died by November 2001
Total number of last-born children born October 1997 to August 1998 .
As an additional falsifi cation exercise, we also construct the mortality rate for non-exposed cohorts born between April 1997 and February 1998, thus holding seasonal factors—relative to our maximum differential exposure cohorts—constant. Note that the last- born children in these cohorts could not have received Mi Papilla through younger siblings as, by defi nition, they did not have any.
B. Fertility
One concern with our focus on last- born children is that it might generate a purely mechanical mortality reduction if the PANN 2000 made it more likely that a death
32. For example, in 2006, only 56 percent of infant deaths were registered in Ecuador according to the World Bank (2013). Comparing the death counts from the census to those from the vital statistics in our sample, we estimate that about 67 percent of deaths went unreported in the offi cial statistics.
in our maximum differential exposure cohorts was “replaced” with another birth. To address this issue we investigate whether the program indeed had an impact on fertil-ity. As the program started in August 2000 we look at the number of live- births in the period April 2001 to November 2001 to women aged 15–44 years on census day (November 25, 2001). Specifi cally, fertility is measured as follows:
Number of live-births between April and November 2001 Number of women aged 15-44 years on November 25, 2001.
Because the program might have been anticipated we also look at live- births from September 2000 to November 2001.
C. Health Checkups
Yearly visits of children for two age groups (zero to under one year, one to under fi ve years) are reported by all health centers. We extract the absolute numbers of visits for both age groups in 2000, add them up, and normalize the total with the imputed number of children based on target population estimates in Flores (2001). The number of health checkups per 0–4- year- old is thus given by:
Number of visits among 0–59-month-olds during 2000
Officially estimated number of 6–24-month-olds from Flores (2001) × (60/18).
The offi cial number of 6–24- month- olds in 2000 is only an estimate because direct measures are not available. Some additional measurement error may arise from the fact that not all children visit the health facility in their own parroquia. While our normalized health checkups are thus certainly measured with error, this should not bias our impact estimates as long as the mismeasurement does not change discontinu-ously at the cutoff. Although random measurement error in the dependent variable will infl ate standard errors, there is nothing we can do about it.
D. Nutrition Status and Anthropometric Outcomes
Unfortunately, our data on nutritional status and anthropometric outcomes are very limited. Neither the ministry nor the provinces have kept records for the relevant co-hort of children that would be suffi ciently disaggregated for our analysis. The orig-inally intended registration system for the PANN 2000 (SIPPAN) was never fully implemented, and the data collected in the initial years were entirely lost. It took until 2006 to again systematically compile comprehensive data on program benefi ciaries and benefi ts. We have verifi ed at the Ministry of Public Health that the nutrition data bases from 2006–10 do not include any data on children exposed to the PANN 2000 during the initial stages of the program.
PANN 2000—through its effect on health checkups—probably infl uenced who got registered.34
Given the lack of administrative health records, we also tried to obtain anthropo-metric data for young children from a series of socioeconomic and health surveys. The preprogram measures we have come from two sources. First, stunting of children younger than age fi ve was observed in the 1988 Food, Nutrition, and Health Diagno-sis, Diagnóstico de la Situación Alimentaria, Nutricional y de Salud (DANS). SIISE (2010) provides stunting rates projected from the DANS on the 1990 census and thus full coverage for all parroquias. Second, we pooled cohort- specifi c weight- and height- for- age for the children in 1998 and 1999 rounds of the Encuesta de Condiciones de Vida (ECV). Unfortunately, coverage of parroquias and sample sizes turned out too small to be useful for our purposes.35
For postprogram anthropometric outcomes, we pooled children from the Reproduc-tive Health Survey 2004, Encuesta Demográfi ca de Salud Materna e Infantil (ENDE-MAIN), and the March 2004 Labor Force Survey, Encuesta de Empleo, Desempleo y Subempleo (ENEMDU). However, survey coverage of rural parroquias (about one- third) and the number of children within parroquias (less than 2 percent of the target age group) turned out too small for statistical analysis.36 Descriptive statistics of pre-treatment variables (Panel A) and outcomes (Panel B) are given in Table 1.
V. Estimation Approach
Following Hahn, Todd, and Van der Klaauw (2001); Imbens and Lemieux (2008); and Lee and Lemieux (2010), our main estimation approach is to use local linear regression in samples around the discontinuity, which amounts to running simple linear regressions allowing for different slopes of the regression function in the neighborhood of the cutoff. Allowing for slope is particularly important in the present application because child mortality is increasing as the poverty index approaches the cutoff from below, and again increasing after the threshold. A simple comparison of means for parroquias above and below the cutoff would therefore bias estimates of the treatment effect towards zero. We follow the suggestions by Imbens and Lemieux (2008) and use a rectangular kernel (that is, equal weight for all observations in the estimation sample). To ensure that our fi ndings are not driven by functional form as-sumptions, we focus on estimation results from linear specifi cations in the discontinu-ity samples, adding nonlinear specifi cations as a robustness check.
Let Y denote an outcome, X the parroquia consumption poverty index, c the cutoff 89.05 percent, W a set of pretreatment covariates, and U an error term for each
par-34. In the population of 1–4- year- olds, only 21 to 28 percent of the children got their height registered through the SISVAN in the years 1999 to 2001 (Walker et al. 2007).
35. The ECV covered 18 out of the 75 parroquias in our largest estimation sample. For covered parroquias, the average sample size was 2.06 children in the relevant age range.
The Journal of Human Resources
Table 1
Descriptive Statistics
Ecuador Estimation Sample
Sample Observations
All Provinces
776
h = 6 All Provinces
312
h = 6 Program Provinces
75
h = 6 Sierra Provinces
49
Panel A: Pretreatment Variables
Consumption poverty index for year 2000 (1990 census and 1995 ECV) 0.810 0.884 0.889 0.891
[0.130] [0.033] [0.029] [0.030]
Number of health checkups per 0–4- year- old during year 1999 (1999 RAS)
0.720 0.745 0.541 0.563
[0.928] [0.934] [0.584] [0.650]
Proportion of last- born children born Apr 1988 to Feb 1989 died by Nov 1990 (1990 census)
0.024 0.024 0.025 0.023
[0.029] [0.028] [0.022] [0.023]
Proportion of stunted children younger than age fi ve in 1990 (1990 census and 1988 DANS)
0.545 0.571 0.587 0.663
[0.111] [0.109] [0.108] [0.025]
Presence of a health center in the parroquia in 2000 (yes = 1) (2000 RAS) 0.790 0.840 0.947 0.918
[0.408] [0.367] [0.226] [0.277]
Proportion of women aged 18 or older who completed primary schooling (2001 census)
0.504 0.445 0.405 0.400
[0.148] [0.123] [0.107] [0.102]
Proportion of dwellings with access to piped water (2001 census) 0.643 0.581 0.652 0.843
Meller and Litschig
1031
Average number of persons per room (2001 census) 2.253 2.397 2.188 2.195
[0.612] [0.665] [0.331] [0.336]
Number of last- born children born April 1999 to February 2000 living in the parroquia (2001 census)
86.735 71.939 80.733 70.327
[194.787] [70.029] [55.129] [57.252]
Number of last- born children born April 1988 to February 1989 living in the parroquia (1990 census)
58.067 59.212 79.053 68.653
[66.192] [57.023] [51.616] [53.133]
Estimated population of 6–24- month- olds in 2000 (Flores 2001) n/aa 158.147 199.653 163.163
[140.037] [124.010] [122.240]
Panel B: Outcomes
Number of health checkups per 0–4- year- old during year 2000 (2000 RAS)
0.811 0.866 0.750 0.693
[0.936] [0.998] [0.692] [0.645]
Proportion of last- born children born April 1999 to February 2000 died by November 2001 (2001 census)
0.015 0.013 0.016 0.017
[0.030] [0.020] [0.017] [0.019]
Notes: The unit of observation is the rural parroquia. h is the percentage point distance from the eligibility cutoff 89.05 percent. Table entries are sample means and sample standard deviations (in square brackets). The estimation sample contains parroquias in the program provinces (Bolívar, Chimborazo, Imbabura, Manabí) with nonmissing values for all variables in Panel A. Sierra provinces are Bolívar, Chimborazo, and Imbabura.
roquia. Covariates are not needed for identifi cation. We include them to guard against chance correlations with treatment status and to increase the precision of the estimates. For observations within a given percentage point distance h from the cutoff we esti-mate the following specifi cation:
(4) Y = 1[X ≥ c]+␣
0+␣1(X −c)+␣2(X −c)×1[X ≥ c]+␥W+U.
We use observations within successively larger neighborhoods (h = 3, 4, 5, 6 per-centage points) around the cutoff in order to assess the robustness of the results. For mortality we also show estimates within 7–10 percentage points of the cutoff using quadratic specifi cations.37
VI. Internal Validity Checks
Because extensive manipulation of the poverty index would cast seri-ous doubts on the internal validity of the research design, we check for any evidence of sorting, notably discontinuities in the distribution of the poverty index. The lower panel of Figure 2 plots the histogram of the consumption poverty index. Visual inspec-tion reveals no discontinuities and the null hypothesis of a smooth density cannot be rejected according to the density test suggested by McCrary (2008).38
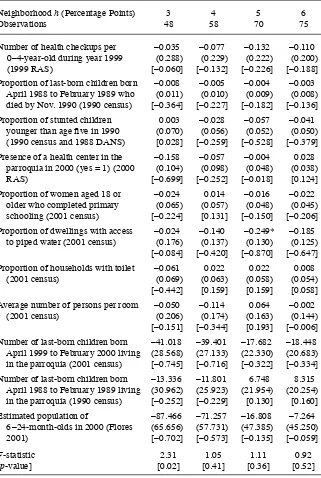
In Table 2, we estimate Equation 4 for a host of pretreatment outcomes and other covariates. The results show that there is no statistical evidence of discontinuities in any of these variables. At the bottom of Table 2 we also show F- test results for suc-cessively larger neighborhoods—corresponding to our main estimation samples—that fail to reject the joint null hypotheses of no discontinuity in any pretreatment covari-ates at conventional levels of signifi cance, except for one bandwidth choice.39
Nonetheless, some of the standardized discontinuity estimates in Table 2 are quite large. This is the case for the proportion of dwellings with access to piped water or the number of last- born children born April 1999 to February 2000, for example. In Section VII below we show that our impact estimates are robust to the inclusion of these covariates, including the pretreatment mortality and checkup outcomes shown in Table 2, thus providing additional evidence regarding the internal validity of the design.
VII. Estimation Results
A. Impact on Child Mortality, Maximum Differential Exposure Cohorts
Table 3 presents impact estimates for child mortality of last- borns, born between April 1999 and February 2000, using linear specifi cations of the poverty index. All estimates
37. We have also experimented with procedures for choosing the “optimal” bandwidth for child mortality, our main outcome variable. The cross- validation criterion (Ludwig and Miller 2007; Imbens and Lemieux 2008; Lee and Lemieux 2010) is essentially fl at over the range of two to ten percentage points distance from the cutoff, thus providing little guidance regarding bandwidth choice. If anything, the cross- validation func-tion is lower for smaller bandwidths up to about fi ve percentage points compared to larger bandwidths (results available on request). The Imbens- Kalyanaraman (2012) “optimal” bandwidth is 8.07 percentage points. 38. The discontinuity estimate and (standard error) in our estimation sample are 0.34 (0.80).
Table 2 0–4- year- old during year 1999 (1999 RAS)
–0.035 –0.077 –0.132 –0.110 (0.288) (0.229) (0.222) (0.200) [–0.060] [–0.132] [–0.226] [–0.188]
Proportion of last- born children born April 1988 to February 1989 who died by Nov. 1990 (1990 census)
Presence of a health center in the parroquia in 2000 (yes = 1) (2000 RAS)
–0.158 –0.057 –0.004 0.028 (0.104) (0.098) (0.048) (0.038) [–0.699] [–0.252] [–0.018] [0.124]
Proportion of women aged 18 or older who completed primary
Average number of persons per room (2001 census)
–0.050 –0.114 0.064 –0.002 (0.206) (0.174) (0.163) (0.144) [–0.151] [–0.344] [0.193] [–0.006]
Number of last- born children born April 1999 to February 2000 living in the parroquia (2001 census)
–41.018 –39.401 –17.682 –18.448 (28.568) (27.133) (22.330) (20.683) [–0.745] [–0.716] [–0.322] [–0.334]
Number of last- born children born April 1988 to February 1989 living in the parroquia (1990 census)
–13.336 –11.801 6.748 8.315 (30.962) (25.923) (21.954) (20.254) [–0.252] [–0.229] [0.130] [0.160]
Estimated population of
6–24- month- olds in 2000 (Flores 2001)
The Journal of Human Resources Table 3
Impact on Child Mortality, Maximum Differential Exposure Cohorts, Linear Specifi cation
Dependent Variable: Proportion of Last- Born Children Born April 1999 to February 2000 Who Had Died by November 2001 Neighborhood h
(Percentage Points)
Comparison Mean
3 4 5 6
Preprogram Controls N Y N Y N Y N Y
Panel A: Bolívar, Chimborazo, Imbabura, Manabí
Treatment parroquia (yes = 1) 0.025 –0.015* –0.015* –0.015* –0.018** –0.012* –0.015** –0.007 –0.011
(0.009) (0.008) (0.008) (0.008) (0.007) (0.007) (0.007) (0.007)
Observations R2 48 48 58 58 70 70 75 75
0.064 0.401 0.119 0.420 0.094 0.299 0.057 0.249
Panel B: Bolívar, Chimborazo, Imbabura
Treatment parroquia (yes = 1) 0.029 –0.021 –0.023 –0.020* –0.020 –0.019* –0.017 –0.012 –0.010
(0.013) (0.017) (0.011) (0.014) (0.011) (0.013) (0.010) (0.012)
Observations R2 30 30 39 39 46 46 49 49
0.065 0.475 0.131 0.487 0.099 0.418 0.040 0.345
in Table 3 Panel A are negative, with six out of eight estimates falling in the range from –1 to –1.5 percentage points. The estimates are essentially unchanged when pre-treatment controls are included and are statistically signifi cant (usually at 10 percent and sometimes at 5 percent) even in small neighborhoods of four to fi ve percentage points around the cutoff. The estimates that are not signifi cant in Table 3 Panel A are in the widest, six percentage point bandwidth, which likely refl ects a specifi cation error: With the quadratic specifi cation in Table 5 Panel A, these estimates are highly signifi cant.
In the Sierra sample (Table 3, Panel B), where child mortality tends to be higher in the absence of the program (3 percent versus 2.5 percent), impact estimates are somewhat larger (in absolute value), about –2 percentage points. Most of the estimates from the Sierra provinces alone are not signifi cantly different from zero because of higher standard errors (rather than lower estimates) as in these provinces we only have two- thirds of the total sample.40
Table 4 gives Poisson regression estimates of the discontinuity as well as the im-plied incidence rate ratios. The magnitude of the estimated mortality reduction ranges mostly between 40–60 percent for the full sample, very similar to the relative mor-tality risk reduction we estimate in Table 3. With both OLS and Poisson regression, estimates are larger (in absolute value) in the Sierra region. Statistical precision is considerably enhanced with the Poisson estimates, especially for the Sierra sample.41
Tables 5 and 6 show that the above results are robust to a quadratic specifi cation of the poverty index for h = 3, 4, 5, 6 percentage points and h = 7, 8, 9, 10 percentage points, respectively. In Table 5, impact estimates are consistently negative but they tend to be more variable compared to the local linear estimates in Table 3, while in Table 6 impact estimates are of similar magnitude with seven out of eight falling in the –1 to –1.5 percentage point range. Standard errors are also similar across bandwidths, despite the larger sample sizes in Table 6, presumably because the fi t is systematically worse with the larger bandwidths. Looking at Panels A in Tables 3 and 6 together, there is a total of 16 estimates, ten of which are signifi cant at 10 percent and three at 5 percent while random chance would predict at most two signifi cant at 10 percent and one at 5 percent.
We use an F- test of the joint hypotheses that the coeffi cients on the quadratic terms on either side of the cutoff are zero to see whether linearity of the polynomial in the poverty index can be rejected. As shown in Tables 5 and 6, except for the specifi ca-tion in the widest bandwidths, there is virtually no statistical evidence against the null hypothesis of a linear model, which corroborates our focus on the linear estimates (and standard errors) in Table 3. We conclude from these results that the presence of the PANN 2000 program reduced child mortality in cohorts with eight months of dif-ferential exposure from a level of about 2.5 percent by one to 1.5 percentage points.
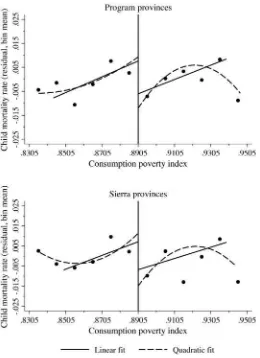
Figure 4 presents graphical evidence of the discontinuity in child mortality for h = 6 and Figure 1 in the online Appendix for h = 10.42 Each dot represents the average residual from a regression of child mortality at the parroquia level on the list of control
40. Estimates for the coastal province Manabí (available on request) are almost all negative as well, but they are more variable.
The Journal of Human Resources Table 4
Impact on Child Mortality, Maximum Differential Exposure Cohorts, Poisson Regression
Dependent Variable: Number of Last- Born Children Born April 1999 to February 2000 Who Had Died by November 2001 Neighborhood h
(Percentage Points) 3 4 5 6
Preprogram Controls N Y N Y N Y N Y
Panel A: Bolívar, Chimborazo, Imbabura, Manabí
Treatment parroquia (yes = 1) –1.009 –0.774** –1.125** –1.048*** –0.594 –0.732** –0.495 –0.639**
(0.680) (0.379) (0.512) (0.385) (0.433) (0.325) (0.397) (0.301)
Incidence rate ratio 0.364 0.461 0.325 0.351 0.552 0.481 0.610 0.528
Observations 48 48 58 58 70 70 75 75
Pseudo R2 0.027 0.277 0.066 0.345 0.022 0.299 0.023 0.289
Panel B: Bolívar, Chimborazo, Imbabura
Treatment parroquia (yes = 1) –2.115** –1.778** –2.069*** –1.364** –1.385** –1.046** –1.155** –0.807
(0.880) (0.838) (0.648) (0.664) (0.599) (0.527) (0.549) (0.495)
Incidence rate ratio 0.121 0.169 0.126 0.256 0.250 0.351 0.315 0.446
Observations 30 30 39 39 46 46 49 49
Pseudo R2 0.076 0.366 0.103 0.441 0.042 0.397 0.033 0.378
Notes: Poisson regression discontinuity and incidence rate ratio estimates using a linear specifi cation of the poverty index. The unit of observation is the rural parroquia. h is the percentage point distance from the eligibility cutoff 89.05 percent. Child mortality is the proportion of last- born children born between April 1999 and February 2000 who had died by November 2001 (2001 census). Preprogram controls include number of checkups at health posts per 0–4- year- old during year 1999 (1999 RAS health census), proportion of last- born children born between April 1988 and February 1989 who had died by November 1990 (1990 census), proportion of stunted children younger than age
Meller and Litschig
1037
Dependent Variable: Proportion of Last- Born Children Born April 1999 to February 2000 Who Had Died by November 2001 Neighborhood h
(Percentage Points)
Comparison Mean
3 4 5 6
Preprogram Controls N Y N Y N Y N Y
Panel A: Bolívar, Chimborazo, Imbabura, Manabí
Treatment parroquia (yes = 1) 0.027 0.002 –0.008 –0.006 –0.016** –0.014 –0.021** –0.018** –0.023***
(0.008) (0.011) (0.008) (0.008) (0.009) (0.009) (0.009) (0.009)
F- test (quadratic terms) 2.369 0.222 1.893 1.715 0.161 0.525 1.679 2.583
[p- value] [0.106] [0.802] [0.161] [0.192] [0.852] [0.594] [0.194] [0.084]
Observations 48 48 58 58 70 70 75 75
R2 0.138 0.407 0.152 0.447 0.098 0.312 0.085 0.286
Panel B: Bolívar, Chimborazo, Imbabura
Treatment parroquia (yes = 1) 0.032 –0.015 –0.032 –0.017 –0.028 –0.020 –0.026 –0.033** –0.035**
(0.009) (0.021) (0.011) (0.019) (0.014) (0.018) (0.015) (0.017)
F- test (quadratic terms) 1.927 0.160 1.644 0.514 0.438 0.132 2.097 1.832
[p- value] [0.167] [0.853] [0.209] [0.605] [0.648] [0.877] [0.135] [0.176]
Observations 30 30 39 39 46 46 49 49
R2 0.151 0.481 0.176 0.504 0.111 0.423 0.084 0.382
The Journal of Human Resources Table 6
Impact on Child Mortality, Maximum Differential Exposure Cohorts, Quadratic Specifi cation, h<10
Dependent Variable: Proportion of Last- Born Children Born April 1999 to February 2000 Who Had Died by November 2001 Neighborhood h
(Percentage Points)
Comparison Mean
7 8 9 10
Preprogram Controls N Y N Y N Y N Y
Panel A: Bolívar, Chimborazo, Imbabura, Manabí
Treatment parroquia (yes = 1) 0.027 –0.014* –0.017** –0.012 –0.014* –0.011 –0.014* –0.010 –0.012
(0.008) (0.007) (0.008) (0.008) (0.008) (0.008) (0.008) (0.009)
F- test (quadratic terms) 1.093 1.979 1.541 1.684 2.132 2.685 4.282 4.120
[p- value] [0.340] [0.146] [0.220] [0.192] [0.124] [0.074] [0.016] [0.019]
Observations 86 86 98 98 107 107 110 110
R2 0.100 0.239 0.059 0.200 0.071 0.193 0.070 0.189
Panel B: Bolívar, Chimborazo, Imbabura
Treatment parroquia (yes = 1) 0.032 –0.024* –0.024* –0.018 –0.010 –0.015 –0.011 –0.015 –0.011
(0.014) (0.014) (0.013) (0.013) (0.013) (0.013) (0.013) (0.013)
F- test (quadratic terms) 1.001 1.981 0.944 1.183 1.087 1.995 1.087 1.995
[p- value] [0.375] [0.151] [0.395] [0.315] [0.343] [0.145] [0.343] [0.145]
Observations 55 55 65 65 73 73 73 73
R2 0.151 0.481 0.176 0.504 0.057 0.306 0.057 0.306
variables from Tables 3 and 6. These are included to absorb some of the variation in the dependent variable and make the jump at the cutoff more easily visible. For ex-ample, the fi rst dot to the left of the vertical black line represents the sample mean of partialled- out child mortality for all parroquias within one percentage point to the left of the 89.05 percent cutoff. Each graph also shows the fi tted lines from our preferred linear specifi cation with h = 5 and a quadratic specifi cation using the largest neighbor-hood, h = 6 in Figure 4 and h = 10 in Figure 1 in the online Appendix, respectively.
Figure 4
Figure 4 shows a reduction of about one percentage point in child mortality at the cutoff and it additionally shows that the drop is visually robust irrespective of the width of the neighborhood or province sample examined. The fact that the regression lines slope upward without exception is further evidence favoring the validity of the design, since one would expect child mortality to increase with poverty. Figure 1 in the online Appendix shows that there is a nonlinearity or discontinuity in child mortality to the left of the cutoff starting at around 83.05 percent. Because 82.27 percent marks the cutoff for the 40 percent poorest parroquias, it is possible that this mortality pattern refl ects the effect of other programs that were targeted based on the poverty index. In any case, there is a jump at 89.05 percent, exactly where we would expect to see one based on the research design. Overall, we conclude that there is strongly suggestive— even if not fully conclusive—graphical evidence of a drop in child mortality at the cutoff.
B. Impact on Fertility
Tables 1 and 2 in the online Appendix show impacts on fertility over the period April to November 2001 and September 2000 to November 2001, respectively. Estimates are almost evenly split into positive and negative and very far from statistical signifi -cance throughout. The 95 percent confi dence interval based on the largest standard er-ror (0.015) in Panel A, Table 1 is about [–0.03, 0.03]. So fertility increased by at most three children per 100 women. Taking into account that some of these children would have been fi rst- borns and therefore would not have led to an undercount of deaths of older siblings and that it is unlikely that the “replacement” was one to one, it seems unlikely that fertility had a substantial impact on measured mortality in our maximum differential exposure cohorts.
C. Impact on Health Checkups
Table 7 gives estimates of the jump in the number of checkups at health centers per child for 0–4- year- olds during the year 2000 using linear specifi cations of the poverty index. The estimates in Panel A suggest that checkups per child increased by about 0.2 although none of the estimates are statistically signifi cant.
In contrast to the child mortality results discussed above, there is considerable re-gional heterogeneity in the impact estimates on checkups. Panel B of Table 7 restricts the sample to the three program provinces from the Sierra region, where checkups were lower to start with (about 0.63 checkups per child compared to 0.83 checkups when the coastal province Manabí is included). The estimates in Panel B suggest that checkups per child increased by about 0.8 and nearly all of the estimates are statisti-cally signifi cant at 5 percent, even in the smallest neighborhoods of three percentage points around the cutoff. The magnitude of the discontinuity implies that mothers added about 0.66 visits to health centers per month in Sierra parroquias.43
Meller and Litschig
1041
Dependent Variable: Number of Checkups at Health Posts per 0–4- year- old During Year 2000
Neighborhood h (Percentage Points)
Comparison Mean
3 4 5 6
Preprogram Controls N Y N Y N Y N Y
Panel A: Bolívar, Chimborazo, Imbabura, Manabí
Treatment parroquia (yes = 1) 0.829 0.172 0.238 0.073 0.218 0.164 0.236 0.138 0.199
(0.320) (0.319) (0.288) (0.254) (0.303) (0.264) (0.267) (0.242)
Observations 48 48 58 58 70 70 75 75
R2 0.015 0.579 0.078 0.607 0.019 0.579 0.015 0.569
Panel B: Bolívar, Chimborazo, Imbabura
Treatment parroquia (yes = 1) 0.625 1.078** 1.528** 0.774** 0.802** 0.566 0.739** 0.620* 0.846**
(0.513) (0.620) (0.366) (0.376) (0.351) (0.318) (0.339) (0.317)
Observations 30 30 39 39 46 46 49 49
R2 0.139 0.753 0.207 0.713 0.163 0.732 0.125 0.694
Table 7.1 in the online Appendix shows that the results on checkups are robust to a quadratic specifi cation of the poverty index. As with child mortality above, there is virtually no statistical evidence against the null hypothesis of a linear model based on F- statistics in almost all specifi cations (the only exception being the six percentage point bandwidth with covariates in Panel B), which again corroborates our focus on the linear estimates (and standard errors).
Figure 5 presents the discontinuity in health checkups graphically. Figure 5 shows
Figure 5
Impact on health checkups in 2000
clear evidence of a discontinuity in the number of checkups per child at the cutoff in the Sierra provinces but not for all program provinces together, including Manabí. The fi gure for the Sierra provinces additionally shows that the discontinuity is visually robust irrespective of the width of the neighborhood examined.
D. Impact on Child Mortality, Nonexposed Cohorts and Less- Exposed Cohorts
Table 8 presents impact estimates for child mortality of cohorts that were too old to be exposed to the program, given the target age of 6–24 months. As expected, estimates for these cohorts are essentially zero and nowhere near statistical signifi cance.44 Still, the confi dence intervals are quite large and often consistent with an effect size that is similar to that found for exposed cohorts above. Figure 6 confi rms the zero effect visually, showing no evidence of a discontinuity in mortality rates at the cutoff. As an additional robustness check, we also performed the same falsifi cation exercise with nonexposed cohorts born between April 1997 and February 1998, thus holding sea-sonal factors constant, again with essentially the same result (Table 8.1 and Figure 2 in the online Appendix).
We also estimate the impact on mortality for a broader set of cohorts that were differentially exposed to the program for a shorter period—at least one month rather than a full eight months as in our main specifi cation—and fi nd effects that are smaller in magnitude but still consistently negative (Table 8.2 and Figure 3 in the online Ap-pendix).
E. Impact on Child Mortality, Nonprogram Provinces
Another natural falsifi cation exercise is to test whether there is a jump in mortal-ity rates at the program cutoff for our maximum differential exposure cohorts but in provinces where the PANN 2000 was implemented only from April 2001 onward. We restrict the sample to parroquias from Sierra or coastal provinces—excluding provinces in the Amazon region of the country—because the four initial PANN 2000 provinces were in the Sierra or on the coast.45 Table 9 presents impact estimates using linear specifi cations of the poverty index.46 As expected, estimates for these cohorts are essentially zero and nowhere near statistical signifi cance. Again, however, the con-fi dence intervals are often consistent with an effect size that is similar to that found for exposed cohorts above. Figure 7 confi rms the zero effect visually, showing no evidence of a discontinuity in mortality rates at the cutoff.
44. For these nonexposed cohorts, mortality in comparison communities is lower than for exposed cohorts despite observing them at up to 49 months of age versus up to 31 months. A potential explanation for this pattern comes from selection effects: If having a younger sibling worsens survival prospects of the older sibling we would expect lower mortality in older cohorts once we only look at last- borns. The meta- analysis in Charmarbagwala et al. (2004) shows that short subsequent birth spacing is associated with higher mortal-ity of the older child. De Haan, Plug, and Rosero (2014) provides evidence of birth order effects on human capital development in Ecuador that is also consistent with this explanation.
45. Coastal provinces are El Oro, Esmeraldas, Guayas, and Los Ríos. Sierra provinces are Azuay, Carchi, Cañar, Pichincha, and Tungurahua.