Wealth Accumulation
Maury Gittleman
Edward N. Wolff
a b s t r a c t
Making use of PSID data for 1984, 1989, and 1994, we examine race dif-ferences in patterns of asset accumulation. Our results indicate, as ex-pected, that inheritances raise the rate of wealth accumulation of whites relative to that of African Americans. But, while whites devote a greater share of their income to saving, racial differences in saving rates are not signicant, once we control for income. Though our results may be period-speci c, we also do not nd evidence that the rate of return to cap-ital is greater for whites than for African Americans. Simulations suggest that African Americans would have gained signicant ground relative to whites during the period if they had inherited similar amounts, saved at the same rate, had comparable income levels and, more speculatively, had portfolios closer in composition to those of whites.
I. Introduction
A vast literature in economics has examined the economic progress of African Americans during this century. Most of these studies have focused on income—or on even narrower measures of economic well-being such as earnings— Maury Gittleman is a research economist at the U.S. Bureau of Labor Statistics. Edward N. Wolff is a professor of economics at New York University. Earlier versions of this paper were presented at the session “Ethnicity, Race, and Socioeconomic Outcomes” at the Annual Meeting of the Population Asso-ciation of America, Los Angeles, March 23–25, 2000, and at the conference on “Saving, Intergenera-tional Transfers, and the Distribution of Wealth” at the Jerome Levy Economics Institute of Bard Col-lege, June 7–9, 2000. We thank the coeditor, three anonymous referees, Maureen Conway, Richard Curtin, Keenan Dworak-Fisher, Brooks Pierce, and participants in both conferences for helpful discus-sions and comments. Any views expressed are those of the authors and should not be attributed to the Bureau of Labor Statistics or the Department of Labor. Edward Wolff would like to gratefully acknowl-edge nancial support provided by the Ford Foundation. The data used in this article can be obtained August 2004 through July 2007 from Maury Gittleman, gittleman_m@bls.gov.
[Submitted September 2000; accepted August 2002]
ISSN 0222166XÓ2004 by the Board of Regents of the University of Wisconsin System
194 The Journal of Human Resources
and have sought to assess the extent to which any gains that were made relative to other race groups can be attributed to factors such as declining race discrimination, afrmative action policies, changes in industrial composition, and a narrowing of the gap between the educational levels of African Americans and the rest of the population. Much less is known, however, about how African Americans have fared in terms of wealth, an important measure of economic well-being that is more infor-mative in many respects than those derived from income ows during a particular year. Despite the fact that a number of studies have examined inequality by race in wealth levels, little attention has been paid to differences by race in patterns of wealth accumulation. To ll this gap, we examine wealth changes over the period 1984– 94, showing how the races differ in terms of the main components of wealth growth— saving, capital gains and inheritances.
While studies of earnings and income are important for assessing the extent to which labor market discrimination exists and the ability of African Americans to move closer to whites1in terms of acquiring the skills and connections that are cur-rently rewarded by the markets, they provide what is clearly an incomplete picture. It is evident that the economic positions of two families with the same incomes but widely different wealth levels are not identical. The wealthier family is likely to be able to better provide for the educational and health needs of its children, to be living in a neighborhood characterized by more amenities and lower levels of crime, to have greater resources that can be called upon in times of economic hardship, and to have more inuence in political life.
The ratios measuring the relative income and earnings positions of African Ameri-cans show they remain substantially behind whites, but the gaps are small compared to the staggering chasm between wealth levels. For instance, Wolff (1998) estimates the ratio of mean net worth for non-Hispanic African Americans to non-Hispanic whites at 0.17 in 1995, with the ratio being even lower when measured in terms of medians (0.12). To put these wealth ratios in perspective, the ratio of both the mean and median income of African American households to those for white ones was 0.64 in 1997 (U.S. Census Bureau 1999). Though the data needed to examine trends in wealth ratios over long periods of time are scarce, there is little evidence to suggest that they have risen substantially from even lower levels, at least over the past decade or so (Wolff 1994). For instance, in 1983, the mean and median ratios stood at 0.19 and 0.07, respectively.
The handful of recent studies on racial differences in wealth have paid little atten-tion to patterns in wealthaccumulation, focusing instead almost exclusively on trying to explain gaps in wealthlevels. The typical approach has been to employ a Blinder-Oaxaca means-coefcient analysis (Blinder 1973), using regressions estimated sepa-rately by race, to calculate how much of the gap can be attributed to differences in characteristics that are associated with wealth accumulation, such as family income and education (Blau and Graham 1990; Oliver and Shapiro 1995; Menchik and Jiana-koplos 1997; Avery and Rendall 1997; Conley 1999). The resulting estimates, how-ever, turn out to vary widely depending on whether coefcients are used from the
regression equation estimated for whites or from that for African Americans. That is, because the wealth of whites rises more steeply than that of African Americans with increases in such characteristics as income and education, the lower mean levels of these characteristics for African Americans “explain” much more when the coef-cients for the whites are used. Altonji and Doraszelski (2001) nd this to be true even when long histories are used to construct improved income and demographic variables.2
The fact that the explanatory power of the means-coefcient analysis depends on which set of coefcients is used is less than satisfying, however, as a more complete understanding of the forces behind the racial wealth gap as well as the efcacy of various public policies designed to narrow it hinge on what causes the wealth func-tions to differ so much by race in the rst place. That is, do white families have higher levels of wealth than African American families at comparable age levels because they have received greater amounts of inheritances and other intergenera-tional transfers, because they devote larger amounts of income to saving, or because they earn higher rates of returns on assets? Unfortunately, with data on family wealth for only one point in time, it is difcult to do more than speculate as to which of these three categories holds the key to racial wealth inequality.
Making use of the supplements on household wealth carried out by the Panel Study of Income Dynamics (PSID) in 1984, 1989, and 1994, this study follows a different tack. By following families over time, it is possible to reconstruct the path of wealth accumulation and thereby attribute observed increases in wealth to inter-generational transfers, saving out of income, or the appreciation of existing assets. Comparisons of patterns of wealth accumulation across races enable the question of the sources of the differences in the levels of wealth to be addressed more directly. The paper by Hurst, Luoh, and Stafford (1998) also contains some analysis of racial differences in wealth accumulation, but this subject is not the main focus of their study. Although they do assess whetheroverallwealth changes vary by race, they do not attempt to decompose these changes into the three key components of wealth accumulation noted above, nor do they examine differences by race with respect to these components.
We nd, as expected, that between 1984 and 1994 inheritances raised the rate of wealth accumulation of whites relative to that of African Americans. Whites devoted a greater share of their income to saving, but racial differences in saving rates are not signicant, once we control for income. Though our results may be period-spe-cic, we also did not nd evidence that the rate of return to capital was greater for whites than for African Americans.
Counterfactual experiments suggest that African Americans would have gained signicant ground relative to whites during the period under examination if they had inherited similar amounts, had comparable levels of family income, and, more speculatively, had portfolio compositions similar to those of whites. In addition, the wealth gap would have narrowed had the share of income that African Americans devoted to saving been as high as that for whites; however, as noted, much of the
196 The Journal of Human Resources
difference in saving rates is attributable to the fact that (average) saving rates in the data rise with income and African Americans have lower incomes than whites, rather than to whites having a higher saving rate conditional on income level.
II. Data
A. Measurement of Wealth
The main source of data used in this study is the PSID, which has followed about 5,000 U.S. families since 1968, interviewing them annually. As the PSID was origi-nally based on two subsamples, one of which oversampled the low-income popula-tion, the use of weights enables analysts to make estimates that are representative of the nonimmigrant U. S. population and its subpopulations. We use family weights for all calculations, even for multivariate analysis, as did Hurst, Luoh, and Stafford (1998), in their examination of the same data. While the use of weights for regression analysis is not without controversy, their application seems imperative here. As Hill (1992) notes in her monograph on the PSID, one should not use the low-income sample without weights if the dependent variable is income or another variable di-rectly related to the PSID’s oversampling criteria.
Data on wealth were collected via special supplements carried out in 1984, 1989, and 1994;3a sequence of questions falling under the PSID rubric “active savings,” used to collect information on ows of money into and out of different assets, was included in 1989 and 1994 (Hurst, Luoh, and Stafford 1998; Juster, Smith, and Stafford 1998). For the purposes of this study, the PSID has several key advantages over other data sets available to study race differences in wealth. First and foremost, given that families are followed over time and that questions are asked about move-ments into and out of assets, one can, subject to certain caveats that will be discussed subsequently, attribute changes in net worth over time to components due to intergen-erational transfers, saving, and capital gains. Second, in part because the PSID con-tains an oversample of the low-income population, the number of African American families is larger than in the Survey of Consumer Finances (SCF). Third, presumably owing to the rapport that PSID interviewers have developed with respondent families over time, the rate of item nonresponse in the wealth questions is relatively low, no small consideration given the reluctance of many families to divulge information on their net wealth (Hurst, Luoh, and Stafford 1998).
Stafford (1998) nd that the PSID wealth data for 1989 stack up well next to those from the same year’s Survey of Consumer Finances through the 98thpercentile. A second limitation of the PSID is that wealth components are grouped into seven broad categories (or eight if one includes net equity in the home, information on which is collected annually), just a small fraction of the number of categories in the SCF; more detailed questions and the probing that accompanies them are thought to lead to a more accurate reporting of wealth.
Net worth is measured in the PSID by adding the net values of the home, real estate other than the main residence, the farm or business, and vehicles together with holdings in stocks, checking and saving accounts and “other savings,” and then subtracting nonmortgage debt. Details on the assets and liabilities included in each category can be found in the appendix. The appendix may be accessed on theJHR website:www.ssc.wisc.edu/jhr/.The fact that social security and pension wealth are excluded is an important caveat to keep in mind when interpreting the results, a point to which we return in the conclusion.
In order to understand in some depth how wealth accumulation and its components differ by race, it is essential to have information not only on family wealth at different points in time, but also enough additional details to determine the path a family followed in order to arrive at its net worth.4Questions about the market value of the main home and the remaining principal of the mortgage are asked each year. In 1989 and 1994, in its active saving questions, the PSID also asked respondents about a number of different types of nancial transactions over the previous ve years including: the amount invested in a business, in stocks or in real estate other than the main home; the value of additions to the main home or other real estate; and the value of gifts or inheritances. Details on the active saving questions are contained in the appendix on theJHRwebsite.
Information on asset levels and ows enables a division of changes in net worth into saving, capital gains, and transfers. For each asset, the change in value over a period can be divided into two parts—the capital gain and the amount of additional funds invested in that asset, which we term gross saving. Details of the algorithm used are contained in the appendix on the JHRwebsite, but the basic approach is as follows: For those assets for which the amount of the net inow—that is, the gross saving in that asset—is known, it is straightforward to calculate the capital gain, as it is simply the difference between the asset’s change in value over the period and the net inow. For assets for which nothing is known about the net inow, an appropriate market-based rate of return is assigned in order to calculate the amount of the capital gain, and, for these assets, the amount of gross saving is calculated as the difference between the change in the value of the asset over the period and capital gains on the asset. Summing over the group of assets, one arrives at a total for capital gains and one for gross saving.
198 The Journal of Human Resources
As the description indicates, gross saving is not the same as saving traditionally dened as the difference between income and expenditures, because gross saving can be funded by any source of funds, not just income. As a result, to arrive at an estimate of the amount of saving that comes directly out of income, it is necessary to subtract from gross saving the other ows into the household, the largest of which is inheritances and other gifts. We will refer to gross saving minus inows from inheritances (and other sources) simply as saving. It is worth stressing that, though closely related, our measure of saving differs from the concepts of active saving referred to in PSID literature and used in the analyses of Hurst, Luoh, and Stafford (1998) and Juster, Smith, and Stafford (1998). There are two main differences be-tween our approach and that detailed in Survey Research Center (1992). First, we divide the change in net equity of the home (less the value of any home improve-ments) into a portion that is saving (the reduction in mortgage principal) and one that is capital gains (the change in the value of the house), rather than attributing the entire amount to capital gains. Second, for the assets for which there are no specic questions about inows—those other than the main home, other real estate, farm/business, and stocks—the PSID approach implicitly assumes that changes in net value are entirely attributable to saving, rather than allocating some portion into capital gains by applying a market-based rate of return, as we do. In any case, with either method, it is apparent that saving can potentially ow into any assets, and not just those for which there are specic questions in the PSID’s active saving module.
B. Sample Selection
Implicit in the discussion of the measurement of changes in wealth has been an assump-tion that the composiassump-tion of families stays the same over time, a static view of households that is clearly not accurate. There is much ux among families, owing to marriage and divorce, births and deaths, children leaving the parental home, and elderly parents joining the households of their adult children. In order to prevent changes in household composi-tion from wreaking havoc with the data—for example, in most cases a child leaving the household would suffer a large loss in household wealth—we follow the approach of Hurst, Luoh, and Stafford (1998) and Juster, Smith, and Stafford (1998) and include only those families where the head of household stays the same in the longitudinal samples used to examine wealth accumulation.
Tracking only those households where the head does not change has the impact of selecting an older and more stable population. Comparisons with the full sample, shown in Table 1 of the appendix on the JHRwebsite, indicate that those in the longitudinal samples—for 1984– 89, 1989– 94, and 1984– 94— are wealthier, on av-erage, than those in the cross-sectional samples. Even so, it is evident that trends over time in wealth ratios by race, at the mean and median, are affected very little by the requirement of household stability, though there is a very slight tendency for the ratio to move in favor of African Americans. For instance, the mean wealth ratio in the cross-sectional samples is 0.19 in 1984, 0.21 in 1989, and 0.20 in 1994, while that for the longitudinal sample for 1984– 94 is 0.19 at the start of the period, 0.22 at the midpoint, and 0.21 at the end.
have an additional requirement that those in the longitudinal sample not undergo extreme changes in wealth over a ve-year period. Thus, in analyses where the results are sensitive to outliers, families at the top and bottom 1 percent in terms of wealth appreciation are trimmed from the sample. The trimming is done both because out-liers can distort the results for the rest of the sample and because they are likely to have above-average levels of measurement error, given that complicated portfolios may be involved. As any such sample restriction is to some extent arbitrary, the results were redone both with more and less stringent criteria.
The trimming of the sample removes a higher proportion of whites than African Americans at both ends of the spectrum; the net impact is that the trimmed samples have higher mean wealth ratios than the untrimmed longitudinal samples and the cross-sectional samples. In addition, the trimming results in a rise in mean wealth ratios during the 1989– 94 period of 4–5 percentage points, depending on the sample, compared with the virtual stability noted above for the other samples. When impor-tant, we note the impact of the trimming on our ndings. Additional details on the rules for following households can be found in the appendix on theJHRwebsite.
III. Patterns of Wealth Accumulation by Race
A. Background
Historically, U.S. poverty policy has focused on income adequacy. But by the late 1980s, support began to grow for the view that poverty policy could only be effective if it focused as well on narrowing the gap between the asset rich and the asset poor. The movement for a wealth-based poverty policy has since gained additional mo-mentum as the nation continues to reform its antipoverty policy, both in intellectual circles and among policymakers, and some changes in asset policies have already been made (Sherraden 1991; Oliver and Shapiro 1995; Ackerman and Alstott 1999; Schreiner et al. 2001).
The policies— both those proposed and the limited reforms already imple-mented—represent several, sometimes overlapping approaches to raising wealth ac-cumulation— among African Americans specically or among the poor where Afri-can AmeriAfri-cans are overrepresented— through some combination of raising the rate of capital gains, encouraging additional saving, or diminishing the inequality-increasing impacts of intergenerational transfers of wealth.
200 The Journal of Human Resources
to credit, other proposals for raising ownership of homes and small businesses have involved providing greater incentives for saving.
Prominent in the policy discussion have been the proposals of Sherraden (1991), who, arguing that antipoverty policy should be focused on the accumulation of wealth rather than on raising levels of income and consumption, advocated the estab-lishment of individual development accounts (IDAs) that can be used to nance not only home ownership, but education, business startups, and retirement. Related concerns have been raised that asset limits on the receipt of income from Aid to Families with Dependent Children (AFDC), its successor, Temporary Assistance for Needy Families (TANF), and other means-tested programs discourage saving by the poor (Hubbard, Skinner, and Zeldes 1995). A number of states have responded to the increased exibility given to states under TANF by introducing IDAs and re-laxing assets limits (Hurst and Ziliak 2001).
Finally, though, the passage of the 2001 federal tax act moves the nation in the direc-tion of taxing wealth less and not more, others have called for taxes on asset holdings, in part to reduce inequality in inherited wealth (Wolff 1996; Ackerman and Alstott 1999).
Despite the existence of these and other proposals, there is actually little evidence both on the extent to which these wealth-based policies address the underlying causes of the racial wealth differential as well as on the potential for these proposals to reduce it, gaps we hope to partially ll with the analysis that follows. Why might patterns of wealth accumulation differ by race? Most obvious is that racial wealth gaps in the past imply that younger generations of African American families will inherit from their parents smaller amounts than their white counterparts (Menchik and Jianakoplos 1997; Avery and Rendall 1997).
The rate of return to capital may vary by race because of a combination of differences in portfolio composition and differences in the rate of return to specic assets. Implicit in proposals to shift the portfolios of African Americans toward assets such as homes and businesses is that African Americans face barriers to the acquisition of these assets, owing to discrimination in mortgage and small business credit markets, customer dis-crimination, limited access to information about investment opportunities and other fac-tors (Munnell et al. 1996; Blanchower, Levine, and Zimmerman 1998). Moreover, if children’s asset allocations are inuenced by those of their parents, the historically lower likelihood of African Americans to hold such nancial assets as stocks and transaction accounts will persist over time (Chiteji and Stafford 1999).
Though the substantial differences by race in asset allocation that we document below are well-known, the evidence on rate of returns is rather scanty. A partial exception is the housing market, where earlier research, summarized by Blau and Graham (1990), concluded that homes in African American neighborhoods have appreciated at a lower rate than homes in predominantly white areas. More recently, however, in an examina-tion of mean housing prices by race using the decennial Censuses for 1960 to 1990, Denton (2001) nds that the ratio of the value of African American to white homes, while still well below unity, reached its highest level in 1990.5
Interestingly, economic theory does not offer unambiguous predictions about the ef-fect of racial discrimination in the small business credit market with respect to the rate of return to business ownership for African Americans relative to whites. If such discrim-ination occurs in the form of higher credit costs, it can lower the relative rate of return. If, however, a lack of access to credit causes African Americans to be unable to start businesses that a similarly qualied white would be able to, then, on average, African American entrepreneurs able to start businesses would be expected to be better qualied than their white counterparts, and thus have a higher rate of return.
The various models that have been developed to study the behavior of consump-tion have implicaconsump-tions for the pattern of household saving rates by race (Browning and Lusardi 1996; Browning and Crossley 2001). Life-cycle models predict that, because African Americans have shorter life expectancies and larger families, they will consume at a faster rate than whites. Though economists have not yet reached a consensus on the importance of precautionary saving and the appropriate proxy for the uncertainty that generates it (Browning and Lusardi 1996; Carroll, Dynan, and Krane 1999), African Americans experience greater income uncertainty (Gittle-man and Joyce 1996; Mazumder 2001). In buffer-stock saving models, the volatility of income increases the necessity of building up savings, but also makes it more likely that reserves will have to be drawn down (Carroll 1997).
Differences by race also may emerge because saving as a proportion ofcurrent income tend to rise with current income, and whites have higher levels of current income than do African Americans. In standard models, this relationship between saving rates and current income may occur because households with high levels of transitory income may be saving at a faster clip to offset expected lower income in the future (Dynan, Skinner, and Zeldes 2000). A number of other economic explanations also have been offered, in addition to an array of psychological and sociological theories (Beverly 1997; Carney and Gale 1999). These economic theories include that relative to the rest of the population, low-income households may be more impatient (Lawrance 1991), have a higher Social Security replacement rate, and have more limited access to institutionalized saving mechanisms such as 401(k) plans. Further, the saving behavior of African Ameri-cans may be more affected than that of whites by the presence of asset-based, means-tested social insurance programs, because of the higher concentration of African Ameri-cans in the low-income population. Programs such as AFDC/TANF and Medicaid may depress saving by providing a consumption oor and thereby reducing income uncer-tainty and thus the need for precautionary saving, and by imposing assets limits that, in some circumstances, effectively tax assets at a rate of 100 percent for those who are income-eligible for a program but have savings above the threshold (Hubbard, Skinner, and Zeldes 1995).
B. Wealth Accounting Framework
To examine differences in wealth accumulation by race, we employ a simple wealth accounting framework. The wealth of a household at any point in time can be repre-sented by the following formula:
202 The Journal of Human Resources
(1) Wft 5
^
Aa51 paftWaft
whereW5net worth in constant dollars,prepresents the share of each asset in the portfolio, fis the index for family,tfor time, andafor asset. Assuming that there are no changes in portfolio allocation, the change in wealth between periods tandt11can be expressed as follows:
(2) DWf5
^
Aa51
raftpaftWaft1sftIft1Tft
wherer represents the rate of return, s the rate of saving out of income,I family income andTthe amount of inheritances or gifts received by the family.6It is possible that gifts can come from nonrelatives, though for ease of exposition we will some-times refer to them as family transfers. It may be worth emphasizing that given what may be substantial differences across families in the path of asset prices within the broad groups of assets noted above, the rates of return are family- and period-spe-cic,. Finally, the rate of change in wealth is the ratio of the Equation 2 to Equation 1:
Formula 3 makes clear that the rate of accumulation for a family starting the period with wealthWftdepends on ve factors: 1) the rates of returns on assets; 2) portfolio
allocation; 3) the saving rate; 4) the income level; and 5) the amount of transfers. All ve factors may differ by race and thus are potential causes of disparate patterns of wealth accumulation by race.
Because our sample restriction that the head of household must be the same over time does allow for some changes in household composition that have an important inuence on wealth—for example, marriage, divorce, and death of spouse— it is also necessary to take account of changes in household composition on wealth.7In addition, as noted above, ows of funds related to pension annuities are not included in net worth and need to be tracked as well. Augmenting Equation 3 to take into account the effects of changes in household composition and of ows related to pension annuities, we have:
where H is the net change in wealth resulting from assets being brought into or removed from family holdings as a result of changes in household composition and Pis the net ow of funds out of pension annuities.
C. Descriptive Analysis
1. Wealth Levels
Before considering racial differences in wealth changes, we rst make use of the cross-sectional samples to look briey at racial differences in levelsof wealth and in portfolio composition. Our ndings here are consistent with those of Blau and Graham (1990) and Hurst, Luoh, and Stafford (1998), among others. As shown in Table 1, the gap in wealth levels between African Americans and whites is stagger-ingly wide, regardless of whether it is measured in terms of mean or median holdings. In 1994, the average African American family had a net worth of $38.0 thousand,8 about one-fth of the average net worth of $192.9 thousand for white families. Per-haps even more jolting is the comparison in terms of medians. In 1994, the African American family at the 50thpercentile had a net worth of $8.2 thousand, less than one-eighth of the median wealth for whites.
Examining wealth by age, one sees that the prole for whites has the traditional hump shape—with wealth increasing through the prime earnings years and then tailing off, while that for African Americans shows a greater tendency to be mono-tonic with age.9 As measured by means, the ratio of African American to white wealth is highest for the families with heads in the youngest (0.35) and oldest (0.30) age groups, and much lower for those in families whose heads are in age groups where schooling has been completed, but retirement has not yet begun. It is striking to see how wide the gaps in median wealth are even at young ages, with African American families having about one-seventh the wealth of their white counterparts in the youngest age category. The wealth ratio does not rise substantially until the 45–54 age group. The yawning race gap for young household heads, even before a family has had time to accumulate assets through saving from its own income, hints at the importance of intergenerational transfers—both inheritances and inter vivos gifts—in causing young white and African American household heads to start off on an unequal footing (Wilhelm 2001).
The pattern of racial wealth differences changes little when education is controlled for. The mean ratios within the four education groups shown in Table 1 are in the neighborhood of 0.25. Though the wealth ratios by education group are a little higher than the 0.20 for all families, it is clear that the racial wealth gap is primarily attribut-able to large differences at the same educational level, rather than to the fact that there is a smaller portion of African Americans relative to whites in the wealthier, higher-education groups. In a broadly similar fashion, neither marital status nor
8. All dollar amounts are converted into 1998 dollars using the Bureau of Labor Statistics’s Consumer Price Index-All Urban Consumers (CPI-U).
204
T
h
e
Journal
of
H
um
an
R
es
ourc
es
Table 1
Wealth by Characteristics of Head and Family Income, 1994
Mean Values Median Values
African African
Americans Whites Ratio Americans Whites Ratio
All families 38.0 192.9 0.20 8.2 67.7 0.12 Age of head
Less than 25 9.7 28.1 0.35 0.7 4.7 0.14
25–34 16.7 73.3 0.23 2.4 16.5 0.15
35–44 27.9 143.3 0.20 4.4 52.8 0.08
45–54 60.9 268.5 0.23 30.8 115.9 0.27
55–64 51.8 330.4 0.16 35.6 185.6 0.19
651 79.5 265.3 0.30 34.1 121.0 0.28
Education of head
Less than high school 24.7 108.4 0.23 0.7 36.2 0.02 High school graduate 35.0 133.8 0.26 7.7 59.4 0.13 Some college 43.5 178.3 0.24 13.7 72.6 0.19 College graduate 85.1 344.6 0.25 29.1 121.0 0.24 Marital status of head
Married 75.6 268.9 0.28 31.9 111.1 0.29
Not married 25.9 100.8 0.26 3.3 26.6 0.13 Income quartile
First 19.2 74.0 0.26 0.3 13.5 0.02
Second 41.0 105.4 0.39 12.1 45.1 0.27
Third 49.1 151.7 0.32 27.5 73.1 0.38
Fourth 116.2 434.8 0.27 52.8 191.9 0.28
Notes:
income class has much explanatory power, as the racial wealth gaps are primarily attributable to differences within groups dened by these variables.
In addition to racial differences in wealth levels, there are also important racial differences in portfolio composition, as shown in Table 2. In 1994, only 2.1 percent of African American families had assets in a business or farm, less than one-sixth the comparable share for whites (13.1 percent). The lower rate of self-employment for African Americans than for whites is consistent with past research (Fairlie 1999; Fairlie and Meyer 1996, 1997). Fewer than two-fths of African American families owned their own residences (37.8 percent), well below the nearly two-thirds for whites (65.8 percent). Finally, only 10.4 percent of African American families had any holdings in stock. Though there was an increase in the share of African Ameri-cans holding stocks from 6.9 percent in 1984, the rise is well below that for whites over the same time span, from 27.1 to 37.5 percent.
Despite the much lower rate of home ownership among African Americans than the rest of the population and the lower market value of African American homes (Long and Caudill 1992; Charles and Hurst forthcoming), home equity carries a much heavier weight in their portfolios, accounting for 45.8 percent of total wealth in 1994, compared to 28.6 percent for whites. It is evident that home equity’s heavier weight in African American portfolios is due to the fact that whites are more likely to have signicant holdings in other assets, as the value of home equity for whites was more than three times that for African Americans in 1994. Stocks as of 1994 were the second most important asset group in white portfolios, having more than doubled their share over the decade to reach 19.7 percent of total wealth. The share of wealth in stocks also doubled for African Americans, but because it started from a much lower base, it was still well below 10 percent in 1994. Not surprisingly, the share of white wealth in businesses and nonhome real estate is much greater than that for African Americans.
2. Wealth Accumulation
We now turn to an examination of patterns of wealth accumulation using the longitu-dinal samples. For the 1984– 94 trimmed sample, average wealth grew more quickly for African Americans than for whites, 71 percent versus 51 percent, leading to a rise in the mean wealth ratio to 0.28 from 0.25, as shown in Table 3. At the same time, there was a similar increase in the race wealth ratio at the medians, though not at the 25thand 75thpercentiles. It is instructive to note that the ratio of African American to white wealth climbs steeply as one moves from the median to the 75th percentile, indicating that the upper part of the distribution is less compressed, in relative terms, for African Americans than for whites. The importance of the upper tail in explaining movements at the mean is a theme that will recur in the analysis of patterns of wealth accumulation for African Americans.
206
T
h
e
Journal
of
H
um
an
R
es
ourc
es
Table 2
Portfolio Composition by Race, 1984, 1989, and 1994
1984 1989 1994
African African African
Americans Whites Americans Whites Americans Whites
Percent Percent Percent Percent Percent Percent Percent Percent Percent Percent Percent Percent
with of with of with of with of with of with of
Asset type asset wealth asset wealth asset wealth asset wealth asset wealth asset wealth
Main home 37.1 55.2 62.9 33.0 37.9 46.5 63.9 31.4 37.8 45.8 65.8 28.6
Real estate 7.0 9.5 21.9 16.2 8.1 8.0 21.0 18.3 5.4 8.6 18.8 16.1
Business 1.2 4.6 12.7 19.9 1.8 18.1 13.2 17.9 2.1 3.1 13.1 14.4
Stock 6.9 3.9 27.4 8.5 6.4 2.7 31.1 10.3 10.4 8.3 37.5 19.7
Checking/saving 44.6 9.8 86.1 14.4 48.1 12.6 86.4 13.9 40.8 13.2 82.2 12.9
Vehicles 56.7 13.4 87.1 6.3 58.2 12.7 87.1 5.8 59.8 14.7 87.7 6.3
Other savings 13.5 8.8 24.7 3.8 13.9 5.2 28.0 4.6 13.3 13.7 25.3 5.6
Debt 44.0 5.2 46.6 2.1 46.6 5.8 50.7 2.1 40.0 7.4 49.7 3.6
Notes:
G
ittle
m
an
and
W
olff
207
Start of period End of period
Percentile Percentile
Mean 25th 50th 75th Mean 25th 50th 75th
1984–89
African Americans 30.1 0.0 4.4 37.7 39.8 0.0 9.2 48.0
Whites 133.5 15.7 70.6 173.4 176.2 24.3 90.7 227.4
Ratio (African American to White) 0.23 0.00 0.06 0.22 0.23 0.00 0.10 0.21
1989–94
African Americans 34.8 0.0 7.9 39.6 47.4 0.0 11.2 55.0
Whites 155.5 15.8 74.9 209.0 177.0 23.1 91.3 232.1
Ratio (African American to White) 0.22 0.00 0.11 0.19 0.27 0.00 0.12 0.24
1984–94
African Americans 31.4 0.0 5.8 41.7 53.6 0.0 13.2 59.4
Whites 126.7 19.0 76.9 180.4 191.1 34.1 111.0 267.3
Ratio (African American to White) 0.25 0.00 0.08 0.23 0.28 0.00 0.12 0.22
Notes:
208
T
h
e
Journal
of
H
um
an
R
es
ourc
es
Table 4
Summary Statistics on Change in Wealth and Its Components, 1984–94
African Americans Whites
Share of Share of
Percentile mean Percentile mean
change change
Components of Wealth Change Mean 25th 50th 75th (percent) Mean 25th 50th 75th (percent)
1984–89
Total 9.7 24.5 0.4 13.4 100.0 42.7 212.5 9.3 65.8 100.0
Saving 4.3 23.4 0.2 8.6 44.3 21.7 28.0 7.2 40.3 50.9
Capital gains 5.1 21.4 0.0 1.5 52.9 12.9 216.5 0.0 30.2 30.2
Inheritances 0.3 0.0 0.0 0.0 3.3 4.3 0.0 0.0 0.0 10.1
Change in household composition inows 20.1 0.0 0.0 0.0 21.2 3.4 0.0 0.0 0.0 7.9
Net inows from annuities 0.1 0.0 0.0 0.0 0.7 0.4 0.0 0.0 0.0 1.0
1989–94
Total 12.5 26.9 0.0 17.2 100.0 21.5 223.2 4.7 51.8 100.0
G
ittle
m
an
and
W
olff
209
Change in household composition inows 20.4 0.0 0.0 0.0 22.8 0.2 0.0 0.0 0.0 0.8
Net inows from annuities 0.1 0.0 0.0 0.0 0.4 21.3 0.0 0.0 0.0 26.2
1984–94
Total 22.2 24.4 0.9 25.8 100.0 64.4 216.9 20.5 109.9 100.0
Saving 12.2 23.1 1.0 20.4 54.8 42.4 216.1 14.9 75.0 65.9
Capital gains 9.0 26.9 0.0 4.0 40.7 11.7 227.1 0.2 45.3 18.1
Inheritances 0.7 0.0 0.0 0.0 3.1 9.2 0.0 0.0 0.0 14.3
Change in household composition inows 0.0 0.0 0.0 0.0 0.2 3.5 0.0 0.0 0.0 5.4
Net inows from annuities 0.3 0.0 0.0 0.0 1.2 22.4 0.0 0.0 0.0 23.7
Notes:
210 The Journal of Human Resources
which we do observe. Below we speculate on the effect the inclusion of retirement wealth would have on our results.
Given the vast gap between the races in mean wealth levels, it is not surprising that in each period the overall absolute climb in wealth is greater for whites than for African Americans, and virtually always the case that increases in each of the ve categories are larger as well. Of greater interest is the relative contribution of each category. Though each period has its particularities, several interesting ndings come to the surface. First, inheritances played almost no role in the gains of African Americans over the 1984– 94 period, contributing 3 percent of their increase in wealth, versus 14 percent for whites. (As noted in the appendix on theJHRwebsite, the PSID asks only about inheritances that are in excess of $10,000. Below we exam-ine the issue of whether the presence of a threshold at $10,000 biases these results.) It should be stressed that the question of how much inheritances contribute to racial differences in wealthaccumulationis a very different one from the extent to which transfers are responsible for racial differences in wealth levels, addressed in Menchik and Jianakoplos (1997) and Avery and Rendall (1997). Only inheritances that occur during the period are considered here; thus, we ignore the appreciation of gifts received prior to 1984.
Second, over the time span examined, there is no evidence that capital gains play a more importantrelativerole for whites than for African Americans. For the period as a whole, in fact, capital gains account for 41 percent of the increase in wealth for African Americans, more than double the 18 percent share for whites. Third, the contribution of saving to wealth accumulation is somewhat greater for whites (66 percent) than for African Americans (55 percent). Finally, among whites, changes in household composition are responsible for a nonnegligible portion of wealth accu-mulation (5 percent),10 whereas changes in household composition make virtually no contribution to wealth gains among African Americans.11
The positional statistics on changes in components of wealth, also shown in Table 4, make readily apparent the substantial heterogeneity of wealth accumulation behav-ior within each racial group. Though this diversity comes as no surprise in the case of inheritances—received by only 12 percent of whites and 1 percent of African Americans in the 1984– 94 sample—it is also apparent in the case of saving: For whites, nearly two-fths of this sample actually dissaved, and for African Americans it was nearly one-half (gures not shown). Consistent with our nding above of less compression in the upper part of the wealth distribution for African Americans than for whites, the distribution of capital gains is also more dominated by the right tail for African Americans than for whites. For all periods, the mean for capital gains among African Americans substantially exceeds its value for the 75thpercentile, indi-cating that a small share of the distribution is exhibiting great inuence on the mean.
Table 5 offers another method of assessing racial differences in wealth accumulation over the 1984–94 period, focusing on rates rather than on absolute levels. (In all cases where mean rates are given, they are calculated by rst summing the numerator and denominator over all families, rather than averaging the rates calculated for individual families.) Despite the modest rise noted above in the mean wealth ratio over the entire ten-year span, one cannot reject the hypothesis that the two races had the same rate of wealth appreciation over the 1984– 89 period and the full 1984–94 period, though the hypothesis can be rejected for the 1989–94 period by itself. However, because of the importance of the upper tail in the African American wealth distribution, the results are quite different at the median. Over the full decade, the rate of wealth appreciation is 35.4 percent at the median for whites, much larger than and statistically different from the 6.1 percent rise at the median for African Americans.
In their analysis of changes in wealth between 1989 and 1994, Hurst, Luoh, and Stafford (1998, tables 21–23), using both OLS and median regressions, nd a statisti-cally signicant difference by race in only one out of a number of different specica-tions. Though we both make use of the same underlying wealth data, the two sets of results are difcult to compare because the variable of interest differs (percentage change versus change measured in dollar amounts). Moreover, Hurst, Luoh, and Stafford also include controls in their regressions for permanent income and in some cases portfolio composition and active saving inows, and there are some differences in the trimming of outliers for OLS regressions.
There are also notable differences by race in the individual components of wealth accumulation. We calculate that whites have a higher average saving rate than Afri-can AmeriAfri-cans, with this difference being statistically signiAfri-cant in two out of three cases. For the entire 10-year span, the saving rate for whites is nearly double that of African Americans, 7.6 percent of family income over the 1984– 94 period com-pared to 3.9 percent. An idea of how these saving rates translate into wealth gains is offered by multiplying them by the ratio of income accumulated over the 10-year span to wealth at the start of the period, which is 4.38 for whites and 9.84 for African Americans. Thus, because of a higher income-to-wealth ratio, the slower saving rate of African Americans actually translates into a faster increase in wealth, 38 percent versus 33 percent. Though the differences in saving rates at the median are somewhat smaller than those at the mean, they are still present and statistically signicant at the 1 percent level.
212
T
h
e
Journal
of
H
um
an
R
es
ourc
es
Table 5
Summary Statistics for Rates of Change in Wealth and Its Components
As a proportion of total wealth at start of period
Net Inows from Changes in
Rate of wealth Rate of return Inheritances and Household Net Inows appreciation Saving rate on capital Gifts Composition from Annuities
Mean Median Mean Median Mean Median Mean Median Mean Median Mean Median
1984–89
African Americans 32.2 2.6** 3.0*** 0.3*** 17.0 0.0 1.1*** 0.0 20.4 0.0 0.2 0.0 Whites 32.0 19.0 8.2 3.7 9.7 0.0 3.2 0.0 2.5 0.0 0.3 0.0 1989–94
African Americans 36.0* 21.9 5.7 0.7*** 11.5** 0.0 0.9*** 0.0 21.0* 0.0 0.1* 0.0 Whites 13.8 6.9 8.2 2.9 22.2 0.0 2.7 0.0 0.1 0.0 20.9 0.0 1984–94
African Americans 70.7 6.1** 3.9** 0.5*** 27.3** 0.0 2.2*** 0.0 0.1 0.0 0.8** 0.0 Whites 50.8 35.4 7.6 3.6 9.8 0.0 7.2 0.0 2.8 0.0 21.9 0.0
Notes:
All rates are expressed as percentages. Means rates are calculated as the average for the numerator divided by the average for the denominator. Median rates are the median of the ratio of the numerator to the denominator. Initial wealth is the denominator in all cases except for the saving rate, which is dened as saving divided by family income. Family rates are only calculated if the denominator is positive, which is always the case for family income but not for initial wealth. Hypothesis tests are based on bootstrapping. Calculations use the trimmed longitudinal samples for means and the untrimmed ones for percentiles (for details, see the appendix on the
the cause of the relationship between income and saving rates found by these and other authors. Instead, we would merely like to stress that the consistency of our ndings with those elsewhere helps to strengthen condence in the use of the PSID data to measure saving rates. Below we address the question of whether the saving rate differential persists after controlling for income and demographic characteristics that may inuence consumption needs.
Despite speculation that African Americans experience lower rates of return on assets, either because of barriers to acquiring assets that historically have had high returns or because of factors that may lower returns to specic assets, average rates of return on capital are actually higher for African Americans than for whites in our sample, and this difference in rates of return is statistically signicant in 1989– 94 and for the full ten-year span. It is important to note once again that the difference in rates of returns by race is driven by higher returns for African Americans at the upper tails and that there is virtually no difference at the medians.
While caution is advisable in interpreting calculations using asset-specic rates of return by race, because of their sensitivity to outlying observations, we nd that a faster appreciation of the value of the main home contributed to the overall higher return for African Americans, particularly in the years 1984– 89. The higher appreci-ation in 1989– 94 may be due, in part, to whites having been hit harder than African Americans by the troubles in the California real estate market in the early 1990s, since the race gap in home appreciation is halved when California residents are excluded.12The tendency for the prices of African American homes to appreciate relative to those of whites over the decade is also consistent with the nding of Denton (2001) of a relative appreciation in the value of African American homes during the 1980s. Without longitudinal data, it is impossible to distinguish the impact of a rise in value of homes continuously held from that of a changing composition of homes (and homeowners). However, Denton’s attempts to take account of changes in composition through the use of synthetic cohorts still show a relative appreciation in the value of African American homes. In the 1989– 94 period, differences in rates of return by race are also attributable to differences in returns to other real estate— owing in part to a decline in the value of holdings by whites—and to a higher average rate of return for the small portion of African Americans owning stocks.
We should stress that we make no claim that the edge in average rates of return to capital experienced by African Americans is the norm. With such large differences in portfolio allocation, clearly much depends on the path of prices for the individual asset categories. In fact, it seems likely that whites beneted more than African Americans from the run-up in the stock market in the second half of the 1990s.
214 The Journal of Human Resources
the distribution that is truncated rises, the racial gap in the saving rate and capital gains tends to narrow. We now turn to multivariate analysis to explore whether the racial differences remain after controlling for other characteristics.
D. Multivariate Analysis
It is well known that multivariate analysis using wealth data poses special chal-lenges because of the skewness of the wealth distribution. In order to avoid the undue inuence of extreme observations, researchers have sometimes transformed the data by taking logarithms. Analysts who take this step must then make a decision with respect to the large proportion of observations that cannot be transformed because they are zero or negative, with some electing to truncate the sample, and others arbitrarily assigning a value, such as zero, for the log of zero or negative wealth (Carroll, Dynan, and Krane 1999). Irrespective of one’s view of such an approach, the use of a log transformation is not practical for an analysis of changes in wealth because of an even larger proportion of the sample with zeroes or negative numbers. For instance, for the 1984– 94 longitudinal sample, about 15 percent of the observa-tions have zeroes or negative numbers for the levelof wealth in 1984, while the corresponding share forchanges in wealth is more than twice that.
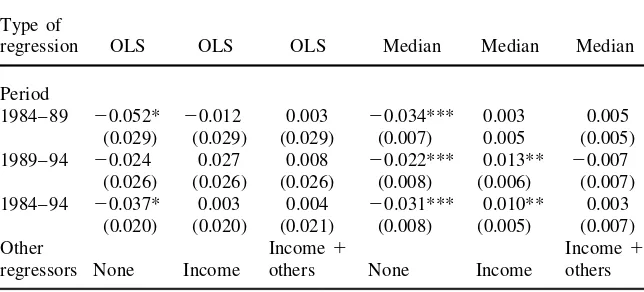
Instead of a log transformation we make use of two complementary approaches: The rst is quantile regression, which is not sensitive to outliers and thus can be used on the full longitudinal samples to examine the determinants of the rates of saving, capital gains and wealth appreciation at their medians. The second is OLS, which will be employed on the longitudinal samples with the top and bottom percen-tiles trimmed for an examination of tendencies at the means. For the analysis of saving rates, we rst run a baseline regression where a dummy variable for African Americans is the only independent variable, then add controls for income to see if any racial differences can be accounted for by income differences, and then include additional controls for age, education and sex of head, change in marital status, and number of children. The same controls are used for an analysis of inheritances. When the rate of return to capital and the rate of wealth appreciation are the dependent variables, controls for wealth and its square at the start of the period are also included. In Columns 1 and 4 of Table 6, we rst reproduce on the basis of OLS and median regressions, respectively, the earlier nding that with no controls whites save a higher share of their income than do African Americans. However, after accounting for income, we nd that this relationship no longer holds, as shown in Columns 2 and 5. In fact, for two of the three median regressions, the coefcients for African Ameri-cans become positive and signicant. As already noted, these results are consistent with those of Dynan, Skinner, and Zeldes (2000), who use the Survey of Consumer Finances and the Consumer Expenditure Survey in addition to the PSID to document a positive relationship between personal saving rates and lifetime incomes. As shown in Columns 3 and 6, adding the remaining demographic controls leaves none of the coefcients signicant, with the changes in the median regressions largely attribut-able to the fact, that conditional on income, saving rates rise somewhat faster with age for African Americans than for whites.
Table 6
Racial Differences in Saving Rates (African American2White), 1984– 94
Type of
regression OLS OLS OLS Median Median Median
Period
1984– 89 20.052* 20.012 0.003 20.034*** 0.003 0.005 (0.029) (0.029) (0.029) (0.007) 0.005 (0.005) 1989– 94 20.024 0.027 0.008 20.022*** 0.013** 20.007
(0.026) (0.026) (0.026) (0.008) (0.006) (0.007) 1984– 94 20.037* 0.003 0.004 20.031*** 0.010** 0.003
(0.020) (0.020) (0.021) (0.008) (0.005) (0.007)
Other Income1 Income1
regressors None Income others None Income others
Notes:
The saving rate is dened as the ratio of saving over the period divided by family income over the same time span. The racial difference is the coefcient on a dummy variable for African Americans. Standard errors are in parentheses. Total family income over the time span and its square are the income variables, while the other regressors are age of head and its square, sex and education of head, marital status at start and end of period, and number of children. The trimmed longitudinal samples are used for OLS and the untrimmed ones for median regressions (for details, see the appendix on theJHRwebsite). Regressions use PSID family weights multiplied by income at start of period.
* signicant at 10 percent level ** signicant at 5 percent level *** signicant at 1 percent level
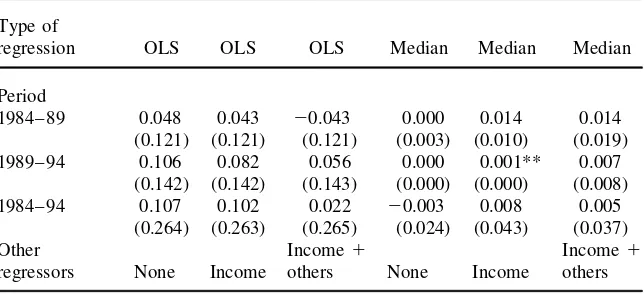
calculated only with respect to positive wealth. Thus, we are forced to exclude from the OLS analysis households with nonpositive wealth—about 15 to 17 percent of the sample, depending upon the period.13 Calculations (not shown here) reveal that the racial difference in mean rates of return to capital is somewhat smaller when only positive wealth holders are included. With this caveat in mind, we nd that the coefcient for African Americans is positive in the baseline OLS regressions, though the estimate is too imprecise to be signicant at conventional levels. Likewise, as we found in Table 5, signicant differences in rates of return are not evident at the median. This situation scarcely changes when additional controls are added, as the race coefcient is almost always positive but almost never estimated precisely enough to achieve statistical signicance.
216 The Journal of Human Resources
Table 7
Racial Differences in the Rate of Return on Capital (African American2White), 1984– 94
Type of
regression OLS OLS OLS Median Median Median
Period
1984– 89 0.048 0.043 20.043 0.000 0.014 0.014
(0.121) (0.121) (0.121) (0.003) (0.010) (0.019)
1989– 94 0.106 0.082 0.056 0.000 0.001** 0.007
(0.142) (0.142) (0.143) (0.000) (0.000) (0.008)
1984– 94 0.107 0.102 0.022 20.003 0.008 0.005
(0.264) (0.263) (0.265) (0.024) (0.043) (0.037)
Other Income1 Income1
regressors None Income others None Income others
Notes:
The rate of capital gains is dened as capital gains divided by initial wealth. Rates are calculated only if the denominator is positive. The racial difference is the coefcient on a dummy variable for African Americans. Standard errors are in parentheses. Total family income over the time span and its square are the income variables, while the other regressors are initial wealth and its square, age of head and its square, sex and education of head, marital status at start and end of period, and number of children. The trimmed longitudi-nal samples are used for OLS and the untrimmed ones for median regressions (for details, see the appendix on theJHRwebsite). Regressions use PSID family weights multiplied by wealth at the start of period. * signicant at 10 percent level
** signicant at 5 percent level *** signicant at 1 percent level
G
ittle
m
an
and
W
olff
217
Predicted Predicted Predicted Predicted Predicted Predicted Average Average Average Average Average Average Difference, Difference, Difference, Difference, Difference, Difference,
Censored Censored Censored Censored Censored Censored Period Coefcient at Zero as in Survey Coefcient at Zero as in Survey Coefcient at Zero as in Survey
1984–89 2748,015*** 28,726*** 28,647*** 2701,255*** 27,506*** 27,431*** 2628,738*** 25,161*** 25,098*** (56,307) (1,169) (1,173) (53,926) (1,077) (1,080) (49,997) (786) (786) 1989–94 2830,827*** 29,031*** 28,977*** 2784,920*** 27,658*** 27,607*** 2738,266*** 26,798*** 26,749***
(60,468) (1,502) (1,510) (58,472) (1,310) (1,315) (56,311) (1,165) (1,167) 1984–94 2761,886*** 217,204*** 217,128*** 2707,897*** 215,114*** 215,040*** 2643,932*** 213,032*** 212,961***
(50,996) (2,304) (2,312) (48,996) (1,999) (2,007) (46,697) (1,788) (1,792)
Other Income1
regressors None Income others
Notes:
Respondents are asked about dollar amount of inheritances only if they have received an amount of $10,000 or more in nominal currency. The coefcient shown in the table is for a dummy variable for African Americans from a Tobit regression, and reects differences in latent variables. Standard errors are in parentheses. “Predicted Average Difference” uses the Tobit results to predict differences by race in the amount of inheritances (in 1998 dollars), with censoring at zero and at $10,000 as in the actual survey. Standard errors are calculated by bootstrapping. Total family income over the time span and its square are the income variables, while the other regressors are age of head and its square, sex and education of head, marital status at start and end of period, and number of children. Trimmed longitudinal samples are used (for details, see the appendix on theJHRwebsite). Regressions use PSID family weights.
218 The Journal of Human Resources
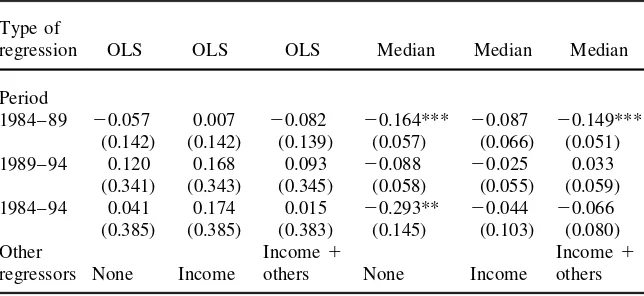
Table 9
Racial Differences in the Rate of Wealth Appreciation (African American – White), 1984– 94
Type of
regression OLS OLS OLS Median Median Median
Period
1984– 89 20.057 0.007 20.082 20.164*** 20.087 20.149*** (0.142) (0.142) (0.139) (0.057) (0.066) (0.051) 1989– 94 0.120 0.168 0.093 20.088 20.025 0.033
(0.341) (0.343) (0.345) (0.058) (0.055) (0.059) 1984– 94 0.041 0.174 0.015 20.293** 20.044 20.066
(0.385) (0.385) (0.383) (0.145) (0.103) (0.080)
Other Income1 Income1
regressors None Income others None Income others
Notes:
The rate of wealth appreciation is dened as the change in wealth divided by initial wealth. Rates are calculated only if the denominator is positive. The racial difference is the coefcient on a dummy variable for African Americans. Standard errors are in parentheses. Total family income over the time span and its square are the income variables, while the other regressors are initial wealth and its square, age of head and its square, sex and education of head, marital status at start and end of period, number of children and inheritances over the period. The trimmed longitudinal samples are used for OLS and the untrimmed ones for median regressions (for details, see the appendix on theJHRwebsite). Regressions use PSID family weights multiplied by wealth at the start of period.
* signicant at 10 percent level ** signicant at 5 percent level *** signicant at 1 percent level
appreciation of African Americans relative to whites. Because of this reduced gap and to the imprecision of the estimates, the OLS results do not show any statistically signicant differences by race. For the median regressions, the baseline regressions match the results of Table 5, where whites have a substantially higher rate of wealth appreciation for 1984– 89 and 1984– 94. The statistical signicance of this difference remains when other controls are added for 1984– 89, but not for 1984– 94. As noted above, in their multivariate analysis of wealth accumulation, Hurst, Luoh, and Stafford (1998) do not usually nd the coefcient for the race dummy to be statisti-cally signicant.
IV. Simulations and Sensitivity Analysis
A. Simulations
Americans been identical to that of whites with respect to the following dimensions: 1) portfolio allocation; 2) rate of return on capital; 3) saving as a share of income; 4) family income; 5) inheritance; and 6) changes in household composition. The experiments are performed both by changing one of these dimensions at a time and by changing all six simultaneously. We examine changes in mean values only be-cause of the difculty of conducting such experiments to examine counterfactuals for median wealth.
The traditional Blinder-Oaxaca method is based on a regression framework to divide racial wage differentials into a productivity component and a residual that is usually interpreted as resulting from discrimination. The difculty of knowing which wage structure would exist in the absence of discrimination is typically addressed by performing two decompositions— the rst using the regression coefcients for whites and the second using the regression coefcients for African Americans. In more recent work, Oaxaca and Ransom (1994) demonstrate that under certain as-sumptions it is appropriate to make the calculations using the wage structure derived from a regression that pools both races. Though our application is quite different because we employ the wealth accounting framework of Equation 3¢ rather than a regression framework and do not try to estimate the portion of the wealth gap attribut-able to discrimination, we follow an analogous approach. In particular, in our count-erfactual experiments we calculate what the racial wealth ratio would have been at the end of the period if the behavior of African Americans and whites were, on average, identical to that of the full sample. For example, in the saving rate simula-tions we recalculate the change in both African American and white wealth that would have occurred had the share of income devoted to saving for each race equaled that for the sample as a whole. We, thus, avoid the need to produce two sets of results—one where we assume that African Americans have the same saving rate as whites, and the other the converse. We have nonetheless checked the pooled re-sults against these two alternatives and nd little difference.
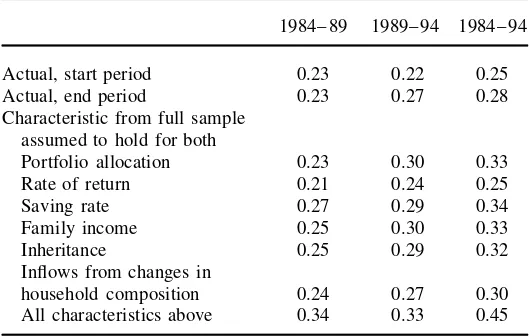
The most striking nding to emerge from the results of the 1984– 94 simulation shown in Table 10 is that decades would be required for the wealth gap to close or even for the wealth ratio to approach the income ratio, when one component is changed at a time. Indeed, even with the dramatic changes in behavior implied by these experiments (changes that no policy could easily accomplish), simulated Afri-can AmeriAfri-can wealth levels remain at just a fraction of those of whites. There are other ndings of note for the 1984– 94 period. First, raising the saving of African Americans either by equalizing the unconditional saving rates or by equalizing fam-ily incomes of African Americans and whites also would have very modest effects, raising the mean wealth ratio over the actual 1994 level by only 5 to 6 percentage points. However, on the basis of the regression analysis reported above in Table 6, the impact of equalizing the (conditional) saving rate would be reduced while that of equalizing family incomes increased if the simulations were performed with sav-ing as a function of income.
220 The Journal of Human Resources
Table 10
Mean Wealth Ratios Recalculated Under Counterfactual Assumptions: Accounting Framework Method
1984– 89 1989– 94 1984– 94
Actual, start period 0.23 0.22 0.25
Actual, end period 0.23 0.27 0.28
Characteristic from full sample assumed to hold for both
Portfolio allocation 0.23 0.30 0.33
Rate of return 0.21 0.24 0.25
Saving rate 0.27 0.29 0.34
Family income 0.25 0.30 0.33
Inheritance 0.25 0.29 0.32
Inows from changes in
household composition 0.24 0.27 0.30
All characteristics above 0.34 0.33 0.45
Notes:
Ratios refer to mean wealth for African Americans divided by mean wealth of whites. Calculations use PSID family weights and the trimmed longitudinal samples (for de-tails, see the appendix on theJHRwebsite).
Third, as noted earlier, eliminating racial differences in the rate of return on capital would actuallywiden(by 3 to 4 percentage points) the racial wealth gap by the end of the period. However, this result may be peculiar to the period under the study. In fact, the increase in the stock market since 1994 has probably pushed up the overall rate of return on capital for whites relative to African Americans because of the greater weight of stocks in the portfolio of the whites.
Fourth, equalizing inheritances and transfers between African Americans and whites would result in a ve percentage point increase in the racial wealth ratio. Fifth, standardizing for wealth inows related to household composition shifts would have little effect on the racial wealth gap.
B. Sensitivity of the Results
One method for examining the fragility of the results is to quantify the degree of measurement error that would need to be present to overturn the two results likely to be viewed with the most caution: that African Americans save at a lower rate and that they have a higher rate of return on capital than do whites. Because capital gains are determined primarily as a residual after accounting for the net additions to each asset (see the appendix on the JHRwebsite for details), there would have to be a combination of (relative) overreporting of gross saving by whites and underreporting by African Americans. If measurement errors were exclusively on the side of over-reporting, a reduction of nearly 40 percent in the amount we calculate for the gross saving of whites would be required to equalize saving rates by race. Conversely, with all the error coming from underreporting, the gross saving of African Americans would have to be understated by nearly 90 percent. Though errors of such magnitude cannot be ruled out, their large size makes them improbable. We can see of no reason, moreover, why the pattern of measurement errors needs to be an overreporting of saving by whites and an underreporting by African Americans.
In addition, it is possible to check our calculations that are based partly on the recall method over the ve-year period against an alternative method that uses almost exclusively the more reliable information reported at the time of each wave. The one exception is that we continue to make use of data on reports of inheritances over the preceding ve years. Because these are rare events, it is apt to be easier to recall these than to be able to reconstruct, for example, the net amount put into stocks. We perform this robustness check by redoing the experiments reported in Table 10 with a regression-based method. One can represent the changes in the wealth of familyfbetween periodtand periodt11(DWft) by the following equation:
(4) DWf5at1btWft1ctIft1dtTft 1ftXft 1eft
whereWftrepresents a family’s holdings at the start of the period,Iftis a vector for
family income and its square,Tftis the amount of inheritances or gifts received by
the family over the period, andXis a vector of controls for age, education and sex of the head of household, number of children, and marital status at the beginning and end of the period.14This reduced form equation, which is estimated separately by period, captures the important elements of the wealth-accounting framework above. Capital gains can be represented by btWft, wherebt represents the overall rate of
return on wealth between periodtand periodt11. Saving can be predicted by the change in wealth with respect to income. Inheritances are entered into the equation, but, in contrast to a strict wealth-accounting framework, are not assumed to change wealth dollar for dollar. In other words,dtcould be less than 1 if an inheritance is not completely saved, or greater than 1 if receipt of an inheritance is correlated with factors leading to faster wealth accumulation— for example, access to better business opportunities or superior nancial advice—for which the controls are not adequate. Under certain assumptions, the regression-based method can be used to conduct many of the same counterfactual exercises that are summarized in Table 10. For
14. One potential problem with this specication is that any measurement error in initial wealthWftwill
bias downwardbt. For the 1989– 94 period, we were able to address this by using wealth from 1984 as
222 The Journal of Human Resources
Table 11
Mean Wealth Ratios Recalculated Under Counterfactual Assumptions: Regression-Based Method
1984– 89 1989– 94 1984– 94
Actual, start period 0.23 0.22 0.25
Actual, end period 0.23 0.27 0.28
Characteristic from full sample assumed to hold for both
Portfolio allocation 0.22 0.26 0.28
Rate of return 0.21 0.25 0.24
Saving rate 0.39 0.47 0.67
Family income 0.35 0.37 0.45
Inheritance 0.24 0.33 0.35
Demographic 0.23 0.28 0.28
All characteristics above 0.57 0.71 1.04
Notes:
Ratios refer to mean wealth for African Americans divided by mean wealth of whites. The trimmed longitudinal samples are used in the estimation (for details, see the appen-dix on theJHRwebsite). Calculations use PSID family weights.
instance, again using an approach based on Oaxaca and Ransom (1994), one can substitute btfrom a regression on the whole sample for the race-specic ones and estimate what the change in the racial wealth ratio would have been in the absence of race differences in the rate of return to capital. Alternatively, the effect of differ-ences in family income can be calculated by substituting average family income for the sample as a whole for the race-specic levels.
The results of the regression-based decomposition, shown in Table 11, are qualita-tively quite consistent with those shown in Table 10. Setting the coefcients on family income and its square for each race equal to those for the sample as a whole, which corresponds to an equalization of the marginal propensity to save, leads to a boost in the racial wealth ratio, as does an equalization in the amount of inheritances and gifts. On the other hand, substituting the rate of return on assets among all families for the race-specic ones lowers the wealth ratios.