Racial Earnings Differentials
and Performance Pay
John S. Heywood
Patrick L. O’Halloran
A B S T R A C T
This paper presents an information model in which workers receiving output-based pay experience less racial earnings discrimination than those receiving time rates and supervisory evaluations. Tests using the National Longitudinal Survey of Youth reveal no racial wage differential among male workers paid output-based pay while confirming a significant differential among those paid time rates. In addition, the racial wage differential among those receiving bonus pay, usually based on supervisory evaluations, tends to be larger than for those not receiving such bonuses.
I. Introduction
While both racial earnings differences and payment methods have generated enormous literatures, the two subjects rarely interact. This paper argues that the observed racial earnings gap should be narrower among those receiving output-based pay such as piece rates and commissions. When discriminating in earnings, the intensity of racial preferences must be greater when an owner or man-ager confronts a standardized measure of productivity than when effort is subjec-tively evaluated and those evaluations are used to set earnings. More important, use of a standardized measure of productivity makes the practice of discrimination more transparent and this improved information increases the probability of detection. The increased probability of detection raises the expected cost of racial discrim-ination and should be associated with a reduction in its extent. Our empirical esti-mates confirm that output-based pay is associated with reduced racial earnings discrimination.
John S. Heywood is a professor of economics and Director of the Graduate Program in Human Resources and Labor Relations at the University of Wisconsin-Milwaukee. Patrick L. O’Halloran is an assistant pro-fessor of economics at Monmouth University.
[Submitted November 2002; accepted February 2004]
ISSN 022-166X E-ISSN 1548-8004 © 2005 by the Board of Regents of the University of Wisconsin System
Using the National Longitudinal Survey of Youth (NLSY), we show that among those receiving output-based pay there is no evidence of a racial earnings difference even as a significant racial difference is confirmed for those paid time rates. Confirming the pattern of racial differences, the earnings premium associated with output-based pay is greater for nonwhites than for whites. In a mirror image, the racial earnings gap among those receiving individual bonus payments—payments largely based on managerial evaluations—is larger than that for those receiving traditional time rates. These basic patterns persist even after accounting for sample selection into payment method and for individual fixed effects.
II. Setting the Context
In the traditional employer prejudice framework, discrimination is expensive to firms putting them at a cost disadvantage relative to nondiscriminating firms (Becker 1971). According to this view, the extent of discrimination reflects the intensity of prejudice, on the one hand, and the cost of discrimination on the other. Payment structures linking individual output and pay increase the cost of discrimina-tion, thereby reducing its extent, all else equal.
Imagine two polar cases corresponding to subjective and objective performance measures as identified by Baker et al. (1988). In the first, the output of individual workers cannot easily be identified because of incomplete monitoring and/or because worker productivity is interdependent, so-called “team production” (Alchian and Demsetz 1972). Supervisors evaluate workers by judging their effort or input (Lazear 1986), a process that allows the preferences of the supervisor to be translated into dif-ferences in evaluations and, ultimately, into difdif-ferences in earnings. While the trans-lation of preferences may be restricted by bureaucratic rules (Prendergast and Topel 1996) or by concern over reputation (Baker et al. 1994), it is unlikely to be elimi-nated.1Indeed, Elvira and Town (2001) confirm that supervisors’ performance evalu-ations are influenced by the race of their subordinates. A white supervisor of both white and nonwhite subordinates typically gives the white a better rating than the non-white even after controlling for productivity (as measured by the researcher) and demographic variables. Thus, according to Elvira and Town, two workers who have the same productivity may have an earnings difference that reflects race but are likely to have supervisory evaluations that support the difference.
In the second case, workers are paid by the piece. At the end of each period, the supervisor has a list of workers, their individual outputs and a preestablished wage increment paid for each unit of output. Here it is much harder for racial preferences to be translated into differential earnings. The basic barrier of objective fairness is more immediate and the intensity of preference must be that much greater. Added to any cognitive barrier is the critical notion of external transparency. Those judging the earnings structure from outside, including the courts, are much more likely to be per-suaded by racial earnings discrepancies between workers with identical measured productivity than about earnings discrepancies between workers that reflect different The Journal of Human Resources
436
supervisor evaluations. Thus, the improved information on productivity associated with output-based pay increases the expected cost of discrimination by increasing the probability of detection and the associated penalties.
We do not claim that output-based pay will always eliminate the realm for racial preferences. Every piece counted must meet a quality standard, a standard that may allow supervisors scope for judgment. Similarly, workers often can be penalized financially for failure to maintain capital equipment, another area of judgment. Yet, we suggest the reduced scope for judgment and the more nearly objective productiv-ity measures associated with output-based pay increases the cost of allowing preju-dice to become differential treatment by race.2
It might be argued that those managers with greater tastes for discrimination sim-ply avoid output-based pay. Yet the choice of payment method is not at the costless discretion of managers. Only in the absence of substantial team production does indi-vidual output pay provide an objective measure of performance with small monitor-ing costs (Brown 1992; MacLeod and Parent 1999). Thus, output-based pay is prevalent where worker performance is easily measurable and tasks are relatively easy (Jirjahn and Stephan 2002). The majority of piece rates in the United States are among precision machine operatives, textile operatives, and other operatives; the majority of commissions are among sales workers, personal service workers, and a subset of administrators (Parent 2002). Hence, in those circumstances in which output-based pay would otherwise be optimal, adopting an alternative payment method in order to discriminate is itself an increased cost associated with discrimination.
The association between discrimination and payment method has received sporadic testing. Jirjahn and Stephan (2002) found that gender wage differentials in Germany are smaller among those paid piece rates than those paid hourly wages. Gunderson (1975) used Canadian establishment data to show that the average gender wage dif-ference within occupations across establishments is smaller when they use incentive pay systems such as piece rates and commissions. In the United States, broad indus-try measures of the extent of performance pay interact with individual measures of earnings such that racial differentials are smaller in those industries with greater use of performance pay (Belman and Heywood 1988). On the other hand, Bronars and Moore (1995) found less supportive results using earlier waves of the NLSY (1988–90). As part of a broad examination of the determinants and consequences of payment methods, they show that gender wage differentials are significantly greater
(at 10 percent) among those paid piece rates while racial differentials show no uni-form differences across payment method.
III. Illustrating the Connection between Performance
Pay and Discrimination
As described, individual output-based pay provides the output of each worker and a preestablished pay increment associated with each unit of output. Having such
2. Output-based pay will not fully capture individual productivity if workers help one another. Yet, output-based pay reduces helping effort (Drago and Garvey 1998) and the point is not the accuracy of the piece rate but its influence on racial differentials.
information increases the cost of discrimination by raising the probability that dis-crimination will be detected by the workers, by the legal enforcement officials, and, as suggested above, perhaps even by the members of management who prefer not to see themselves as discriminatory.3
We assume that workers and enforcement officials care about the true level of racial earnings discrimination in workplace i, Di. The best estimate of that discrimination is Di=Di+fi
t . The error in the estimate varies across firm technology, management
and workforces and is distributed with mean zero and known variance, σi2. We imag-ine that workers or officials report discrimination when they are kpercent certain that the true level of discrimination, Di, is greater than zero: Di> ( )z k
t Here z is the
critical value of a one-sided test of statistical confidence level k, testing the null that the true level of earnings discrimination, Di, is zero. The critical value z, and hence
the value of the estimate indicating discrimination, depends on the quality of the infor-mation, σi2. Thus, the odds of being identified as a discriminator increase with the extent of true discrimination and with the quality of the information (the smaller σi2). Following Becker, the employer values discrimination but wishes to avoid the increased costs associated with discrimination. These include the expected costs associated with detection. Thus, we consider the following employer’s utility function
( )1 U D( i,(1-ri))whereU1,U2>0andU11,U22< .0
Here Di is the extent of discrimination and πi is the probability of detection.4
The probability of detection is itself a function of Diand σi2, π(Di,σi2) where π1> 0,
π2 < 0. The improved information associated with performance pay decreases σi2 increasing πifor a given level of Dicausing the utility maximizing employer to reduce
the optimal level of discrimination.
To illustrate we assume a uniform probability distribution and a constant elastic-ity of substitution for the utilelastic-ity function. Thus, f(εi) = 21cfor ε
i∈[–c, +c] and 0
oth-erwise. Given significance level k, the critical value is z = 2ck − c. As the information improves, the dispersion (measured by c) falls, causing the critical value to fall for all k> 0.5. The employer’s probability of not being identified as a discriminator is then
The employer maximizes Equation 6 subject to Equation 5. Substituting yields the following problem
3. The model presented here follows the literature on the role of statistical information in discrimination (Kuhn 1987) and is a variation of Barbezat and Hughes (1990).
4. The penalties associated with detection are fixed, or of a known distribution, allowing employer prefer-ences to be expressed as simply a function of the probability of detection.
( )
This can be rearranged to yield the utility maximizing choice of discrimination
D*i :
Differentiating Equation 9 with respect to the information parameter cyields
( )7 Dc Dc (2c)1 r(2cs)r (2c)1 (2cs)r 1
The sign of Equation 10 is positive if r≤0 which corresponds to the full range of allowable values of t![-3, ]1. Thus, the performance pay scheme improves the
quality of information on earnings and productivity of workers (reducing c), thereby increasing the probability of detection and the employer responds by reducing earn-ings discrimination.
IV. Data Description and Sample Choice
The data are drawn from the 1996, 1998, and 2000 waves of the 1979 NLSY, the most recent waves for which performance pay measures are available. Our sample eliminates government employees, the self-employed, agricultural workers, and those with missing data for the selected variables.
We make a series of sample and definition choices but in each case present the sen-sitivity of the results to our choices. First, we limit our sample to males even though the theory outlined above would seem to apply to discrimination against women as well as racial minorities. There is, however, little or no evidence that U.S. women earn positive returns for output-based work (Bronars and Moore 1995; Parent 1999). As we’ll briefly illustrate, we routinely found insignificant output pay coefficients in female wage equa-tions and evidence that the gender earnings gap is at least as large among those earning output pay.5While at variance with the theory, it may follow if women sort into output pay jobs to achieve greater flexibility for home work, helping bid away the female return to piece rates (Goldin 1986; Heywood and Wei 1997). In any event, as there is no empirical support for the theory by comparing men and women and as they are known to have different wage formation processes, we exclude women.
5. Parent (1999) identifies a positive return to piece rates for only a subsample of women and only when interacting piece rates with the presence of dependents.
Second, we combine piece rates, tips, and commissions into a single category of individual output-based performance pay (largely following Parent 1999). The NLSY identifies whether or not earnings of the respondent’s job come from individual per-formance pay. If the respondent answers yes, the type of perper-formance pay is identi-fied: piece rates, commissions, tips, and bonuses.6As reported in Table 1, nonwhite males are more likely than white males to be on piece rates, less likely to receive com-missions and equally likely to receive tips. They are also much less likely to receive bonuses. The percentages shown are roughly consistent with those from the 1989-91 waves of the NLSY (Parent 2002).
We recognize differences exist in the jobs associated with piece rates, commissions and tips and that the characteristics of workers taking these different jobs vary as well (see Geddes and Heywood 2003). Importantly for our discussion, nonwhite service workers paid tips and commissions may face customer discrimination in addition to the employer discrimination we have modeled. Thus, moving a sales worker from time rates to commission may eliminate employer discrimination but may expose the worker to customer discrimination. Yet to the extent that customer discrimination lowers the marginal productivity of nonwhite service workers (say due to lost sales), it may well be reflected in lower earnings for minorities even among nondiscrimina-tory employers paying time rates. If true, the comparison between time rates and com-missions would still isolate the role of employer discrimination. For this paper all the schemes measure individual output and provide a pay increment for each output unit and will be treated similarly. We will, however, test the sensitivity of the results to our treatment.
Third, we generally use a single combined “nonwhite” indicator. The NLSY pro-vides only two mutually exclusive racial indicators: black and Hispanic. Thus, fol-lowing Bronars and Moore (1995) our white indicator is more precisely nonblack and nonHispanic. Again, we will provide evidence on the sensitivity of the results to combining the two minorities and also use the NLSY “ethnicity codes” to identify Asians.
Fourth, we do not present results that combine our years of data (1996, 1998, 2000) with those from 1988, 1989, and 1990 which ask the same performance pay questions. Bronars and Moore used the earlier data to show that racial earning differences do not consistently vary by method of pay. We took our exact definitions and sample restric-tions back to the earlier years and repeated each of the estimation presented in this paper (available from the authors) and could not reproduce the results we are currently presenting. Thus, there is an uncomfortable juxtaposition between the later years in which we find a robust and consistent role for race and the earlier years in which nei-ther we nor Bronars and Moore find such a role. This might be explained by growth in racial earning differences over the lifecycle that are concentrated among time workers (yet, see Hoffman 1979 on the absence of such growth). Alternatively, there might be match-specific returns to high-ability workers sorting into output pay and the reduced discrimination associated with output pay causes a larger share of high-ability
non-6. An additional category is stock options but we have no way of knowing whether these are part of a sub-jective performance bonus or an obsub-jective performance scheme.
He
yw
ood and O’Halloran
441
Table 1
Descriptive Statistics by Race & Payment Scheme
Variable White Mean Nonwhite Mean Output-Pay Mean Time-Rate Mean
Wage = (Usual weekly earnings/usual $19.03 $13.85 $18.55 $17.68
weekly hours)
Nonwhite — — 15.80% 19.27%
Piece rates 2.86% 3.32% — —
Commissions 7.33% 4.38% — —
Tips 1.57% 1.54% — —
Bonuses 20.71% 13.39% — —
Tenure (years/10) 0.60 0.47 0.47 0.57
Potential experience ((age – grade −6)/10) 1.71 1.80 1.73 1.75
AFQT Score 52.96 25.77 46.84 44.68
Highest grade achieved 13.45 12.64 13.17 13.00
Fewer than 100 employees 59.91% 59.48% 78.77% 59.40%
100 to 499 employees 21.02% 20.26% 12.84% 21.35%
500 to 999 employees 6.45% 4.74% 1.73% 6.36%
Over 1,000 employees (reference) 12.62% 15.52% 6.67% 12.89%
Shift work (regular day shift) 76.58% 68.96% 71.11% 75.09%
Off-shift work (evening or night shift) 14.64% 22.16% 11.85% 16.99%
Irregular shift work (split shift or hours vary) 7.84% 8.29% 16.05% 7.02%
(reference)
Married −64.97% 42.18% 55.80% 59.26%
Urban resident 83.38% 90.76% 86.67% 83.42%
Hours of work 45.04 43.05 43.69 44.01
Union coverage 16.69% 20.14% 9.38% 20.14%
Number of children 1.22 1.11 1.07 1.18
Child younger than six years 30.91% 19.19% 24.94% 27.02%
Year = 1996 37.86% 35.19% 42.96% 37.91%
Year = 1998 32.78% 34.12% 30.12% 32.88%
Year = 2000 29.36% 30.69% 26.91% 29.21%
Observations 3,954 844 405 3,461
The Journal of Human Resources
442
Table 2
Log Wage Equation by Subsample
(1) (2) (3) (4) (5) (6)
Output Pay Time Rates Piece Rates Commissions or Tips White Nonwhite
Nonwhite 0.088 −0.076 0.104 −0.016 — —
(0.98) (3.81)** (0.59) (0.14) — —
Output pay — — — — 0.089 0.167
— — — — (3.80)** (2.94)**
Bonus — — — — 0.157 0.126
— — — — (8.64)** (2.64)**
Tenure 0.482 0.231 0.798 0.403 0.248 0.307
(2.51)* (5.67)** (2.28)* (1.59) (6.12)** (3.27)**
Tenure squared −0.019 −0.006 −0.030 −0.015 −0.008 −0.009
(1.75) (2.73)** (1.59) (1.02) (3.54)** (1.59)
Experience 0.039 0.285 3.287 −0.012 0.350 −0.685
(0.06) (1.97)* (1.89) (0.02) (2.64)** (1.86)
Experience squared −0.468 −0.679 −9.826 −0.028 −0.866 2.274
(0.27) (1.73) (2.10)* (0.01) (2.34)* (2.34)*
AFQT score 0.005 0.003 0.004 0.004 0.003 0.006
(3.07)** (9.69)** (1.08) (2.19)* (8.68)** (6.99)**
Highest grade 0.021 0.052 0.020 0.037 0.057 0.051
(0.86) (9.09)** (0.36) (1.27) (10.06)** (4.06)**
Small firm 0.021 −0.126 −0.155 0.071 −0.138 −0.072
(0.16) (5.44)** (0.59) (0.41) (6.00)** (1.47)
Medium firm 0.122 −0.055 −0.196 0.256 −0.070 0.015
He
yw
ood and O’Halloran
443
Large firm −0.074 −0.020 −0.226 −0.046 −0.051 0.106
(0.28) (0.59) (0.45) (0.13) (1.53) (1.28)
Main shift 0.068 0.010 0.241 −0.023 0.031 −0.043
(0.80) (0.36) (1.23) (0.22) (1.24) (0.74)
Off shift −0.138 −0.033 0.106 −0.239 −0.056 −0.091
(1.11) (1.03) (0.30) (1.65) (1.80) (1.42)
Married 0.196 0.105 0.154 0.196 0.095 0.217
(2.48)* (5.88)** (0.74) (2.13)* (5.31)** (5.38)**
Union coverage 0.173 0.200 0.143 0.139 0.182 0.218
(1.53) (10.73)** (0.71) (0.90) (9.28)** (5.17)**
Urban 0.153 0.111 0.066 0.217 0.127 0.169
(1.62) (5.51)** (0.34) (1.80) (6.38)** (3.00)**
Hours of work −0.007 −0.000 −0.002 −0.012 −0.002 −0.003
(2.76)** (0.52) (0.30) (3.62)** (2.91)** (1.93)
Number of children 0.002 0.013 0.033 −0.005 0.021 −0.007
(0.07) (1.78) (0.40) (0.15) (2.77)** (0.47)
Young child in household 0.020 0.028 −0.318 0.120 0.021 0.071
(0.24) (1.50) (1.72) (1.22) (1.17) (1.53)
Year 1996 −0.279 −0.117 −0.632 −0.118 −0.144 −0.077
(2.84)** (5.25)** (2.82)** (1.03) (6.53)** (1.58)
Year 1998 −0.126 −0.073 −0.358 −0.034 −0.087 0.013
(1.38) (3.72)** (1.74) (0.32) (4.47)** (0.32)
Occupations YES YES YES YES YES YES
Industries YES YES YES YES YES YES
Constant 1.993 1.369 −0.688 1.814 1.346 1.835
(2.69)** (7.42)** (0.39) (1.95) (7.69)** (4.06)**
Observations 405 3,461 125 284 3,954 844
R-squared 0.35 0.45 0.45 0.38 0.46 0.47
The Journal of Human Resources 444
whites to sort into such schemes. If this process takes time, the ability composition of workers on the two payment schemes will differ more by race in the later waves (in both measurable and unmeasurable dimensions). Indeed, in the early waves average AFQT scores for both whites and nonwhites were about 2 percent higher for those on output pay. In the later waves, average AFQT scores are 3 percent higher for whites and 11 percent higher for nonwhites on output pay. The greater share of high-ability nonwhite workers among those on output pay yields greater match-specific earnings increments reducing measured earnings discrimination.
Turning to the earnings data in the later waves, we find that white males on out-put pay in our sample earn more than 6 percent higher earnings than those on time rates ($18.64 versus $19.81) but nonwhite males on output pay earn over 21 per-cent more than their counterparts on time rates ($13.59 versus $16.51). Examined differently, nonwhites earn 73 percent of the average white wage among those on time rates but 83 percent of the average white wage among those on output pay. These raw averages suggest lower racial earnings differentials in the face of per-formance pay.
Following traditional estimates of earnings differentials, a wide variety of demographic and human capital variables will be used as explanatory controls. These include gender, marital status, union status, education, tenure with the firm, experience and experience squared, number of children at home in the household, an indicator if a young child is in the household, urban residency, a dummy for sur-vey year, and the average hours per week worked over the previous year. In addi-tion, the Armed Forces Qualification Test (AFQT) percentile score is included as a measure of ability. In order to further proxy firm characteristics, four categorical variables measure firm size, two shift variables are included, and one-digit occu-pation and industry controls are included. As shown in Table 1, whites are more likely to be married, have fewer children, more education, tenure and higher AFQT scores. As a consequence, including the controls should lower the estimated racial earnings gap.
V. Estimates
equations with the same controls and found that in neither group is there a significant coefficient for the nonwhite variable.7
The reported pattern is further supported by the differing influence of output pay across the racial groups as shown in Columns 5 and 6. Those receiving output pay earn more than their equivalents earning time rates for both racial groups.8Yet, the point estimates indicate a roughly 9.3 percent increase in earnings associated with output pay for whites but a nearly twice as large return of 18.1 percent for blacks. Also note in Table 2 that the return to white workers of being paid bonuses is 17.0 percent while that for nonwhites is only 13.4 percent supporting the notion that the greater the subjectivity in the payment the scheme, the greater the disadvantage for minorities. We further broke down the analysis by reestimating the two racial earn-ings equations replacing our combined measure of output-based pay with three sepa-rate indicators for piece sepa-rates, commissions and tips. In the white equation the coefficient on piece rates is 0.081 compared with 0.173 in the nonwhite equation. In the white equation the coefficient on commissions is 0.111 compared to 0.201 in the nonwhite equation. While all four of these estimates are statistically significant, the coefficient on tips is insignificant in both equations.
In Lazear’s (1986) theory of workers choosing piece rate or time-rate jobs, the choice was based on the tradeoff of earnings and effort. If nonwhite workers face earnings discrimination in the time-rate sector, they should be more willing to accept a piece-rate job, all else equal. Thus, at the time rate that makes the mar-ginal white worker indifferent between sectors, nonwhite workers should continue to select into piece rates. The difference in selection criteria should be reflected in a greater dispersion in the residual earnings for nonwhites on output pay compared to whites on output pay. Indeed, despite larger mean earnings and greater earnings variance for whites, the standard deviation of the residual from a nonwhite earn-ings equation estimated for those on output pay is 0.602 compared to 0.525 from a similar white earning equation. Similarly, at the bottom of the ability/skills dis-tribution the same logic argues there should be nonwhites who select output pay while otherwise similar whites do not. Indeed, the share of output pay work-ers among those who have AFQT scores below 21 and 12 or less years of educa-tion is 4.8 percent for nonwhites and only 4.2 for whites. The difference exists despite the fact that a higher percentage of whites are on output pay in the entire sample.
We also attempted to explore the role of within-job versus between-job variation in the output pay indicator. We identified 78 workers who reported moving between time rates and output pay while staying with their same employer and job. A new indica-tor was added to the estimations equal to one for the periods in which these workers received output pay. The coefficient on the time-varying output pay indicator was insignificantly different from zero in both the white and nonwhite estimations while
Heywood and O’Halloran 445
the original output pay indicator repeated the pattern already identified. While the small sample of within-jobs variation limits our confidence, there do not seem to be differences due to the source of the variation.9
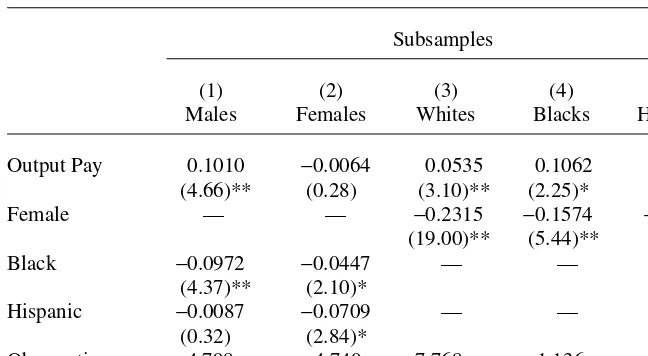
As an additional sensitivity analysis, we briefly return to issues of gender and race summarizing further regressions on the entire mixed gender sample. Coefficients on the output pay indicator and on race and gender dummies are presented in Table 3 for five estimations using otherwise identical controls on separate subsamples for males, females, whites, blacks, and Hispanics. The output pay estimate for males shows a highly significant coefficient of 0.101 while that for females is insignificantly differ-ent from zero. In these equations the racial coefficidiffer-ents are negative and significant with the exception of that for Hispanic men. The white estimation shows an output pay coefficient of 0.054 while that coefficient for blacks and Hispanics are both much larger at 0.106 and 0.123.
Not shown is our effort to identify Asians as a minority group. The underlying eth-nicity codes allow us to identify those of Chinese, Asian Indian, Japanese, Korean, and Filipino origin. A total of 41 respondents identified these codes of which 37 were allocated to white and four to nonwhite by the NLSY. We removed all 41 from our The Journal of Human Resources
446
Table 3
Role of Output Pay by Gender and Race
Subsamples
(1) (2) (3) (4) (5)
Males Females Whites Blacks Hispanics
Output Pay 0.1010 −0.0064 0.0535 0.1062 0.1234
(4.66)** (0.28) (3.10)** (2.25)* (1.98)*
Female — — −0.2315 −0.1574 −0.1427
(19.00)** (5.44)** (3.23)**
Black −0.0972 −0.0447 — — —
(4.37)** (2.10)*
Hispanic −0.0087 −0.0709 — — —
(0.32) (2.84)*
Observations 4,798 4,740 7,768 1,136 634
R-squared
Notes: The absolute values of t-statistics are in parentheses. * significant at 5 percent; ** significant at 1 per-cent. Each regression includes the full set of controls as indicated in Table 2.
sample and observed absolutely no change in the patterns of size and statistical significance for the critical coefficients reported in Table 3 (results available from the authors).
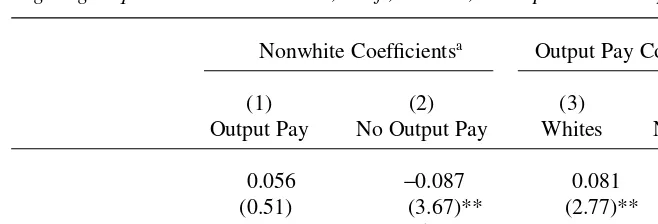
The racial earnings gap estimated across all occupations may, however, be mis-leading. In many occupations there is virtually no use of output-based pay raising the possibility that the role we attribute to payment schemes may be a function of unmeasured occupational differences. Thus, occupations with piece rates and com-missions could have lower earnings dispersion including lower racial differences that would be inappropriately attributed to the use of payment schemes. To more fully control for the role of occupation we focus on occupational categories in which piece rates and commissions are relatively common: operatives, laborers, craft workers, and sales. Restricting the occupations reduces the sample size but limits the differences among workers and jobs. The basic specifications from Table 2 are reestimated except that the occupational dummies are now reduced by the excluded occupations. Table 4 shows that despite a sample size one-third of the original, the results remain. Indeed, they appear even more convincing, again, with no indication of a racial earnings gap among those receiving output pay. Among those paid time rates, there exists a highly significant earnings difference of more than 9.1 percent. This pattern is confirmed by different returns to output pay by race. The white return remains less than half of that for nonwhites but both are sta-tistically significant. Output pay for nonwhites is associated with a large earnings increase of 19.1 percent.
VI. Further Estimation
This section considers two interrelated estimation difficulties: sample selection and individual fixed effects. At issue is the possibility that the influence
Heywood and O’Halloran 447
Table 4
Log Wage Equation Limited to Sales, Craft, Laborer, and Operative Occupations
Nonwhite Coefficientsa Output Pay Coefficients
(1) (2) (3) (4)
Output Pay No Output Pay Whites Nonwhites
0.056 −0.087 0.081 0.178
(0.51) (3.67)** (2.77)** (2.88)**
Observations 262 1,905 2,003 496
R-squared 0.37 0.42 0.38 0.49
Notes: Absolute values of t-statistics are in parentheses. * significant at 5 percent; ** significant at 1 percent. Each regression includes the full set of controls as indicated in Table 2.
attributed to piece rates and commissions is a function of sorting across unmeasured variables correlated with race. First, it is well recognized that payment schemes that reward productivity not only elicit additional productivity from existing workers but tend to attract the inherently more productive. Indeed, Lazear (2000) suggests that 56 percent of the increase in productivity associated with piece rates results from attracting inherently more productive workers. Moreover, if the reward for produc-tivity associated with piece rates is larger for nonwhites, the extent of sorting may differ between races. In short, piece rates and commissions may attract relatively more productive nonwhites, a productivity not controlled for by our long list of explanatory variables.
We perform two estimations to control for fixed effects. The estimations are designed to hold constant the productivity of each worker and so control for the an-ticipated sorting. The first estimation accounts for fixed effects by adding separate indicator variables for each worker and the estimates are then generated on the intra-worker variation across the three waves. Obviously, race doesn’t change so the racial indicator drops out of the estimation, along with all other variables constant over time. Nonetheless, the fixed effect estimate allows separate estimates of the return to piece rates by race. As shown in the top panel of Table 5, the coefficient remains positive for whites but falls short of significance at the 5 percent level. The size of the coefficient for nonwhites is many times larger than that for whites and remains statistically significant. The fixed-effect estimate indicates a nonwhite return nearly identical to that when not controlling for fixed effects (0.167 without fixed effects and 0.162 with fixed effects). While the results shown are for an unbal-The Journal of Human Resources
448
Table 5
Output Pay Coefficients from Fixed-effects Models and Change Equations
(1) (2)
White Nonwhite
Fixed-effect model
Output pay coefficient 0.047 0.162
(1.79) (2.26)*
Observations 3,954 844
R-squared 0.11 0.05
Change equation
Moving to an output-pay job. 0.038 0.207
(1.05) (2.40)*
Observations 2,267 474
R-squared 0.07 0.16
anced panel, they are exactly mimicked by the results from a balanced panel of workers.
We also examine a change equation in which the changes in the variables differ-ence out fixed effects associated with those earning piece rates. The coefficient on out-put pay is estimated on those who change between time rates and outout-put pay under the assumption that the earnings magnitude of moving from piece rates to time rates need not be equal to that from moving from time rates to output pay. The results, as shown in the bottom panel of Table 5, are broadly supportive of those already reported. The coefficient on the change to output pay is positive for both white and nonwhite workers but larger and significant for nonwhites. The coefficient on a change away from output pay is not significantly different from zero for either racial group. Thus, both fixed-effect estimates broadly support the notion that nonwhites gain more from output pay. The effect identified in the cross-sections does not seem to flow only from differential ability sorting by race.
In addition to these attempts to hold constant fixed effects, we estimate a sample selection model assuming that the choice of output pay or time rates is not random. If there are excluded determinants of the choice of output pay correlated with earnings, it is possible that the coefficients on the critical earnings determinants such as race are biased. Following Heckman (1979), a first stage estimates the probability of receiving output pay. The first stage specification replaces the existing industrial controls with the full set of two-digit industrial dummies (available from the authors). From the probit the inverse mills ratio (IMR) is calculated and added to the two earnings equa-tions estimated separately by payment method. The IMR is statistically significant in the time-rate equation but not in the output pay equation.10
Table 6 repeats the now familiar pattern that the nonwhite earnings differential is insignificantly different from zero among those on output pay but that it remains statistically significant among those on time rates. In particular the point esti-mate from nonwhites in the time-rate equation is −0.072 very similar to the coef-ficient −0.076 estimated in the initial equation which did not correct for sample selection.
VII. Conclusion
The evidence presented suggests that the racial wage differential is smaller for those receiving output pay. Output-based pay schemes provide more objective information on productivity than do typical supervisory evaluations. We suggest the costs of discrimination are greater in the face of better information as workers, managers, and enforcement officials can more easily identify when supervi-sory prejudice is translated into earnings discrimination. Thus, with the better infor-mation provided by piece rates and commissions earnings discrimination will be reduced and earnings differentials will be smaller.
Heywood and O’Halloran 449
It is important to emphasize that the results do not necessarily support public pol-icy requiring firms to use output pay. The technology of many firms simply does not allow a meaningful output-based pay scheme. Such schemes are unlikely to provide appropriate incentives or superior information on productivity when the tasks of workers are complex and multidimensional, when helping on the job is important or when quality is critical (Holmstrom and Milgrom 1991). Instead, piece rates and com-missions are appropriate for relatively simple repetitive tasks (MacLeod and Parent 1999). Thus, a piece rate applied to workers involved in complex and multidimen-sional tasks fails to provide accurate information about the true productivity of the workers and while workers with equal number of pieces may have equal earnings, there is no expectation that the pieces, and hence earnings, would be associated with true productivity. As a consequence, the racial differences in the relationship between earnings and true productivity need not be equalized. Nonetheless, when production technology allows a meaningful output-based payment scheme, an apparent conse-quence is reduced racial earnings differentials.
References
Alchian, Armen and Harold Demsetz. 1972. “Production, Information Costs and Economic Organization.” American Economic Review62(5):777–95.
The Journal of Human Resources 450
Table 6
Selection Corrected Estimates
Full Sample Output Pay Time Rates
Nonwhite coefficient 0.068 −0.072
(0.90) (3.83)**
Inverse Mills ratio −0.073 0.117
(0.85) (2.52)**
Chi-squared 348.84** 4,109.96**
Observations 528 4,268
Sample Limited to Sales, Craft, Laborer, and
Operative Occupations Output Pay Time Rates
Nonwhite coefficient 0.063 −0.079
(0.70) (3.50)**
Inverse Mills ratio 0.020 0.059
(0.20) (1.13)
Chi-squared 202.27** 1,585.26**
Observations 324 2,175
Baker, George, Robert Gibbons, and Kevin Murphy. 1994. “Subjective Performance Measures in Optimal Incentive Contracts.” Quarterly Journal of Economics109(4):1125–56. ———. 1988. “Compensation and Incentives: Practice vs. Theory.” Journal of Finance
43(3):593–616.
Barbezat, Debra, and James W. Hughes. 1990. “Sex Discrimination in the Labor Market: The Role of Statistical Evidence: Comment.” American Economic Review80(1): 277–86.
Becker, Gary S. 1971. The Economics of Discrimination, 2nd Ed. Chicago & London: University of Chicago Press.
Belman, Dale, and John S. Heywood. 1988. “Incentive Schemes and Racial Wage Discrimination.” Review of Black Political Economy17(1):47–56.
Brown, Charles. 1992. “Wage Levels and Methods of Pay.” Rand Journal of Economics
23(3):366–75.
Bronars, Stephen G., and Carol Moore. 1995. “Incentive Pay, Information, and Earnings: Evidence form the NLSY, U.S. Department of Labor, Bureau of Labor Statistics,
Discussion Paper, Report: NLS 95–23.
Drago, Robert, and Gerald Garvey. 1998. “Incentives for Helping on the Job: Theory and Evidence.” Journal of Labor Economics16(1):1–25.
Elvira, Marta, and Robert Town. 2001. “The Effects of Race and Worker Productivity on Performance Evaluations.” Industrial Relations40(4):571–90
Freeman, Richard, and Edward Lazear. 1995. “An Economic Analysis of Works Councils.” In
Works Councils: Consultation, Representation and Co-operation in Industrial Relations, ed. Joel Rogers and Walter Streck, 36–52. Chicago: University of Chicago Press.
Geddes, Lori, and John S. Heywood. 2003. “Gender and Piece Rates, Commissions and Bonuses.” Industrial Relations42(3):419–44.
Golden, Claudia. 1986. “Monitoring Costs and Occupational Segregation by Sex: A Historical Analysis.” Journal of Labor Economics4(1):1–27.
Gunderson, Morely. 1975. “Male-Female Wage Differentials and the Impact of Equal Pay Legislation.” Review of Economics and Statistics57(4):462–69.
Heckman, James J. 1979. “Sample Selection Bias as a Specification Error.” Econometrica
47(1):153–62.
Heywood, John S., and Xiangdong Wei. 1997. “Piece Rates and the Employment of Women: The Case of Hong Kong.” Journal of Comparative Economics25(2):237–55.
Hoffman, Saul D. 1979. “Black-White Life Cycle Earnings Differences and the Vintage Hypothesis: A Longitudinal Analysis.” American Economic Review69(5):855–67. Holmstrom, Brent, and Paul Milgrom. 1991. “Multitask Principal-Agent Analyses, Incentive
Contracts, Asset ownership, and Job Design.” Journal of Law, Economics and Organization
7(special issue):24–52.
Jirjahn, Uwe, and Gesine Stephan. 2002. “Gender, Piece Rates and Wages: Evidence from Matched Employer-Employee Data” Cambridge Journal of Economics. Forthcoming. Kuhn, Peter. 1987. “Sex Discrimination in Labor Markets: The Role of Statistical Evidence.”
American Economic Review77(4):567–83.
Lazear, Edward P. 2000. “Performance Pay and Productivity.” American Economic Review
90(5):1346–61.
———. 1986. “Salaries and Piece Rates.” Journal of Business59(3):405–31. MacLeod, W. Bentley, and Daniel Parent. 1999. “Job Characteristics and the Form
of Compensation.” In Research in Labor Economics, Vol. 18, ed. S. Polachek, 177–242.
Paarsch, Harry, and Bruce Shearer. 1999. “The Response of Worker Effort to Piece Rates: Evidence from the British Columbia Tree-Planting Industry.” Journal of Human Resources
34(4):643–67.
Parent, Daniel. 2002. “Incentive Pay in the United States: Its Determinants and Its Effects.” InPaying for Performance: An International Comparison, ed. M. Brown and J. Heywood, 17–51. Armonk N.Y.: M.E. Sharpe Press.
———. 1999. “Methods of Pay and Earnings: A Longitudinal Analysis.” Industrial and Labor Relations Review53(1):71–86.
Prendergast, Cynthia, and Robert Topel. 1996. “Favoritism in Organizations.” Journal of Political Economy104(5):958–78.