186
The Impact of Brand Equity towards Customer Loyalty of Starbucks: Testing
the Role of Customer Satisfaction as the Mediate Variable
Helen Ongkowidjoyo
International Business Management Program, Petra Christian University Jl. Siwalankerto 121-131, Surabaya
E-mail: [email protected]
ABSTRACT
With the fact of tight competition in café industry in Surabaya, Starbucks in Surabaya also needs to improve its performance to be able to compete with the current competition, to grow more in the market, and to be sustained in Surabaya. One of the things that be done is by improving the brand equity so that it can improve customer satisfaction and customer loyalty. This research would like to find the impact of brand equity towards customer loyalty as well as testing the customer satisfaction mediating effect. By distributing 228 questionnaires spread around Surabaya via online through the Google form and by conducting sobel test, this research has proven that brand equity has a positive impact towards customer loyalty and customer satisfaction is proven to have a mediating impact.
Keywords: Brand Equity, Customer Satisfaction, Customer Loyalty, Starbucks
ABSTRAK
Dengan adanya kompetisi yang ketat di industry kafe di Surabaya, Starbucks di Surabaya juga perlu meningkatkan performanya agar dapat bersaing, tumbuh, and bertahan di pasar Surabaya. Penelitian ini ingin menganalisa dampak ekuitas merek terhadap loyalitas konsumen and juga menguji dampak mediasi dari kepuasan konsumen. Dengan menyebarkan 228 kuisioner yang tersebar di Surabaya dengan Google form dan melakukan uji sobel, penelitian ini membuktikan bahwa ekuitas merek memiliki dampak positif terhadap loyalitas konsumen dan kepuasan konsumen terbukti memiliki dampak mediasi.
Kata Kunci: Ekuitas Merek, Kepuasan Konsumen, Loyalitas Konsumen, Starbucks
INTRODUCTION
The economic growth of Surabaya, the second biggest city in Indonesia has reached above East Java Province and also National economic growth (“Inilah Postur Ekonomi Surabaya Saat Ini”, 2014). In the second quarter of year 2013 for instance, the economic growth of Surabaya reached 7.54%, while East Java was 6.97%, and National economic growth was about 5.81% (“Inilah Postur Ekonomi Surabaya Saat Ini”, 2014). In addition, this economic growth of Surabaya is keep increasing for about 7.3% until 7.8% as predicted by the Surabaya Government (Pemkot) in the beginning of the year 2015 (Jawa Pos, 2015).
With the rapid economic growth of Surabaya, it is inevitably that Surabaya becomes a good place for business and investment destination. Furthermore, in the year of 2011 until 2013, the most growing sector in Surabaya was mostly coming from hotel, café, and restaurant industry, followed by processing industry, transportation and
communication (BPS Kota Surabaya, 2015). In the city development planning of Surabaya 2014, it was also predicted that hotel, café, and restaurant industry still became the most contributor in the economic development of Surabaya in year 2014 and 2015 (“Rencana Kerja Pembangunan Daerah Kota Surabaya Tahun 2014”, 2014). From those data, it shows that café industry is really growing especially in Surabaya area.
187 Purnomosidi stated that there will be several in-door and out-door cafés operate at The Lagoon in October 2015 (“Pakuwon Hadirkan Fasilitas Hunian Lifestyle Di Surabaya Timur”, 2015).
The increasing number of café in Surabaya is supported not only by the growth of macro-economic like the researcher has explained in the previous paragraph, but also the life style of Surabaya society who likes to visit café (”Cafe dan Restoran di Surabaya Tumbuh Hingga 20% Setiap Tahunnya”, 2013). With the rapid expected growth of cafe industry for about 15% until 20% in Surabaya, it is shown that there might be a tight competition that makes a company has to think more about how to compete with other competitors and to be able to sustain in the existing industry.
One of the players in café industry in Surabaya is Starbucks. To be sustained in the café industry, one of the things that can be done by the Starbucks is by increasing the brand equity. According to Aaker (1991), brand equity can be achieved by having perceived quality, brand association, brand loyalty, and brand awareness. When the brand equity is high, the customer loyalty also will be high (Alyasa & Kusnilawati, 2012). For example, when a café offers good quality of products and services, it can make the customers do repeat purchase and prefer to go to that café compared to others (“Wawancara Bos Starbucks Indonesia: Tak Cukup di Mal”, 2013). Also, when the brand equity increases, it will also give impact to customer satisfaction (Pappu & Quester, 2006). Customer satisfaction means customer can get something beyond their expectation (Kotler & Keller, 2012). When a company gives good quality of product and services, it can make the customers can think that what they get is more than what they pay for (Jørgensen, 2013). Moreover, customer satisfaction itself can give impact to customer loyalty (Chandra, 2014). It means, when customer gets something more than they has expected, the customer tends to do repeat visitation and repeats purchasing to a certain products and services offered (Logiawan & Subagio, 2014). Therefore, by improving brand equity, customer satisfaction, and customer loyalty, the company will have stronger competitive position compared to the competitors (Long, Wan Ismail, Abdul Rasid, Hwee, & Jiun, 2013).
To conclude, brand equity can give impact to customer satisfaction and also customer loyalty so that it can help the Starbucks to be able to compete with the competition and also to be able to survive in the existing industry. Therefore, on this research, the researcher would like to analyze the impact of brand equity of Starbucks on customer loyalty by testing the role of customer satisfaction as the mediate variable.
LITERATURE REVIEW
Brand Equity
One of the most important assumptions underlying several prominent finance theories is the investors’ ability to buy and sell any amount of a firm’s equity without any price impacts, which suggests the demand curve for a firm’s
Brand equity is defined as customers’ perspective towards brands’ reputation (Hawkins & Mothersbaugh, 2013, p. 339). When a certain brand has a good reputation, it means that particular brand has potential to have high brand equity (Hawkins & Mothersbaugh, 2013). The other scholar also define Brand equity as the customer’s thought about certain brand and its economic value that can give value added to the products or services offered by those certain brand (Kotler & Keller, 2012, p. 265). Aaker (1991) in his book stated that brand equity is “a set of brand assets and liabilities linked to a brand, its name and symbol; that add to or subtract from the value provided by a product or service to a firm and/or to that firm’s customers”. Thus, brand equity itself can be categorized as an intangible asset of the company that should be maintained (Wibowo, 2005). By maintaining and improving brand equity, it can give customer more confidence to purchase goods or services (Durianto, Sugiarto, & Sitinjak, 2004).
According to Aaker (1991), Brand Equity can be divided in to four categories which are perceived quality, brand association, brand awareness, and brand loyalty. Perceived quality means customer perception towards the consistency or the good quality of the products or services (Wibowo, 2005). Brand association is about how customer remembers about a certain brand based on value, personality, and organization of the brand (Wibowo, 2005). Brand awareness is defined as customer ability to know, recognize, and recall the brand (Kotler & Keller, 2012). Brand loyalty is customer bonding to continue purchase products or services from certain brand even with the premium price (Wibowo, 2005). Nevertheless, to analyze the impact of brand equity towards customer loyalty by testing the customer satisfaction as the mediate variable; the researcher will measure the brand equity especially by using brand awareness, brand association, and perceived quality. It means the researcher will exclude the brand loyalty. It is excluded since the brand loyalty and customer loyalty have similar meaning (Aaker, 1991). For example, there is a customer who is loyal to Starbucks. From that statement, there can be two meanings, first is that customer is loyal but to the brand of Starbucks and the second is a customer is a loyal customer. Therefore, to avoid confusion, the researcher will omit brand loyalty from the research model.
Customer Satisfaction
Satisfaction is “a person’s feelings of pleasure or disappointment that result from comparing a product perceived performance (or outcome) to expectation” (Kotler & Keller, 2012). Customer satisfaction can be defined as customer comparison between real performance and expectation (Mosahab, Mahamad, & Ramayah, 2010). Therefore, it can be said that satisfaction will occur when expectation is fulfilled. It can be considered as the post-consumption judgment towards the previous experience, perception, and expectation (Bae, 2012).
188 satisfaction, a company can measure it with several ways such as periodic survey, mystery shoppers, customer loss analysis, and complaints center (Kotler & Keller, 2012).
There will be three indicators for measuring customer satisfaction. First indicator is happiness. Customer satisfaction can be achieved when it achieves pleasurable experience that can satisfy some needs or goal (Chandra, 2014).The second indicator is expectation. When customer meets the expectation, it can be considered that the customer is satisfied (Bae, 2012). The third indicator is customer spending. When customer satisfied with certain products and services, there is high possibility that customer will spend more (Chandra, 2014). In conclusion, there will be three indicators to measure customer satisfaction which are happiness, expectation, and spending (Aryani & Rosinta, 2010).
Customer Loyalty
Mark Klein (2013), the founder and CEO of Loyalty Builders Inc. stated that customer loyalty is “a company-calculated metric of likelihood to purchase again or not defect to a competitor”. Other scholars also have defined customer loyalty as customer who continually doing repeat purchasing to fulfill their satisfaction (Logiawan & Subagio, 2014).
By doing continually re-purchasing, the customer loyalty can be considered as the highest attainment to the business result of the company (Chandra, 2014). It is a potential asset for the company to give value added such as reducing marketing expense, adding more customers, and even creating more competitive advantage compared to the competitors (Rofiq, Suryadi, & Faidah, 2009).
Not only doing repeat purchasing, there are other tendencies done by the loyal customer. The loyal customer tends to say positive things about the products, services, and stories to others (Logiawan & Subagio, 2014). In the case of Starbucks, customer will have willingness to spread good things about Starbucks café or positive word-of-mouth. In addition, the loyal customer usually suggests, recommends, and invites others so that they can feel what the loyal customer feel (Mosahab, Mahamad, & Ramayah, 2010).
Therefore, in this research the indicator to measure customer loyalty will follow the theory of Gremler and Brown (1996) who stated that customer loyalty can be measured by repeat purchases, positive words, and recommendations (as cited in Ariani & Rosinta, 2010).
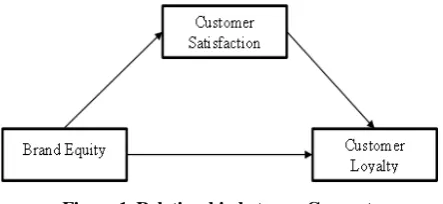
Relationship between Concepts
Based on the discussion in the previous section about brand equity, customer satisfaction, and customer loyalty, there will be three main concepts used in analyzing “The Impact of Brand Equity towards Customer Loyalty of Starbucks in Surabaya: Testing the Role of Customer Satisfaction as the Mediate Variable”. Those three main concepts are proposed having significant impact or relationship. Those relationships are the brand equity has significant impact to customer satisfaction, the customer satisfaction has significant impact to customer loyalty, and brand equity has significant impact to customer loyalty by
having customer satisfaction as the mediate variable. To see the relationship clearer, the relationship between concepts can be seen in the figure below.
The researcher has developed several hypotheses as the basis for fulfilling the research objectives and also for guiding the analysis throughout this research. Therefore, the hypotheses that will be tested are stated below:
Hypothesis 1 (H1) :
Brand equity (perceived quality, brand association, and brand awareness) simultaneously gives impact towards customer satisfaction of Starbucks in Surabaya.
Hypothesis 2 (H2) :
Customer satisfaction gives impact towards customer loyalty of Starbucks in Surabaya.
Hypothesis 3 (H3) :
Brand equity (perceived quality, brand association, and brand awareness) simultaneously gives impact towards customer loyalty of Starbucks in Surabaya.
Hypothesis 4 (H4) :
Brand equity gives impact towards customer loyalty, mediated by customer satisfaction of Starbucks in Surabaya.
RESEARCH METHOD
To analyze the impact of brand equity towards customer loyalty of Starbucks by testing the role of customer satisfaction as the mediate variable, the type of study that will be used is causal research.
There will be three variables used on this research. Those variables are dependent variables, independent variables, and intervening or mediating variables (Cooper & Schindler, 2014, p. 55). According to Cooper and Schindler (2014), dependent variable is variable that is measured, predicted and analyzed on this research. On this research, the dependent variable will be customer loyalty. Furthermore, the independent variable can be defined as the variable that will affect the dependent variable (Cooper & Schindler, 2014). This independent variable will whether positively or negatively impacting the dependent variable (Cooper & Schindler, 2014). On this research, the dependent variable or the predictor variable will be brand equity. In addition, the intervening variable or mediating variable is variable that is expected to give effect on the relationship between dependent and independent variable (Cooper & Schindler, 2014). Thus, the intervening variable or mediating variable on this research will be customer satisfaction.
189 The researcher will use nominal and interval data for this research. Nominal data will be used for the screening question such as respondents’ profile in terms of gender. Also, the researcher will use interval data for average brand equity indicators, customer satisfaction indicators, and customer loyalty indicators by using five-point of Likert Scale. The five-point of Likert Scale is divided into very disagree, disagree, neutral, agree, and very agree. Therefore, the respondents are asked how agree or disagree they are with the question or the statement asked in the questionnaire.
This research will use the simple random sampling method that is included in the probability sampling. The simple random sampling method means that each person in the population will have nonzero probability to be elected as the sample (Cooper & Schindler, 2014). The simple random sampling method will allow the researcher to generalize the characteristic of the population (Cooper & Schindler, 2014). In addition, the population of this research will be people in Surabaya that have ever purchased Starbucks products. Therefore, the researcher will distribute the online questionnaire to people in Surabaya that have ever purchased Starbucks products.
RESULTS AND DISCUSSION
On this research, the researcher had distributed 228 questionnaires to respondent around Surabaya via online through Google form. In addition all the questionnaires were fully filled by the respondents. It means the researcher can use all the data for the analysis. After the researcher gathered the data, the researcher will conduct analyses and tests. First, the researcher will do the descriptive analysis which is analyzing the respondents’ profile such as gender, age, average spending, and purchase frequency. Second, the researcher will check the validity and reliability of the variables which is brand equity, customer satisfaction, and customer loyalty. Third, the researcher will continue to conduct the assumption tests which consist of multicollinearity test, heteroscedasticity test, and normality test. Then, the researcher will conduct the mediation analysis with sobel.
On this research, the researcher also did screening questions to analyze the respondents’ profile such as gender, age, average spending, and purchase frequency. In addition, from the questionnaires it is known that 100% of the respondents have ever purchased Starbuck. In other words, 228 respondents have ever purchased Starbucks in Surabaya. The gender proportion of this research can be divided into two, male and female. On this research, there are 110 female respondents and also there are 118 male respondents.
In addition, the most respondents are coming from the age of 17 until 25 years old with the total of 164 respondents out of 228 respondents, then it is followed by less than or equals to 16 years old with the total of 39 respondents, more than or equals to 42 years old with the total of 14 respondents, 34 until 41 years old with the total
of 6 respondents, and last but not least 26 years until 33 years old with the total of 5 respondents.
From the screening questions, the researcher also can be able to know how much the average spending to purchase Starbucks per transactions. From the questionnaire results, it is shown that most of the respondents or 116 respondents spend Rp 50.001,- until Rp 75.000,- to purchase Starbucks per transaction. It is followed by less than or equals to Rp 50.000,- for about 75 respondents, Rp 75.001,- until Rp 100.00,- for about 16 respondents, Rp 100.001,- until Rp 125.000,- for about 13 respondents, and more than or equals to Rp 125.001,- for about 8 respondents. It also known that most of the respondents purchase Starbucks once a month. It is followed by 2 (two) until 5 (five) times per month, 6 (six) until 9 (nine) times per month, and above 10 times per month.
After analyzing the screening questions, the researcher will go to the next step which is conducting reliability and validity test. These tests are needed so that the data from the questionnaires are free from bias and distortion. As it is explained on the previous chapter, the data on the questionnaire will be considered as reliable when the data is consistent and stable. The reliability can be seen from the result of Cronbach’s Alpha. When the Cronbach’s Alpha (α) is above the 0.60, it means that the respondent’s answer is consistent (Sufren & Natanael, 2014). It means that the higher the Cronbach’s Alpha (α), the higher the reliability (Sufren & Natanael, 2014).
In addition, validity test will measure whether the questionnaire is valid or not (Ghozali, 2013). According to Ghozali (2013), a questionnaire can be considered valid when the indicators in the questionnaire can measure what researcher want to measure. To conduct validity test, the researcher will see the bivariate correlation between each indicator with the total score construct. When the result of Sig. (2-tailed) on the correlations table is below 0.05, it means the each indicator is valid.
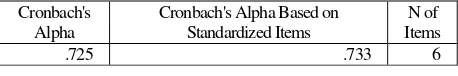
The reliability of brand equity can be seen from the result of Cronbach’s Alpha. From the result of SPSS, it is shown that the Cronbach’s Alpha is 0.725 which is more than 0.6. Therefore, it can be concluded that brand equity as a variable is reliable and it can be used for the further analysis.
Table 1. Reliability Statistics of Brand Equity
Cronbach's Alpha
Cronbach's Alpha Based on Standardized Items
N of Items
.725 .733 6
190 The reliability of customer satisfaction can be seen from the result of Cronbach’s Alpha. From the result of SPSS, it is shown that the Cronbach’s Alpha is 0.655 which is more than 0.6. Therefore, it can be concluded that customer satisfaction as a variable is reliable and it can be used for the further analysis.
Table 2. Reliability Statistics of Customer Satisfaction
Cronbach's Alpha
Cronbach's Alpha Based on Standardized Items
N of Items
.655 .717 4
In addition, the validity test of customer satisfaction can be seen from the correlation among the indicators (CS1, CS2, CS3, and CS4) towards the total score of customer satisfaction indicators. When the result of Sig. (2-tailed) on the correlations table is below 0.05, it means the each indicator is valid. Moreover, the result of all result of Sig. (2-tailed) on the correlations table is below 0.05, it means, each indicator is valid or in another words, each indicator of customer satisfaction in the questionnaire can measure what researcher want to measure.
The reliability of customer loyalty can be seen from the result of Cronbach’s Alpha. From the result of SPSS, it is shown that the Cronbach’s Alpha is 0.795 which is more than 0.6. Therefore, it can be concluded that customer loyalty as a variable is reliable and it can be used for the further analysis.
Table 3. Reliability Statistics of Customer Loyalty
Cronbach's Alpha
Cronbach's Alpha Based on Standardized Items
N of Items
.795 .802 5
In addition, the validity test of customer loyalty can be seen from the correlation among the indicators (CL1, CL2, CL3, CL4, and CL5) towards the total score of customer loyalty indicators. When the result of Sig. (2-tailed) on the correlations table is below 0.05, it means the each indicator is valid. Moreover, the result of all result of Sig. (2-tailed) on the correlations table is below 0.05, it means, each indicator is valid or in another words, each indicator of customer loyalty in the questionnaire can measure what researcher want to measure.
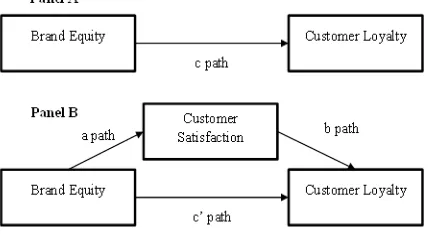
After all of the data are considered valid and reliable, the researcher will conduct other tests called classic assumption test which are multicollinearity, heteroscedasticity, and normality test. As this research will use four path which are brand equity towards customer satisfaction (a path), customer satisfaction towards customer loyalty by controlling the brand equity (b path), brand equity towards customer loyalty (c path), and brand equity towards customer loyalty by controlling customer satisfaction (c’ path) for analysis as explained in the previous chapter, this research will also conduct classic assumption test to those four path. The path can be shown on the figure below.
First test is called multicollinearity test. Multicollinearity is used to test whether there is correlation among the independent variables. From the four path (a path, b path, c path, and c’ path), multicollinearity test will be conducted on b path and c’ path since those path have independent variables more than one. Therefore, this research will conduct multicollinearity test to see the correlation between brand equity and customer satisfaction as those are the independent variables of b path and c’ path.
According to Ghozali (2013), a regression model is considered good when there is no correlation among the independent variables or no multicollinearity. No Multicollinearity exist when the correlation between independent variables are below 0.9, the tolerance in collinearity statistics is above 0.10, and the variance inflation factor (VIF) is less than 10. From the result, it can be seen that the correlation between independent is below 0.9 which is -0.729 or it is about 72%. Since it is still below 0.9, it means, there is no multicollinearity. the tolerance in the collinearity statistics table is above 0.10 which is 0.469. Also, from the variance inflation factor (VIF), it can be seen that the VIF is below 10 which is 2.134 for both brand equity and customer satisfaction.
The second test is heteroscedasticity test. The purpose of doing heteroscedasticity test is to know whether inside the regression model is having different variance from residual of one observation to other observation (Ghozali, 2013). To test the heteroscedasticity, the researcher will use Glejser test.
When Sig. in the coefficient table is greater than 5%, it means it accepts null hypothesis or it means there is no heteroscedasticity in residuals.
After the Glejser test is run on the SPSS program, the result shown on the Sig. table is all greater than 5%. It means it accepts null hypothesis or it means there is no heteroscedasticity in residuals.
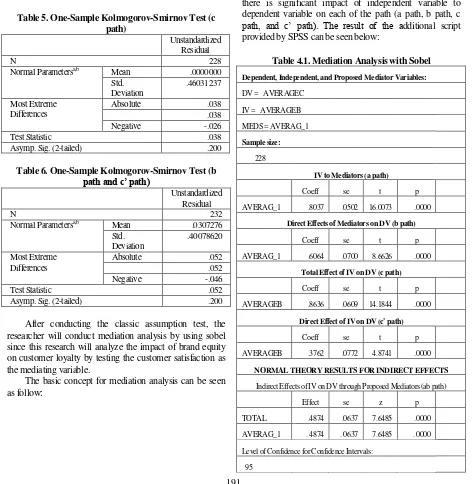
The third test is called normality test. The objective of normality test is to know whether the residual has a normal distribution or not (Ghozali, 2013). One of the ways to conduct normality test is by conducting Kolmogorov-Smirnov test.
Furthermore, the normality test can be analyzed by seeing the result of Asymp. Sig. (2-tailed) from the SPSS. If the significance is lower than 0.05, H0 is rejected. It means
191 when it is higher than 0.05, it accepts the null hypothesis and the data are normally distributed. From the result of Kolmogorov-Smirnov test, it shown that the asymptotic significance for two-tailed is 0.200. The value of 0.200 is greater than 0.05. It means, all the data on a path, b path, c path, and c’ path are normally distributed.
Table 4. One-Sample Kolmogorov-Smirnov Test (a path)
Unstandardized Residual
N 228
Normal Parametersa,b Mean .0000000
Std. Deviation
.37959240
Most Extreme Differences Absolute .048
.048
Negative -.043
Test Statistic .048
Asymp. Sig. (2-tailed) .200
Table 5. One-Sample Kolmogorov-Smirnov Test (c path)
Unstandardized Residual
N 228
Normal Parametersa,b Mean .0000000
Std. Deviation
.46031237
Most Extreme Differences
Absolute .038
.038
Negative -.026
Test Statistic .038
Asymp. Sig. (2-tailed) .200
Table 6. One-Sample Kolmogorov-Smirnov Test (b path and c’ path)
Unstandardized Residual
N 232
Normal Parametersa,b Mean .0307276
Std. Deviation
.40078620
Most Extreme Differences
Absolute .052
.052
Negative -.046
Test Statistic .052
Asymp. Sig. (2-tailed) .200
After conducting the classic assumption test, the researcher will conduct mediation analysis by using sobel since this research will analyze the impact of brand equity on customer loyalty by testing the customer satisfaction as the mediating variable.
The basic concept for mediation analysis can be seen as follow:
To analyze the mediation, the researcher will see the result from the additional script from SPSS that is shown in the table 4.15. From the result, it can be seen that the t-test from all paths (a,b,c,c’) are significant. It is shown by the result of p-value that is lower than 0.05. In other words, there is significant impact of independent variable to dependent variable on each of the path (a path, b path, c path, and c’ path). The result of the additional script provided by SPSS can be seen below:
Table 4.1. Mediation Analysis with Sobel
Dependent, Independent, and Proposed Mediator Variables:
DV = AVERAGEC
IV = AVERAGEB
MEDS = AVERAG_1
Sample size:
228
IV to Mediators (a path)
Coeff se t p
AVERAG_1 .8037 .0502 16.0073 .0000
Direct Effects of Mediators on DV (b path)
Coeff se t p
AVERAG_1 .6064 .0700 8.6626 .0000
Total Effect of IV on DV (c path)
Coeff se t p
AVERAGEB .8636 .0609 14.1844 .0000
Direct Effect of IV on DV (c' path)
Coeff se t p
AVERAGEB .3762 .0772 4.8741 .0000
NORMAL THEORY RESULTS FOR INDIRECT EFFECTS
Indirect Effects of IV on DV through Proposed Mediators (ab path)
Effect se z p
TOTAL .4874 .0637 7.6485 .0000
AVERAG_1 . 4874 . 0637 7.6485 . 0000
Level of Confidence for Confidence Intervals:
95
192 Then, when the Z-score is greater than 1.96, it means there is a mediation effect inside the model analyzed on this research. From the calculation inside the additional script, the Z-score is 7.6485 which is greater than 1.96. It means there is mediation effect inside the model. Nevertheless, the mediation on this model is considered as partial mediation. The reason is that the result of c’ path or the impact of independent variable (X) on dependent variable (Y) is significant (p-value is lower than 0.05) when the mediating variable (M) is inserted.
After analyze all the data collected from the questionnaires, the researcher will discuss one by one about the four hypotheses that are stated on the previous chapter. Also, the researcher will compare the result of this research with the previous relevant researches that have been stated on the previous chapter.
The first hypothesis is brand equity (perceived quality, brand association, and brand awareness) simultaneously has impact to customer satisfaction of Starbucks in Surabaya. From a path analysis, it shows the coefficient value 0.8037 and it shows that the p-value is 0.0000. When the p-value is lower than the significant value of 0.05, it means the brand equity (perceived quality, brand association, and brand awareness) simultaneously has impact to customer satisfaction of Starbucks in Surabaya. The result of this research is supporting the previous relevant research from Budiarti, Surachman, Hawidjojo, and Djumahir (2013). All the indicators used in this research are also used inside the research of Budiarti, Surachman, Hawidjojo, and Djumahir (2013). The indicators are brand association, brand awareness, and perceived quality. Although the research of Budiarti, Surachman, Hawidjojo, and Djumahir (2013) analyze about different industry, it is proven that the brand equity simultaneously has impact to customer satisfaction.
The second hypothesis is customer satisfaction has impact to customer loyalty of Starbucks in Surabaya. From b path analysis, it shows the coefficient value of 0.6064 and it shows that the p-value is 0.0000. When the p-value is lower than the significant value of 0.05, it means customer satisfaction has impact to customer loyalty of Starbucks in Surabaya. In addition, the result of this research is supporting the previous relevant research from Budiarti, Surachman, Hawidjojo,and Djumahir (2013) and Logiawan and Subagio (2014). To analyze the customer satisfaction and customer loyalty, this research has several indicators. The indicators of customer satisfaction are happiness, expectation, and spending. The indicators of customer loyalty are repeat purchase, positive comments, and recommendation. On the case of the research of Budiarti, Surachman, Hawidjojo,and Djumahir (2013), the indicators of customer satisfaction are overall satisfaction, expectation confirmation, and ideal comparison while the indicators of customer loyalty are cognitive loyalty, conative loyalty, and affective loyalty. On the case of Logiawan and Subagio (2014), the indicators of customer satisfaction are attributes related to product, attributes related to service, and attributes related to purchase, meanwhile the indicators of customer loyalty are say positive thing, recommend friends, and continue purchasing. Although, the indicators of one
research and others are different, all of those are measuring the same things which are the impact of customer satisfaction towards customer loyalty. Therefore, it can be concluded that both of those previous researches and this have proven that customer satisfaction has impact to customer loyalty.
The third hypothesis is brand equity (perceived quality, brand association, and brand awareness) simultaneously has impact to customer loyalty of Starbucks in Surabaya. From c path analysis, it shows the coefficient value of 0.8636 and it shows that the p-value is 0.0000. When the p-value is lower than the significant value of 0.05, it means brand equity (perceived quality, brand association, and brand awareness) simultaneously has impact to customer loyalty of Starbucks in Surabaya. The result of this research is supporting the previous relevant research from Rofiq, Suryadi, and Faidah (2009) and Budiarti, Surachman, Hawidjojo, & Djumahir (2013). Nevertheless, the indicators of brand loyalty used on this research are different compared to the previous research although it measures the same thing which is the impact of brand equity towards customer loyalty. From the previous relevant research and this research, it can proof that the brand equity simultaneously gives impact to customer loyalty.
The fourth hypothesis is brand equity has impact towards customer loyalty mediated by customer satisfaction of Starbucks in Surabaya. From sobel analysis, it shows Z-score is 7.6485. When the positive Z-Z-score is greater than 1.96, it means there is a mediation effect inside the model analyzed on this research. Nevertheless, the mediation on this model is considered as partial mediation. The reason is that the result of c’ path or the impact of independent variable (X) on dependent variable (Y) is significant (p-value is lower than 0.05) when the mediating variable (M) is inserted. In conclusion, the brand equity has impact towards customer loyalty, mediated by customer satisfaction of Starbucks in Surabaya.
CONCLUSION
In conclusion, this research shows that brand equity (perceived quality, brand association, and brand awareness) simultaneously gives impact to customer satisfaction of Starbucks in Surabaya, customer satisfaction gives impact to customer loyalty of Starbucks in Surabaya, brand equity (perceived quality, brand association, and brand awareness) simultaneously gives impact to customer loyalty of Starbucks in Surabaya, and brand equity gives impact customer loyalty, mediated by customer satisfaction of Starbucks in Surabaya.
There are several recommendations that will be suggested by the researchers for Starbucks in Surabaya to improve the current performance and to be able to compete with the fierce competition. The recommendations that can be done by Starbucks are promote healthy campaign, keep improving the quality of products and services, and crowdsourcing products development.
193 research is Starbucks. Nevertheless, the scope of this research is only in Surabaya area while Starbucks has not only stores in Surabaya but also all over cities in Indonesia. Since Starbucks, the subject of this research is located in many different areas for example in Jakarta, Surabaya, Bandung, and other cities, the researcher gives suggestion to conduct this kind of research in other cities besides Surabaya. In addition, it is also possible to conduct this kind of research with national scope which is Indonesia. By conducting this kind of research with different scope, the further research may compare whether the result coming from different scope may result in different conclusion.
Second, the analysis is emphasized more on the statistical result by spreading the online questionnaires to the respondents. Nevertheless, this statistical result gives limitation to the researcher to explain the impact of brand equity of Starbucks in Surabaya on customer loyalty when it is mediated by customer satisfaction in a deeper way. Since this research is more about the consumer behavior, it is also needed to give additional method such as interview or focus group discussion so that the researcher can know the deep reason of certain behavior of the respondent.
REFERENCES
A. Aaker, D. (1996). Measuring Brand Equity Across Products and Markets. California Management Review Voll 38. No.3, pp. 102-120.
Aaker, D. A. (1991). Managing Brand Equity. New York, United States of America.
Alyasa, F. H., & Kusnilawati, N. (2012). Analisis Pengaruh Equitas Merek (Brand Equity) Terhadap Loyalitas Konsumen Pada Produk Sepeda Motor Kawasaki Ninja. Jurnal Mahasiswa Q-MAN, Volume 1, No.3, Mei 2012, 1-14.
Andreassen, T. W., & Lindestad, B. (1998). Customer Loyalty and Complex Services. Emerald Insight, 7-23.
Andreassen, T. W., & Lindestad, B. (1998). Customer Loyalty and Complex Services the Impact of Corporate Image on Quality, Customer Satisfaction and Loyalty for Customers with Varying Degrees of Service Expertice. International Journal of Service Industry Management Vol 9, No.1, 7-23.
Aryani, D., & Rosinta, F. (2010). Pengaruh Kualitas Layanan terhadap Kepuasan Pelanggan dalam Membentuk Loyalitas Pelanggan. Bisnis & Birokrasi, Jurnal Ilmuu Administrasi dan Organisasi, Mei-Agustus, 114-126.
Bae, Y. H. (2012). Three Essays on the Customer Satisfaction-Customer Loyalty Association. Iowa Research.
Baum, C. F., & Schaffer, E. M. (2013, July). A general approach to testing for autocorrelation. Retrieved May 7, 2015, from A general approach to testing
for autocorrelation:
http://www.econ.uiuc.edu/~wsosa/econ471/autoc orrelation.pdf
BPS Kota Surabaya. (2015). Badan Pusat Statistic Kota Surabaya. Retrieved February 25, 2015, from http://surabayakota.bps.go.id/
Budiarti, A., Surachman, S., Hawidjojo, D., & Djumahir, D. (2013). Brand Equity and Customer Satisfaction as the Mediation of Advertisement Influence and the Service Quality to Loyalty the Passengers of International Flight at Garuda Indonesia Airlines. IOSR Journal of Business and Management Volume 9, Issue 2, 1-15.
Budiman, D., Naibaho, H., & Amelia. (2013). Pengaruh Kualitas Layanan, Kualitas Produk, Kepuasan Pelanggan Terhadap Kesetiaan Merek Starbucks di Surabaya. Jurnal GEMA AKTUALITA VOL. 2 NO. 1, 81.
”Cafe dan Restoran di Surabaya Tumbuh Hingga 20% Setiap Tahunnya". (2013, Oct 26). Cafe dan Restoran di Surabaya Tumbuh Hingga 20% Setiap Tahunnya. Retrieved February 26, 2015, from http://whatindonews.com/id/post/11660 Caruana, A. (2002). Service Loyalty The Effect of Service
Quality and The Mediating Role of Customer Satisfaction. European Journal of Marketing Vol. 35 No. 78, 2002, 811-828.
Cengiz, E. (2010). Measuring Customer Satisfacton: Must or Not? Journal of Naval Science and Engineering Vol. 6 No. 2, 76-88.
Chandra, S. (2014). The Impact of Customer Experience toward Customer Satisfaction and Loyalty of Ciputra World Surabaya. Surabaya: The Faculty of Economy Petra Christian University.
CNN Indonesia. (2014, October 10). Bisnis Kopi. Retrieved February 17, 2015, from 2015, Starbucks Tambah
35 Gerai Baru:
http://www.cnnindonesia.com/ekonomi/2014101 0111851-92-5998/2015-starbucks-tambah-35-gerai-baru/
Cooper, R. R., & Schindler, P. S. (2014). Business Research Methods. Mc Graw Hill.
Durianto, D., Sugiarto, & Sitinjak, T. (2004). Strategi Melakukan Pasar Melalui Riset Ekuisitas dan Perilaku Merek. Jakarta: PT Gramedia Pustaka Utama.
Empathica Inc. (2012, March 2nd). Starbucks doesn't Just Sell Coffee, It sells Experience. Retrieved from Empathica:
http://www.empathica.com/resource/r4-starbucks- doesn%E2%80%99t-just-sell-coffee-it-sells-experience/
Euromonitor. (2014, December). Retrieved February 17, 2015, from Cafe/ Bars in Indonesia: http://www.euromonitor.com/cafes-bars-in-indonesia/report
Ghozali, H. I. (2013). Aplikasi Analisis Multivariate dengan Program IBM SPSS 21. Semarang: Badan Penerbit Universitas Diponegoro.
194
http://authoritynutrition.com/top-13-evidence-based-health-benefits-of-coffee/
Hawkins, D. I., & Mothersbaugh, D. L. (2013). Consumer Behavior Building Marketing Strategy 12th edition. United States of America: McGraw-Hill. Hotson, J. (2014, Septermber 25). Customer Loyalty vs.
Brand Loyalty. Retrieved March 18, 2015, from http://www.retentionscience.com/customer-loyalty-vs-brand-loyalty/
Inilah Postur Ekonomi Surabaya Saat Ini. (2014, May 31). Retrieved February 2015, 2015, from http://www.suarasurabaya.net/fokus/222/2014/13 5162-Inilah-Postur-Ekonomi-Surabaya-Saat-Ini Investopedia. (2015). Brand Loyalty. Investopedia, LLC. Jawa Pos. (2015, January 5). Proyeksi Surabaya 2015, Apa
Saja Yang Baru? Retrieved February 5, 2015, from
http://www.jawapos.com/baca/artikel/11079/Proy eksi-Surabaya-2015-Apa-Saja-Yang-Baru Jones, M. A., Mothersbaugh, D. L., & Beatty, S. E. (2000).
Switching Barriers and Repurchase Intentions in Services. Journal of Retailing, 259-274.
Jørgensen, T. H. (2013, May). The Importance of Brand Equity in Coffee Shop Chains. Canada.
Kotler, P., & Keller, K. L. (2012). Marketing Management 14th Edition. Pearson Education Limited. Lassar, W., Mittal, B., & Sharma, A. (1995). Measuring
Customer-Based Brand Equity. Emerald Insight, 11-19.
Logiawan, Y., & Subagio, H. (2014). Analisa Customer Value Terhadap Customer Loyalty dengan Customer Satisfaction Sebagai Variable Intervening pada Restoran Bandar Djakarta Surabaya. Jurnal Management Pemasaran Petra Vol.2, No. 1, (2014) 1-11, 1-11.
Long, C. S., Wan Ismail, W. K., Abdul Rasid, S. Z., Hwee, K. B., & Jiun, L. Y. (2013). Sustaining Customers' Loyalty: A Survey of a Coating Resins Manufacturer. Journal of Scientific & Industrial Research, 731-734.
Manoy, G. F. (2015). Retrieved February 19, 2015, from
Pembentukan Citra Starbucks:
https://www.academia.edu/5627435/PEMBENT UKAN_CITRA_STARBUCKS
Mosahab, R., Mahamad, O., & Ramayah, T. (2010). Service Quality, Customer Satisfaction and Loyalty: A Test of Mediation. International Business Research Vol.3, No.4, 72-80.
Nam, J., Ekinci, Y., & Whyatt, G. (2011). Brand Equity, Brand Loyalty, and Consumer Satisfaction. Elsevier Ltd, 1009-1030.
Oxford Dictionaries. (2015). Oxford Dictionaries. Retrieved
March 8, 2015, from
http://www.oxforddictionaries.com/definition/eng lish/satisfaction
Pakuwon Hadirkan Fasilitas Hunian Lifestyle Di Surabaya Timur. (2015, February 26). Retrieved February
26, 2015, from
http://surabaya.bisnis.com/read/20150226/9/7859
1/pakuwon-hadirkan-fasilitas-hunian-lifestyle-di-surabaya-timur
Pappu, R., & Quester, P. (2006). Does Customer Satisfaction Lead to Improved Brand Equity? An Empirical Examination of Two Categories of Retail Brands. Emerald Group Publising Limited (Journal of Product and Brand Management), 4-14.
Pascasari, P. D., & Bernarto, I. (2009). Pengaruh Ekuitas Merek Terhadap Kepuasan Konsumen The Coffee Bean and Tea Leaf, Benton Junctiokn, Lippo Karawaci. DeReMa Jurnal Management Vol. 4 No. 1.
Percepatan Infrastructur Bakal Pacu Pertumbuhan 15%. (2014, September 14). Retrieved February 25,
2015, from
http://lifestyle.bisnis.com/read/20140914/223/257 191/percepatan-infrastruktur-bakal-pacu-pertumbuhan-15
Preacher, K. J., & Hayes, A. F. (2004). SPSS and SAS procedures for estimating indirect. Behavior Research Methods, Instruments, & Computers 2004, 36 (4),, 717-731.
Preacher, K. J., & Leonardelli, G. J. (2001, March). Calculation for the Sobel Test. Retrieved April 17, 2015, from An interactive calculation tool for
Mediation tests:
http://quantpsy.org/sobel/sobel.htm
Rencana Kerja Pembangunan Daerah Kota Surabaya Tahun 2014. (2014). Retrieved February 26, 2015, from jdih.surabaya.go.id
Rofiq, A., Suryadi, N., & Faidah, N. N. (2009). Peranan Ekuitas Merek terhadap Loyalitas Pelanggan pada Industri Telpon Seluler. The 3rd National Conference on Management Research.
Sondoh, S. L., Omar, M. W., & Wahid, N. A. (2007). The Effect of Brand Image on Overall Satisfaction and Loyalty Intention in the Context of Color Cosmetics. Asian Academic of Managemetn Journal, Vol. 12, No. 1, 83-107.
Starbucks Coffee Indonesia. (2012, September 27). Starbucks Ranks as Top 10 Brand in Indonesia. Retrieved from Starbucks.co.id: www.starbucks.co.id
Starbucks Coffee Indonesia. (2015). Retrieved February 19, 2015, from Starbucks Celebrates the Opening of its First Train Station Store in Indonesia: www.starbucks.co.id
Starbucks Coffee Indonesia. (2015). Starbucks in Indonesia. Retrieved February 27, 2015, from
http://www.starbucks.co.id/about-us/our-heritage/starbucks-in-indonesia
Starbucks Corporation. (2013). Starbucks Corporataion 2013 Annual Fiscal. Starbucks Corporation. Starbucks Corporation. (2015). Retrieved February 19,
2015, from Starbucks Company Profile.
195 http://www.starbucks.com/about-us/company-information
Starbucks Corporation. (2015). Store Locator. Retrieved from http://www.starbucks.co.id/about-us/our-heritage/starbucks-in-indonesia
Starbucks Corporation Company. (2015). Retrieved February 19, 2015, from Starbucks Corporation Company: http://www.hoovers.com/company-
information/cs/company-profile.Starbucks_Corporation.824509ef484db9e 9.html
Sufren, & Natanael, Y. (2014). Belajar Otodidak SPSS. Jakarta: PT Elex Media Komputindo.
Suliyanto. (2012). Retrieved April 30, 2015, from
REGRESI DENGAN VARIABEL
INTERVENING: http://maksi.unsoed.ac.id/wp- content/uploads/2012/04/Regresi-Variabel-Intervening1.ppt
SWA. (2013, June 1). Setelah 11 Tahun, Starbucks Luncurkan Starbucks Card. Retrieved from SWA: http://swa.co.id/business-strategy/setelah-11-tahun-starbucks-luncurkan-starbucks-card Tindow, M. I., Mekel, P. A., & Sendow, G. M. (2014).
Disiplin Kerja, Motivasi dan Kompensasi Pengaruhnya terhadap Karyawan pada PT. Bank Sulut Cabang Calaca. Jurnal EMBA, 1594-1606. Vierra, P. (2010, December 24). Customer vs. Brand
Loyalty. Retrieved March 18, 2015, from https://honuwerkz.wordpress.com/2010/12/24/cus tomer-vs-brand-loyalty/
Walsh, G., Evanschitzky, H., & Wunderlich, M. (2008). Identification and Analysis of Moderator Variables Investigating the Customer Satisfaction-Loyalty Link. European Journal of Marketing Vol.42, No. 9/10, 977-1004.
Wawancara Bos Starbucks Indonesia: Tak Cukup di Mal. (2013, August 11). Retrieved from http://www.tempo.co/read/news/2013/08/11/0935 03605/Wawancara-Bos-Starbucks-IndonesiaTak-Cukup-di-Mal
Wibowo, A. S. (2005). 27 Siasat Menembus Pasar. Jakarta: PT Elex Media Komputindo.
Widjaja, M., Wijaya, S., & Jokom, R. (2007). Analisis Penilaian Konsumen terhadap Ekuitas Merek Coffee Shops di Surabaya. Jurnal Managemen Perhotelan, Vol.3, No.2, 89-101.