Biharmonic Protein Function In MOCORIN
and Its Optimization
Parhusip,H.A
1, Hartini
2 1Departement of Mathematics, Satya Wacana Christian University, Salatiga, Indonesia.
E-mail:
2
Departement of Chemistry, Satya Wacana Christian University, Salatiga, Indonesia.
E-mail:[email protected]
Abstract
-
Optimal protein in MOCORIN is studied due to the observed carbohydate and mass from 5 types of data whichare mixtures of yellow corn and rice brand. The proportions of rice brand are 0% (only yellow corn),12.5%,25%,37.5%, 50% respectively . The obtained of protein is considered to be a biharmonic function. The function is possible to be convex or concave. Therefore one can not have only maximum value of protein.
The parameters are firstly determined to construct the objective function for each set of data. One obtains maximum and minimum properties of these functions. Each function is optimized using fmincon.m function in MATLAB and its convexity/concavity is studied to guarantee the optimal value of protein.
The result shows that 37.5% of rice brand is the best proportion to maximize the content of protein where carbohydrate and mass are taken into account.
Abstrak-Protein optimal pada MOCORIN dipelajari pada makalah ini dimana protein merupakan fungsi massa dan karbohidrat dari 5 tipe himpunan data yang merupakan campuran jagung dan bekatul dengan bekatul termuat berturut-turut 0%, 12.5%,25%,37.5% dan 50%. Diasumsikan protein merupakan fungsi biharmonik yang dapat konveks dan konkaf. Jadi nilai maksimum protein tidak selalu diperoleh.
Parameter pada fungsi harmonik perlu dicari terlebih dahulu untuk setiap himpunan data yang memenuhi sifat maksimum ataupun minimum. Setiap fungsi dioptimasi dengan bantuan fungsi fmincon dengan MATLAB. Konveksitas dan konkavitas juga diamati untuk menjamin secara teoritis untuk fungsi yang diperoleh. Hasil menunjukkan bahwa 37.5% bekatul merupakan proporsi terbaik untuk mendapatkan protein yang maksimum dimana massa dan karbohidrat diperhatikan.
Keywordsbiharmonic, convexity, Lagrangian, interpolation, Hessian
I.INTRODUCTION 1
T
here are two objective functions required to set up optimization problem based on the given data,i.e the first objective function is due to parameter determination and the second one is due to optimal values of the obtained objective function after the parameters are found. Before solving the second optimization problem, one needs to have some basic properties of the chosen objective function such as a convex function in a convex domain leads to minimum value of the objective function and a concave function in a concave domain leads to a maximum value. However two properties may be hold locally in some subdomains. These situations are found in this paper since the given data provide these two properties,i.e convexity and concavity of the obtained objective functions. Hence to model a minimization problem one needs convexity of an objective function and only some data satisfy in this research.Five sets of data are taken from observation of nutritional values of MOCORIN (Modification Of Bisi 2 Variety Yellow Corn (Zea Mays L.) - Rice Brand Flour) done in Chemistry Department of SWCU 2012 where some experiments were set up to study moisture content, mineral content, protein content by biuret method, fat content, carbohydrate content by anthrone method, fiber content and making of “cat's tongue” cookies. The
materials were the mixtures between yellow corn and rice brand with proportion 0%,12.5%,25%, 37.5%, 50% respectively (Silvia,2012). Since there are 5 sets of data, will be 5 objective functions to optimize. Each set has a set of parameters that relates to each objective function. We focus on this study by considering that the protein content depends on mass and carbohydrate contents, one needs to find optimal value of protein and yields best proportion.
Some variables must be introduced which are all dimensionless, i.e all variables are in the interval (0,1], these are : M := mass ; K:= carbohydrate; and P:= protein. In this research, we consider firstly that protein (P), carbohydrate (K) and mass (M) are dependent variables which are functions of absorbances. By interpolating each variable to the used absorbance, protein is then considered to be dependent variable and carbohydrate and mass are its independent variable. Assuming protein as a biharmonic function of carbohydrate and mass, one has 5 continuous objective functions.
Construction of biharmonic functions and some underline theories are shown in the next sections. The results of its optimization are discussed in the analysis.
II.DESIGN OF OBJECTIVE FUCTION AND ITS OPTIMIZATION
2.1 Optimization of biharmonic function with Karush Kuhn Tucker theorem
2
International Seminar on Applied Technology, Science, and Art (4th APTECS 2013)differential equation. Positive preserving property (spesific boundary condition was prescribed) were observed in biharmonic equation for arbitrarily smooth uniformly convex domains (Grunau,2009) .
One possible solution is a linear combination of Green functions centered at each data point for one dimensional biharmonic operator. In two dimensional case, Green functions were applied to create interpolation technique (Sandwell,1987) to produce and accurate sea surface topography maps from satellite altimeter profiles. Numerical solution was proposed (Arad,et.all,1997) with two types of boundary conditions for rectangular domain using 9 stencil of discretization scheme. In this paper, the biharmonic function is the solution of the forth order of partial differential equation in the form
0 2 4 4 2 2 4 4 4 M P K M P K P
. (1)
The analytic representation of P(K,M) had been known (Ugail,2006) and its representation was a trigonometrical combination of a separable function, i.e
) sin( ) ( ) cos( ) ( ) ,
(K M X K nM X K nM
P
(2) where n is an integer number (here,n=2) and X(K) was also investigated on (Ugail,2006), i.e
nK nK nK nK
Ke
c
e
c
Ke
c
e
c
K
X
(
)
1
2
3
4 (3)The parameters are
c
1,
c
2,
c
3,
c
4 and n were analytically completely defined. However in order to simplyfy the procedure, we use least square method to find the bestc
1,
c
2,
c
3,
c
4and n is fixed (here,n=2). As soon as these parameters are found, one needs a standard optimization procedure i.e minimize
21 model , data ,
N i i i P P R (4) whereP
i,model given by Equation (2)-(3) . Denotingy
to be the vector in R with each component isy
i
model , data
, i
i
P
P
,
i
, then Eq.(4) in vector form isy
y
R
T
. The best parametersc
1,
c
2,
c
3,
c
4must satisfy
R
0
. Solving this nonlinear system leads to find critical solution of R.2.2 Optimization of biharmonic function with Karush Kuhn Tucker theorem
Karush Kuhn-Tuckert theorem (Peressini,et.all,1987) guarantees the existence of solution in the convex domain (D) due to the minimization Lagrangian
n i i ig K M M K f M K L 1 ) , ( ) , ( ) , , ( as a convex program,i.e:
minimize f(K,M) (P.1)
subject to the constraints gi(K,M)0 (P.2) where x
K,M
TD.The optimizer
TM K
x* * *
,
exists if only if there is a
n R
*
such that
1) *0
2) ( , ) ( , ) ( , )
* * * * x L x L x
L
for all
T M K
x , and
03) * ( *)0
x gi i
for all i =1,2,...,m
The proof has been shown rigouriously and the fmincon.m function provided by MATLAB will be implemented to find the optimizers automatically without solving the gradient of L . The sufficient conditions for the
local optimal
TM K
x* * *
,
are
1) *
0
2)
i*g
i
x
*
0
,
i
I
.
3)
* 0;1 * *
x g x f i m i i The optimization result will be analyzed based on this theorem. Defining the problem into standard problem in Eq.(P.1) and Eq.(P.2) in fmincon.m, one yields the optimizers.
Additionally, the convexity of the objective function is also required where we assume that the given domain is a convex subset D of
R
n. By assuming) , (K M
f has continuous first partial derivatives on D,
then the function
) , ( )
(x f K M
f is convex if and only if
y x
f y fx
f() for all
x
,y
in D. (P.3) One may recall the complete proof in the literature (Peressini,et.all,1987,page 52-53). There exists an other definition of convexity which depends on a parameter andf
is not required. For simplicity, we will use the definition given by Eq.(P.3)However the objective function needs to be maximized, and hence instead of convexity, one needs the objective function must be concave, which means that the inequality sign in Eq.(P.3) must be defined reversely.
Unfortunately, each variable depends on the used absorbances. To reduce this difficulty, all necessary variables are interpolated as functions of absorbances.
2.3 Interpolation of Protein, Carbohydrate and Mass into functions of absorbance
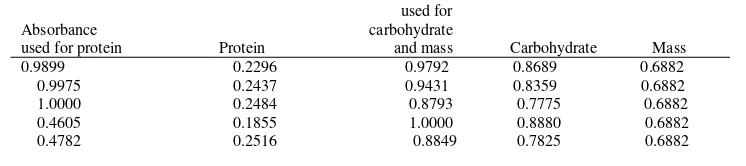
We prefer to use spline interpolation for our data set. Some exercises data are presented in Table 1. Table 1 gives us two sets of values of z which are given in the first column and the third column.
Spline interpolation relies on piecewise cubic polynomial interpolation on each two pairs consecutive data where the derivatives of each polynomial on each subinterval are taken into account. One of examples in our researchs was that this method had been used to interpolate spectrum of
charoten through aceton (Parhusip,et.all,2005). Advantages of this method are that we do not need to choose any smooth function explicitly and additional data can be generated to fit with original data. The function is available in MATLAB 6.5 (or higher version) that can be used easily. Numerical examples shown in Figure 1.Figure. 2 (left) Protein as a function of carbohydrate and mass compared to data and its surface (right)
Figure. 1.Protein(right), mass(middle) and carbohydrate (left) are interpolated to absorbances 0.001 on absorbance. If the used stesize too small (g.e
:0.001), the error of harmonic function is too big (> 30%) and hence we choose bigger stepsize. Using 0.01 stepsize of absorbance, the error harmonic function is
20.9628 %. The comparison of each data and its approximation is shown in Figure 2 (left). The error function becomes 21.0393% if we use stepsize 0.02.
TABLE 1.
SOME LISTS OF DATA OBTAINED BY OBSERVATION (DIMENSIONLESS) OF ABSORBANCE, PROTEIN DAN CARBOHYDRATE WITH NO ADDITION OF RICE BRAND (IN THE PROPORTION 100% OF YELLOW CORN)
Absorbance
used for protein Protein
Absorbance used for carbohydrate
and mass Carbohydrate Mass
International Seminar on Applied Technology, Science, and Art (4th APTECS 2013) 3
In this case protein is assumed to be the dependent variable where mass and carbohydrate are the independent variables
.
2.4 Biharmonic Protein function of carbohydrate and mass
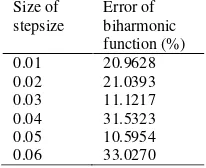
For the given data Table 1, the error may decrease for bigger stepsizes and hence we vary the stepsize for the whole given data in the research which is shown in Chapter 3.
Each set of data indicated by observation set of each proportion has some multiples values which lead to technical errors. The error is shown by comment MATLAB's spline() function complains that "the data
sites should be distinct”. Refering to some comments of programmers in web, one may replace the function spline with parametric representation of data and using interp1() function provided in MATLAB. Thus two kinds of interpolation functions are employed here to present protein , carbohydrate and mass as functions of absorbance. To guarantee that the objective function is good enough , we observe for several stepsizes and study the resulting errors as shown in Table 2. One observes that the errors do not depend on the increment of stepsize. Other properties are observed for analysis such as convexity, concavity of biharmonic functions and the obtained Hessian matrices governed by R and f.
TABLE 2.
VARIATION ERROR DUE TO STEPSIZE OF ABSORBANCE Size of
stepsize
Error of biharmonic function (%) 0.01 20.9628
0.02 21.0393
0.03 11.1217
0.04 31.5323
0.05 10.5954
0.06 33.0270
III.RESULTS AND DISCUSSION
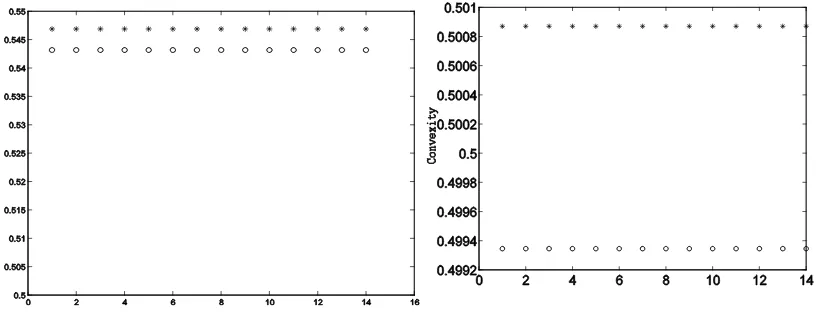
3.1 Convexity and concavity of biharmonic function The convexity and concavity are required conditions for the existences of optimal of objective function. Therefore here the convexity and concavity are studied for each set of data based on Eq.(P.3). Some observation are shown in the Figure 3-4. For 5 data sets, we have the biharmonic functions are possible to be convex and concave. Figure 3-4 illustrate that the biharmonic functions for the first three data sets are convex. The forth data set is concave and the last one is nearly undetected.
The practical application based on this result is that if the proportion of yellow corn and rice brand in the type of 87.5%:12.5% and 50%:50% then maximum protein will not be obtained. This research suggests that one may use 62.5%:37.5% for gaining maximum protein where mass and carbohydrate contents have been taken into account.
3.2 Construction of biharmonic function and its maximum
All observation data are used, i.e each proportion contains observation of protein content carbohydrate and mass contents, hence we have 5 sets of these type of data. Thus we have 5 sets of parameters in Eq.(2)-(3). Using lsqnonlin.m function provided by MATLAB, one obtains the parameters listed in Table 3. These parameters are then implemented to the objective functions subject to the given contraints, i.e the minimum of each independent variables. The objective function becomes
Maximize protein subject to the constraints :
min
M
M
andK
K
min.Without these bounds, negative values may occur which are not realistic in practical application. The function of fmincon.m is implemented to obtain minimum value of protein. Since the maximum value of protein of each set is 1, then the maximum will be 1 minus the obtained minimum and the result shown in Table 4.
Table 4 shows the maximal protein in optimal carbohydrate and mass of each proportion. Mathematically, each surface has its own local maximum and local optimizer. Of course ,we may consider that the 37.5 % of rice brand is the best proportion to produce maximum protein which its harmonic function is shown in Figure 5. Though 0% has no significant different result compared to 37.5% of rice brand, we can not rely on 0% result since it means no rice brand are added. Statistical result (Silvia,2012) showed that 50% of rice brand gave the maximal protein where protein here was not considered as a function of mass and carbohydrate. As we expected, that the optimal carbohydrate and mass satisfy the given constraints.
Additionally, the forth data set have shown the maximal protein and the biharmonic function is concave. Therefore this result satisfies the underline theory shown in Section 2.
3.3 Analysis of optimality of parameters
Note that two optimization problems appear in this research, i.e optimization due to parameter determination of biharmonic function and optimization due to maximixation. In the first case, one needs to solve the critical condition to determine best parameters of biharmonic function,i.e solving R0. Suppose that R can be written in vector form : RyTy with
y
denotesthe coloum vector which its component
model , data
, i
i
i P P
y Therefore the components R are :
j
c R
y y c R c 1 2 1 with
i i
nK
cy e nM nM
i cos sin
1
(4.1)
denotes the i-th component of cy
1
Similarly one has
y y c R c 2 2 2
; 2 ;
3 3 y y c R c y y c R c 4 2 4 (4.2) where
i inK i i
c2y Ke i cosnM sinnM
;
i i nKi
cy e nM nM
i cos sin
3
;
i i
nK i i
c y Ke nM nM
i cos sin
4
. (4.3)
Solving R0 given by Eq.(4.1)-(4.3) , we obtain the
critical solution which some possible answers shown in Table 3. Since results in Table 3 are obtained through lsqnonlin.m, we will analyse the result by substituting these values in Table 3 in Eq.4.1-4.3. The computation shows that the condition 0
R is violated for each data set though the given error less than 20% . We leave this situation for further study.
3.4 Hessian matrix of R
The properties of Hessian matrix of R can also be used as identifiers of optimality. This idea has been applied to select data before presenting further optimization based on the underline theory
(Parhusip,2009). In this research, the components of Hessian matrix of R are as follows.
Since
y y y y
c R c c c c 1 1 1 1 2 2 1 2
Notice that c1
c1y 0 therefore y y c R c c 1 1 2 2 1 2 Similarly
y y y y
y yc c R c c c c c c 1 2 1 2 1 2 2 2 2 1 2
y y y y
y yc c R c c c c c c 1 3 1 3 1 3 2 2 3 1 2
y y y y
y yc c R c c c c c c 1 4 1 4 1 4 2 2 4 1 2
One yields the general form of the component of Hessian of R in the form
y y c R j j c c j 2 2 2 y y c c R j k c c k j 2 ;
2 , i,j=1,...,4
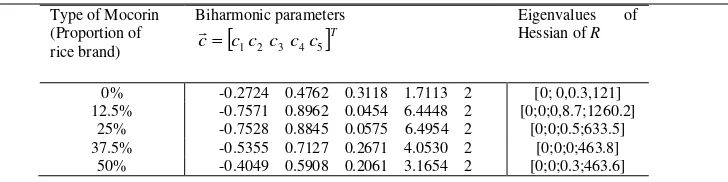
The eigenvalues of Hessian matrix of R have been computed and all eigenvalues have nonnegative values which indicate that R has been minimized for the obtained parameters. Thus, though
0
R
is violatedfor each data set, one still has a sufficient condition for existency of the obtained optimal parameters. The computation result shown in Table 5 (third coloum).
2
International Seminar on Applied Technology, Science, and Art (4th APTECS 2013)Figure. 4 Convexity of biharmonic function from the set of data with proportion of yellow corn and rice brand are 87.5%:12.5% (left) and 50%:50% (right) . The symbols o: denotes the right hand side of Eq.(P.3),*: denotes the left hand side of Eq.(P.3).
Figure. 3 Convexity of biharmonic function from the set of data with proportion of yellow corn and rice brand is 75%:25% (left) and 62.5%:37.5% (right); o: denotes the right hand side of Eq.(P.3),*: denotes the left hand side of Eq.(P.3)
TABLE 3.
PARAMETER VALUES IN BIHARMONIC FUNCTION OF EACH SET OF DATA AND ITS ERROR Type of Mocorin
(Proportion of rice brand)
Biharmonic parameters
Tc c c c c
c 1 2 3 4 5
Error function (%)
0% -0.2724 0.4762 0.3118 1.7113 2 11.8218
12.5% -0.7571 0.8962 0.0454 6.4448 2 4.9585
25% -0.7528 0.8845 0.0575 6.4954 2 5.8468
37.5% -0.5355 0.7127 0.2671 4.0530 2 4.1528
50% -0.4049 0.5908 0.2061 3.1654 2 4.6074
TABLE 4.
OPTIMIZERS (CARBOHYDRATE(K*), AND MASS(M*)) AND THE CORRESPONDING MAXIMAL PROTEIN (P*) Proportion
of rice brand
(K*,M*) Maximal
protein (P*)
Minimal K Minimal M
0% (0.1855; 0.7420) 0.8187 0.1855 0.6882
12.5% (0.5610 , 0.7188) 0.5380
0.5610 0.6822
25% (0.5454 , 0.9714) 0.7702 0.5454 0.6742
37.5% (0.5066 , 1) 0.8215 0.5066 0.6636
Separation variables of f leads to simpler derivation of
f
.According to the given data, we have 5 sets of data and hence we will analyse of each optimal (K*,M*). The obtained (K*,M*) are substituted and we expect2
f
tends to zero. One may observe that only the third type set of data does. Future observation is suggested to improve the algorithm for better achievement of optimality.
IV.CONCLUSION
Biharmonic function has been constructed for the given data of protein, carbohydrate and mass that contain in MOCORIN which observations data were taken in Chemistry Department of SWCU in the year 2012. Each variable is an interpolation of absorbance. There are 5 types of proportion of yellow corn and rice brand. This research determines the best proportion of yellow corn and rice brand, i.e the proportion with maximum protein. One yields that 37.5% of rice brand is the best proportion for maximing the obtained protein.
AKNOWLEDGEMENT
This paper is supported by Research Center of SWCU SK 014/Penel./Rek./5/I/2013
REFERENCES
A.L.Peressini,F.E.Sullivan,J.Uhl,”The Mathematics of Nonlinear Programming”, Springer Verlag, New York, Inc,1988.
D.T.Sandwell,Harmonic Spline Interpolation of Geos-3 and Seasat Altimeter Data, Geophysical Research Letters, Vol.14, No.2, page 139-143, Center for Space Research, University of Texas at Austion,1987. H.A.Parhusip,”Data Selection with Hessian Matrix”, Proceeding of IndoMS International Conference on Mathematics and Its Applications (IICMA), ISBN:978-602-96426-0-5, 0341-0352,2009.
H. A. Parhusip, S.Merryana,”Interpolasi Spline Kubik pada Spektrum Cahaya yang MelaluiCaroten dalam Aceton”, Prosiding Seminar Nasional Efisiensi dan Konservasi Energi FISERGI, UNDIP , hal. B203-B209, ISSN.1907-0063,2005.
H.C. Grunau, E.Robert, Positivity Issues Of Biharmonic Green’s Functions Under Dirichlet Boundary Conditions. Available iń http://www.iecn.unancy.fr/~frobert/GrunauRobert.pdf on 4Sep 2013. H. Ugail,"3D Facial Data Fitting using the Biharmonic Equation",
Visualization, Imaging and Image Processing, J.J. Villanueva (ed.), ACTA Press,2006. ISBN: 0-88986-598-1, pp. 302-307.
W.Y.Yang,W.Cao,T.S.Chung,J.Morris,2005, “Applied Numerical Methods Using Matlab”,John Wiley & Sons, Inc
M.Arad, A. Yakhot, G. Ben-Dor, “A Highly Accurate Numerical Solution of a Biharmonic Equation”, John Wiley & Sons, 1987,
available on
http://www.bgu.ac.il/~yakhot/homepage/publications/nmpde_4_97.pdf 4 September 2013.
. TABLE 5.
PROPERTIES OF HESSIAN MATRIX OF R
Type of Mocorin (Proportion of rice brand)
Biharmonic parameters
Tc c c c c
c 1 2 3 4 5
Eigenvalues Hessian of R of
0% -0.2724 0.4762 0.3118 1.7113 2 [0; 0,0.3,121] 12.5% -0.7571 0.8962 0.0454 6.4448 2 [0;0;0,8.7;1260.2]
25% -0.7528 0.8845 0.0575 6.4954 2 [0;0;0.5;633.5] 37.5% -0.5355 0.7127 0.2671 4.0530 2 [0;0;0;463.8]