THE GROWTH AND COMPETITIVENESS OF INDONESIA’S WOOD FURNITURE
EXPORT
Tulus Tambunan Kadin Indonesia-Jetro
August 2006
I. The Growth of Export and Its Incidental Matters
Per definition, the growth of export value is determined by the combination of price growth and the growth of volume. The growth of price and volume, in turn, is determined by number of different factors. Indonesia as the small country in the global market for almost all export products meaning that Indonesia is the price taker, then as the price taker the growth of price is an important factor to Indonesia. Meanwhile, the volume growth is determined by factors of the domestic supply side. The larger the supply bottleneck in a country then the harder it becomes for that country to increase its production and export. The incidental matters often faced by Indonesia in exporting is supply bottleneck where usually the increase in Indonesia’s export value mainly due by the increase of price in the world market compare to the increase of export volume.
Data of Statistic Central Bureau (BPS) showed that the export value in January 2006 including oil/gas and non-oil/gas totaled each US$ 7.56 billion and US$ 5.73 billion respectively, while import value each totaled US$ 4.39 billion and US$ 3.18 billion. Hence, Indonesia’s Foreign Trade Balance for January 2006 include and exclude oil/gas enjoyed a surplus by US$ 3.17 billion and US$ 2.55 billion. Compared to the value in January 2005, then the export value with and without oil/gas improved by 23.26% and 16.83%. The export improvement mainly came from the increase of export of mining products from US$ 0.44 billion to US$ 0.97 billion.
While export data of May 2006 recently showed that the export value during that month recorded the highest monthly figure in the history, reached US$ 8.34 billion or rose by around 9.79% compare to the value in April 2006. The cumulative export value during January –May 2006 amounting to US$ 38.39 billion or rose by 13.40% from the same period in 2005. From that increased figure, non-oil/gas export value hike by 10.52% and export value of oil/gas rose by 7.22% from April. Based on the BPS statement (Kompas, Tuesday, July 4, 2006, p.17), the increased of export value in May mainly caused by the export increased in mining sectors particularly, grains, crusts and metal dust. The export value of those products improved to US$ 113 million compare to the value in April.
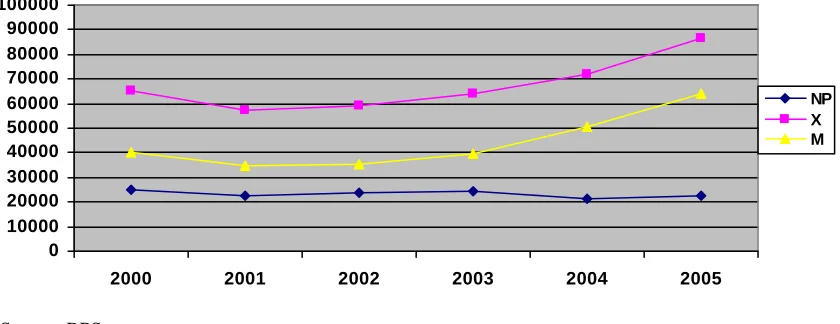
Observing from the year 2000, the total export (oil/gas and non-oil/gas) had once declining from US$ 65.4 million in 2000 to US$ 57.4 million in 2001, and continuously expanding since then. And during the same period, our foreign trade balance declined as well from around US$25 million to US4 22 million (Figure 1). If BPS prediction realized, and the growth of import is stable, then the trade balance surplus of Indonesia may progress at the end of 2006.
Figure 1: Trend of Indonesia’s Foreign Trade Balance (NP), Exports (X) and Imports (M), during 2000-2005 (million US$).
0 10000 20000 30000 40000 50000 60000 70000 80000 90000 100000
2000 2001 2002 2003 2004 2005
NP X M
Source: BPS.
The government has done so many effort to boost the export competitiveness of Indonesia all these times, including recent decision to accelerate the creation of Indonesian Export Import Board, with the embryo of Indonesian Export Bank (BEI). However, the effectiveness of all the steps taken by the government to boost the export performance is heavily dependent on whether those steps were adequate enough to deal with the problems faced by Indonesian exporters in general. Based on the study conducted by World Bank (2004), the slow growth of export was mainly caused by 4 factors. First of all, declining cost competitiveness due to Rupiah’s appreciation and higher inflation rate compare to the inflation in the most important trading partner, such USA and EU.
Further, according to the International Monetary Fund, the labor cost/unit in Indonesia recently is 35% higher than before the crisis in 1997/98. Low cost competitiveness of Indonesia’s manufacture industry was also caused by a large domestic transaction cost in Indonesia. During the period of 2001-2002, general price rate in Indonesia has jumped by 24% due to the increased in electricity tariff (102%), fuel/BBM (52%), diesel oil (159%), water (27%), and transportation (32%) (James, Ray & Minor 2003). Whereas the increased fuel price in the second semester of 2005 has caused sharp increased in inflation rate to around 2 digits (Thee, 2006). All of these resulted in a higher production cost of Indonesia’s export products compared to other countries. Combine with a low productivity rate which did not compensated the rise of production cost, the price competitiveness of Indonesia’s products in global market had relatively dropped against the similar products from other countries.
prominent player in boosting non-oil/gas exports, including industrial products. The absent of foreign investment also means that new investment required to product upgrading is poorly performed. The experience showed that during the new governance era, FDI was crucial to boost the export performance of Indonesia particularly for industrial products which surged significantly during the period of 80s the crisis hit. Outstanding export growth achievement came from China as most of its business activities directed to maintain exports from foreign direct investment.1
Third, fierce international competition. China and Vietnam has been the biggest competitors for Indonesia since they are competing in the exports of product from labor intensive industry similar to those in Indonesia, such as textile, garment and footwear, and rapidly growing compared to Indonesia’s exports. As a result, Indonesia lost its market share in 30 non-oil/gas export, including industrial products to China and Vietnam (Pangestu, 2005). If the poor national industrial condition remain the same with unsolved problems, then it is most likely that Indonesia will loose its global market share for industrial products which was the leading export products from Indonesia such as textile and clothes (TPT)2 as well as wood products.
News in Kompas, Wednesday, June 28 2006 (p.17) pointed out that wood industry and forest products in Indonesia were getting worst. Cited from BPS, in the last 3 years wood and forest products constantly suffered from negative growth. In the year 2004, the industry recorded a negative growth of 2.1%, again a negative growth of 1.3% in 2005 and then steeply failed in the first quarter 2006 to become a negative growth of 5.8%. Based on The Indonesian Plywood Association (Apkindo), the production of Indonesia’s wood panel that was once reached 7 million per meter cubic in 1999-2000 had also dropped to 3.5 million meter cubic in 2005. Whereas Malaysia is estimated to maintain its wood panel production up to 4 million meter cubic (Kompas, Wednesday, June 2006, p. 17). From the total of 120 plywood factories in Indonesia, the factory which is currently running in production and exporting their products are merely 52 factories. However, their average production used is less than 50% of normal capacity (Kompas, Wednesday, June 28, p.17).
1
Textile industry and its products (TPT) as an actual case. According to Aswicahyono and Hill (2004), TPT industry from FDI in Indonesian was discontinued since the last couple of years, and resulted poor export performance of Indonesia’s TPT industry compared to the new era governance. Japanese investment in TPT industry which was dominant during the new governance era had declined as well after the economic crisis. For instance, Japanese TPT industries had invested an average of US$ 119 million into those of Indonesian for around 4 years before the crisis. However, during 2003 and 2004, Japanese investment in this industry was only an average of US$ 7 million per year.
2
In contrast, wood industry and forest products have been grow steeply in competitor countries such as China, Malaysia and Vietnam even without their own wood’s raw materials. Indonesia’s furniture exports recorded at US$1.79 million or improved in an average US$0.088 billion /year in the last 8 years. At the same period, furniture exports from China rose in an average US$1.1billion. China who prohibited wood-cutter in their country did in fact exported furniture amounted to 14 billion US$ in the year of 2005.
However, many believes that Indonesia’s wood industry may survived the competition due to the ability to fit in the market condition by improving quality control, superior design, ability to meet the international environment standard, and enhancing marketing effort in international market (Aswicahyono & Hill, 2004).
Fourth, poor trade facility. Numerous restrictions in harbor and physical facility have been one of the main factors to enlarge the costs of exported products. Although the tariff of using Indonesian harbor/port is relatively low but almost all exports from Indonesia transshipped through Singapore or Malaysia due to lack of efficiency in Indonesia’s harbor/port. According to the analysis related to the efficiency of Indonesia’s harbor, namely Jakarta International Container Terminal, JICT), as the main terminal in Tanjung Priok which is the biggest terminal throughout Indonesia is in fact the most inefficient Terminal in the South East Asia. Judging from the productivity side (as in total container to be loaded in one hour) and the cost/unit side (cost to lift a container measuring 40 foot high in an hour) then JICT in Tanjung Priok is again the most inefficient terminal comparing to other harbor in South East Asian, such as Singapore and Port Klang in Malaysia (Ray, 2003).
II. The Growth of Wood Furniture Export
II.1 World Trading of Furniture
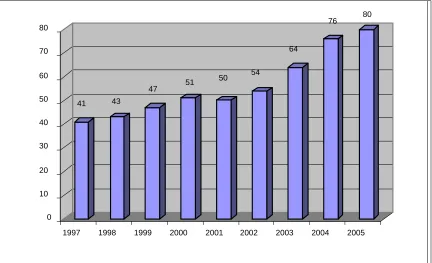
Furniture trading has become the significant component in the world trading for manufacturing products, and the export volume per year has rapidly expanded in line with the growth of total world population and the increase of world’s income per capita. These two factors is the primary contribution to the growth of world demand toward furniture. If the world furniture trading in 1997 recorded at around US$ 41 billion, then in 2005 the value reached US$ 80 billion (Figure 2).
Figure 2: The Value of World’s Furniture Trading (in billion US$)
1997 1998 1999 2000 2001 2002 2003 2004 2005
Figure 3: The Largest Furniture Export Countries in the World in 2004 (%)
Canada,
(5,77%)
Others, 51,55%
China (13,69%)
Italy (14,18%)
Germany (8,43%)
Poland (6,38%)
Source : ASMINDO (data UN, Eurostat and CSIL)
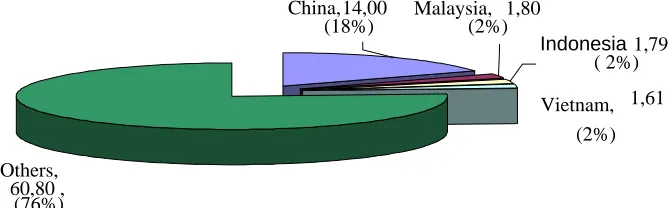
Recent data from WTO showed that in the year of 2005, China has became the largest furniture export country in the world surpassed Italy with an export value of US$ 14 billion or accounted of 18% from total furniture export. While Indonesia’s furniture export value during the same period was recorded at US$ 1.79 billion or covered only 2 % of world furniture market (Figure 4). There is a great possibility that China’s export value of furniture will continue to progress rapidly in the following years, judging from the country’s aggressive effort to boost its export performance both furniture and other products as well. And Indonesia has to be very cautious since the expansion of China’s furniture in the world market may be a great disadvantage for Indonesia’s furniture, even loosing its external market.
Figure 4: The Export Value of Indonesia’s Furniture and Competitor Countries in Asia, 2005 (in billion US$)
Others, 60,80 ,
(76%)
China, 14,00 (18%)
Indonesia1,79 ( 2%)
Vietnam, 1,61 (2%) Malaysia, 1,80
(2%)
Source: ASMINDO (2006) (data UN, Eurostat and CSIL).
II.2 Export of Wood Furniture
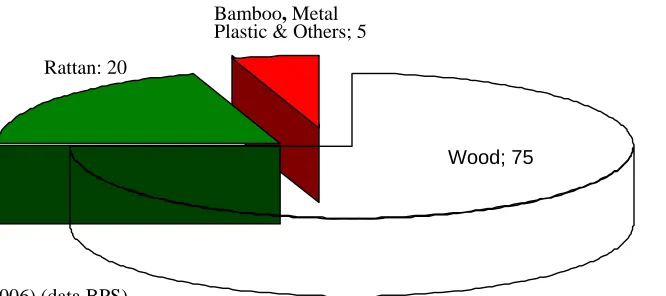
export has been the largest component to reach 75% (Figure 5)3. It is the fact that Indonesian people is known for their wood-carving skills such as in Jepara. Industrial center for wood furniture has rapidly growing particularly in Java Island, that is Semarang, Jepara, Solo and Surabaya for wood furniture, and Cirebon as the largest producer of rattan furniture.
Figure 5: Indonesia’s Furniture Exports based on Raw Materials (%)
Source: ASMINDO (2006) (data BPS)
Particularly in Jepara, furniture has been the most noticeable product to many people as well as foreign researchers due to its advance export performance. For example, studies from Sandee & friends (2000), Berry and Lewis (1994) and Schiller Martin-Schiller (1997) stated that with the support from foreign tourists, furniture producers in Jepara was able to improve their product quality and boosting the growth of export significantly, particularly in the period of 1980’s until the crisis hit in 1997/1998.
Bamboo, Metal Plastic & Others; 5
Rattan: 20
Wood; 75
Furniture industry in Indonesia is dominated by small and middle scale businesses but most of all from micro or home-industry. Many of them created a joint venture with large industry or trading houses. Labor absorbed directly and indirectly reaches 5 million lives meaning that the industry has provided living to around 20 million lives.
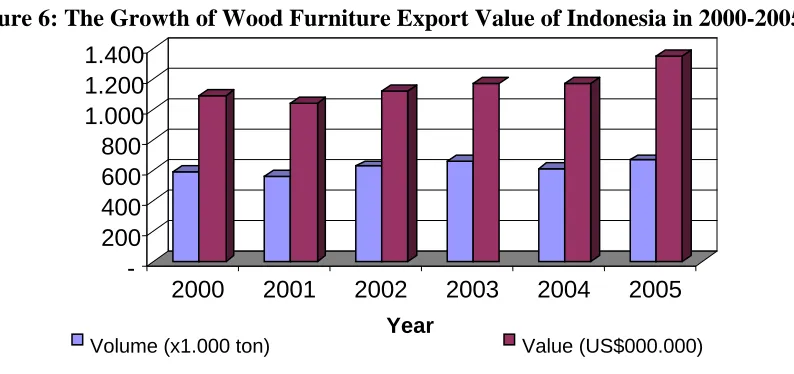
Yet, judging from the export performance, wood furniture has not been the most important component than other wood products such as ply wood, in the export of wood products of Indonesia. As a percentage of the total wood products export, export of plywood remains the highest position. Following the crisis, the proportion of wood furniture export in the total wood export tends to pick up with an average per year of over US$ 1 billion (Table 2).
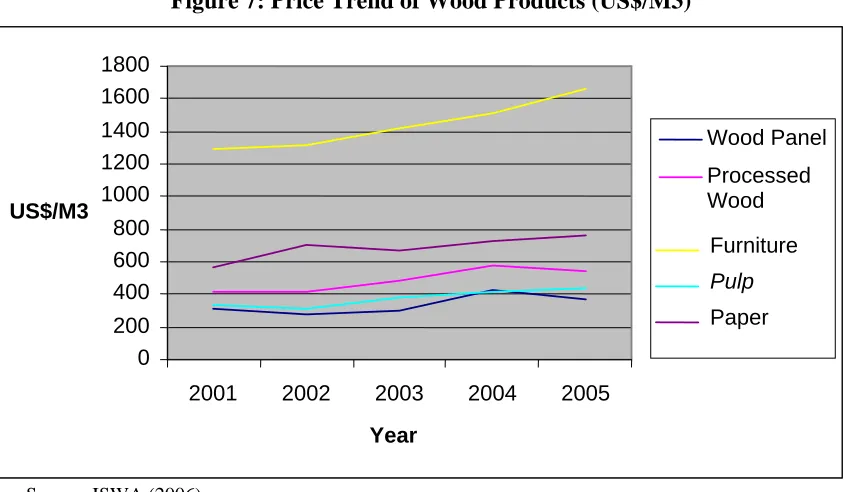
However, that growth was more attributable to value increased rather than increasing export volume. On the contrary, export volume of Indonesia’s wood furniture in average/year tends to be lower than 600 tonnages per year (Figure 6). Available data revealed that international price of wood furniture is higher than other wood
3
products and recorded higher growth rate/year compared to prices from other wood products (Figure 7). These could be attributable among other things to the rapid growth of world demand compare to the growth of world furniture production, and obviously the development of US$ exchange rate.
Table 2: Contribution of Forestry Sector toward Indonesia’s Foreign Exchange Income in 1995-2004 (In million US$)
Export Value of Processed Wood Year
Plywood Processed
Wood Pulp & Paper
Wood Furniture
Rattan
Furniture Sawdust Total
% to Total Foreign Exchange
1995 3.886,9 1.086,5 1.258,0 458,6 368,2 1,3 7.059,5 15,86%
1996 4.029,5 1.067,1 1.309,8 545,6 337,1 0,2 7.289,3 14,64%
1997 3.887,9 1.002,1 1.427,8 527,2 194,9 0,4 7.040,3 13,19%
1998 2.486,2 696,8 2.115,4 252,1 64,4 62,2 5.677,0 11,62%
1999 2.704,7 719,8 2.440,6 854,0 294,0 78,7 7.091,8 14,58%
2000 2.419,1 597,9 3.001,9 1.091,1 313,5 97,2 7.520,8 12,13%
2001 2.004,2 478,8 2.598,4 1.036,8 290,3 162,7 6.571,3 11,67%
2002 2.145,0 897,3 2.848,0 1.116,5 302,1 …* 7.308,9 12,79%
2003 1.985,9 1.280,0 3.164,0 1.167,7 313,5 … 7.911,0 12,96%
2004 1.852,8 1.436,5 2.817,6 1.172,2 336,9 … 7.616,1 10,64% Note: No data available
Source: Ministry of Trade, Ministry of Industry
Figure 6: The Growth of Wood Furniture Export Value of Indonesia in 2000-2005
-200 400 600 800 1.000 1.200 1.400
2000 2001 2002 2003 2004 2005
Year
Volume (x1.000 ton) Value (US$000.000)
Source: ASMINDO (2006) (data BPS)
above the income in 20 years ago, the demand over furniture is not solely determined by prices but also other factors such as prestige, style and social status of the buyer. Meaning that design, color, or performance of the furniture would be the significant factors in making buying decision.
Figure 7: Price Trend of Wood Products (US$/M3)
0 200 400 600 800 1000 1200 1400 1600 1800
2001 2002 2003 2004 2005
Year US$/M3
Wood Panel
Processed Wood
Furniture
Pulp
Paper
Source: ISWA (2006).
Table 3: Investment Value in Forestry Sector based of Wood Industry in Indonesia in 2000 (billion US$)
Industry Investment Value %
HPH 3,28 12
HTI 3,00 11
Plywood 3,30 12
Glue 0,19 1
Sawdust & Processed Wood 1,03 4
Pulp & Paper 16,00 58
Furniture 0,80 3
Carpentry/Craftsman 0,17 1
Total 27,77 100
Source: Ministry of Industry, Ministry of Forestry, 2000.
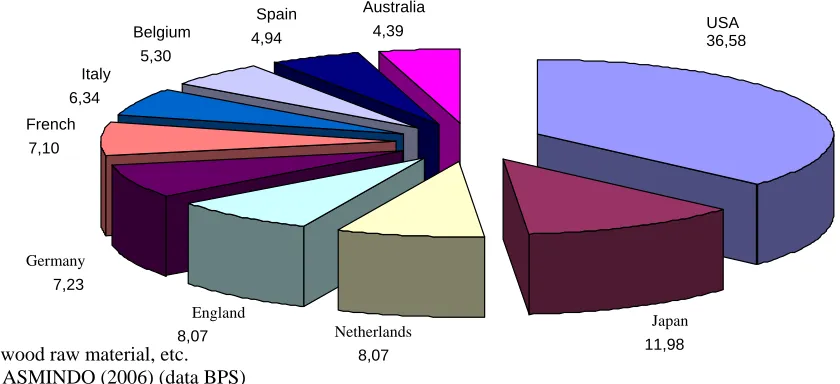
BPS data in 2005, further compiled by ASMINDO, stated that USA and EU are the primary market for wood furniture export from Indonesia with wood and rattan made materials. During that year, US market covered around 36.6% from the total export of Indonesia’s furniture, while largest export destination countries in EU market include Dutch, England, Germany, France and Italy. In Asia, Japan is most important market which covered 12% shares from total export of Indonesia’s wood furniture (Figure 8)
there are no culture or taste barriers toward Indonesia’s products, except probably technical restriction for certain products such as non-tariff barriers or NTB.
Figure 8: Ten (10) Primary Export Destination Countries of Indonesia’s Wood Furniture* in 2005 (%)
Note: * wood raw material, etc.
USA 36,58
Japan 11,98 Netherlands
8,07 England
8,07 Germany
7,23 French
7,10 Italy 6,34
Belgium 5,30
Spain 4,94
Australia 4,39
Source: ASMINDO (2006) (data BPS)
Table 4: World’s Largest Furniture Importer Countries during the period of 1996 – 2004 (million US$)
Period
Country 1996 1997 1998 1999 2000 2001 2002 2003 2004 USA 7.309 8.551 10.275 12.604 14.970 14.624 16.781 18.718 21.404 Germany 6.134 5.679 6.198 6.080 5.862 5.813 6.048 7.569 8.161 England 1.891 2.117 2.571 2.865 3.140 3.377 4.225 5.278 6.633 French 2.751 2.696 3.018 3.196 3.254 3.297 3.566 4.369 5.415 Japan 2.592 2.529 2.021 2.252 2.801 2.817 2.760 3.145 3.773 Canada 1.191 1.439 1.603 1.739 2.061 2.068 2.258 2.549 3.043 Belgium 1.679 1.692 1.931 1.903 1.868 1.791 1.851 2.233 2.591 Austria 1.279 1.245 1.262 1.341 1.376 1.466 1.389 1.770 1.984 Netherlands 1.571 1.389 1.369 1.743 1.604 1.471 1.460 1.813 1.971 Swiss 1.619 1.393 1.523 1.585 1.490 1.431 1.502 1.749 1.970 Spain 455 501 558 685 747 767 825 1.385 1.861 Italy 543 585 680 801 842 840 898 1.131 1.474
Note: * wood raw material, etc.
Source: ASMINDO (2006) (data UN, Eurostat and CSIL)
Figure 9: World’s Largest Furniture* Importer in 2004 (%)
England (8.57%),
French,
(7.00%) Japan,
(4.88%)
Germany (10.55%) USA, 27.67%
Others, 41.33%
Note: * wood raw material, etc.
Source: Data UN, Eurostat and CSIL, tabulated by ASMINDO
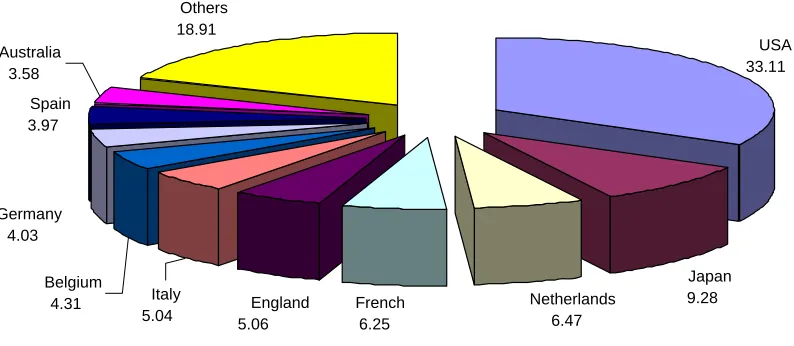
Figure 10 pointed out that, particularly wood furniture’s, USA is the largest buyer with 33% shares followed by several countries in EU. This confirmed the correlation between population and income per capita level (or its growth) and large demand of furniture (applied to import as well).
Figure 10: Primary Destination Countries of Indonesia’s Wood Furniture Exports in 2005 (%)
USA 33.11
Japan 9.28 Netherlands
6.47 French
6.25 Spain
3.97
Others 18.91 Australia
3.58
Belgium 4.31 Germany
4.03
Italy
5.04 5.06England
Source: ASMINDO (data BPS)
Figure 11: Wood Furniture Imports (HS 9403) USA in 2001-2005 (CIF million dollar)
10.978
12.739
14.344
16.288 18.197
0 1000 2000 3000 4000 5000 6000 7000 8000 9000 10000 11000 12000 13000 14000 15000
2001 2002 2003 2004 2005
Source: IFC PENSA
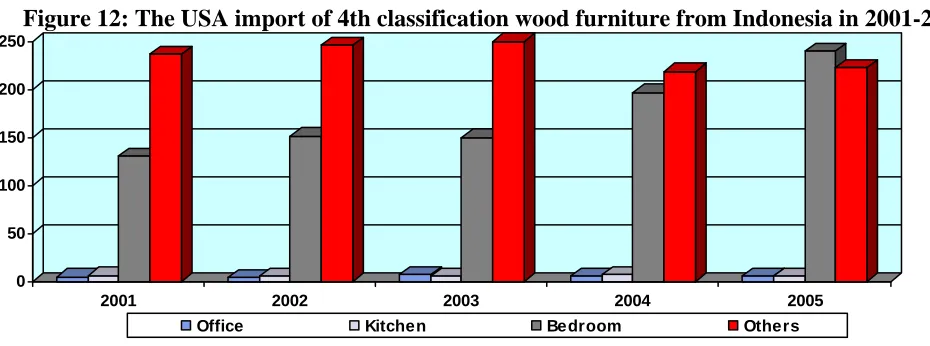
Figure 12: The USA import of 4th classification wood furniture from Indonesia in 2001-2005 (CIF million dollar)
0 50 100 150 200 250
2001 2002 2003 2004 2005
Office Kitchen Bedroom Others
Source: see Figure 11
Figure 13: The USA import of 4th classification wood furniture from Vietnam in 2001-2005 (CIF million dollar)
0 50 100 150 200 250 300 350 400 450 500
2001 2002 2003 2004 2005
Office Kitchen Bedroom Others
Figure 14: The USA import of 4thth classification wood furniture from China in 2001-2005 (CIF million dollar)
(CIF million dollar)
classification wood furniture from China in 2001-2005
0
2001 2002 2003 2004 2005
Office Kitchen Bedroom Others
Source: see Figure 11 Source: see Figure 11
Figure 15: The EU (25) import of 4th classification wood furniture from Indonesia in 2001-2005 Figure 15: The EU (25) import of 4
(Million Euro) (Million Euro)
th
classification wood furniture from Indonesia in 2001-2005
Source: see Figure 11 Source: see Figure 11
Office Kitchen Bedroom Others
Figure 16: The EU (25) import of 4th classification wood furniture from Vietnam in 2001-2005 Figure 16: The EU (25) import of 4
(Million Euro) (Million Euro)
th
classification wood furniture from Vietnam in 2001-2005
0
2001 2002 2003 2004 2005
Office Kitchen Bedroom Others
Figure 17: The EU (25) import of 4th classification of wood furniture from China in 2001-2005 (Million Euro)
0 50 100 150 200 250 300 350 400 450 500 550 600 650 700 750
2001 2002 2003 2004 2005
Office Kitchen Bedroom Others
Source: see Figure 11
III Global Competitiveness of Wood Furniture
There are numbers of indicators to be applied in analyze the relative competitiveness of Indonesia compare to other countries over one product. The commonly used parameter in the literature is called Revealed Comparative Advantage (RCA). Yet, the one simple way to observe the competitiveness of Indonesia’s wood furniture export value in the global market is to analyze the long term changes of the export value of Indonesia’s wood furniture compared to other competitor countries. As illustrated in Figure 18, it is clear that Indonesia’s position is gradually shifted by China, and it simply showed deteriorated competitiveness of Indonesia’s wood furniture products compare to China.
Figure 18: The Position of Furniture Export from Indonesia toward Competitor Countries in Asia in 2000–2004(million US$)
0 2000 4000 6000 8000 10000 12000
'00 '01 '02 '03 '04
China Malaysia Indonesia Vietnam
Source: ASMINDO (2006) (data UN, Eurostat and CSIL).
reached by Indonesia was over US$ 1.4 billion, while Malaysia was lower than that number. The next year, though, Malaysia succeeding equalizes position of Indonesia reaching over US$ 1.5 billion, and in 2004, Malaysia exceeded Indonesia and reached US$ 1.7 billion. This clearly portrayed that the export growth of Malaysian furniture during that period was rapidly increased than Indonesia and proved that Malaysian furniture industry is not suffering from supply bottleneck such as in Indonesia. This became serious threat to the future prospect of furniture export from Indonesia, particularly for US market. If the differences in performance widened or more favorable to Malaysia, then Malaysian furniture could substitute China’s position in US and EU market.
Figure 19: The Position of Furniture Export from Indonesia Compare to Other ASEAN Countries in 2002-2004 (million US$)
0 200 400 600 800 1000 1200 1400 1600 1800
Indonesia Malaysia Thailand Singapore Philippines
2002 2003 2004
Note: For Thailand and Malaysia, more than 70% is furniture with rubber wood raw material EXPORT VALUE Source: Asean Furniture Industries Council (AFIC)
Competitiveness may come in different forms such as quality, design, price, marketing, or after sale service which all of them contribute to the whole competitiveness of a product. For example, if price competitiveness of a product is low (made from country A), meaning that the price is relatively higher than similar product made from country B, but supported with higher quality that contribute to over 100% compensation against its low price competitiveness, then in the end A product is more salable than B product in the world market.
Table 5: Main Costs of Furniture Industry in ASEAN Countries (US$)
NO Factors Indonesia Malaysia Philippines Singapore Thailand Myanmar
1 THC (Terminal
3 Electricity tariff per
Kwh/Kva 0,08 0,03 – 0,07
0,20/Kwh/per
month 0,08 – 0,1 0,08 0,8/unit
4
Bank Interest Rates
(%) 16 7,25 15,5-16,5/annualy
Different for
each bank 5,75%/annualy(MLR) 17% /annually
5 Fuel/liter 0,20 0,41 – 0,42 0,5 0,40 – 0,56 0,49 0,50
6 Transportation to
the Port 160 Source: Asean Furniture Industries Council (AFIC)
According to Gunawan (2006), the strong point of China’s furniture industry versus Indonesia is mainly due to several aspects as follows;
1. Cheaper wood (probably related with illegal logging from Indonesia) 2. More productive labor
3. Cheaper bank interest rate 4. Lower taxation
5. Lower overhead costs (small/simple organization) 6. Ease on permit process
7. Less illegal collection than Indonesia 8. Dumping policy
Price competitiveness is also determined by productivity level. Basic theory is that the higher the productivity then the lower costs to be spent and means lower price per output as well. As previously explained, most of the wood furniture industry in Indonesia considered as micro or home-industry. Data from Ministry of Industry (Table 6) as well as BPS (Table 7) showed that the ratio of value added –labor (as an indicator of labor productivity) in manufacturing industry said that the smaller the business scale then the lower of labor productivity level. In addition, labor productivity in home-industry is considered to be the lowest of all.
Table 6: The Difference of Labor Productivity in Manufacture based on Business Scale and Industry Category in Indonesia in 2000 (average value added per labor; Rp. 000).
ISIC IRT IK IM IB
Food, Beverages & Tobacco
Textile and its products (TPT), Leather & Foot Wear Wood and wood products
Paper, printing & publication
Chemical products (including fertilizer) & rubber products Cement and mineral non metal products
Iron and Steel products
Transportation equipments, machines and tools
39 Others 4.973 6.097 12.701 22.946 Description: IRT=House hold industry with 1-4 workers; IK=small industry with 5-19workers; IM = medium scale industry with 20-50 workers; IB = large scale industry with more than 50 workers
Source: Ministry of Industry (database).
Table 7: Ratio of value added – labor (Q1; Rp 000) and total output contribution of manufacture (Q2; %) based on business scale in 1999-2003
1999 2000 2001 2002 2003
Business Scale
Q1 Q2 Q1 Q2 Q1 Q2 Q1 Q2 Q1 Q2
IM & IB IRT & IK
115,28 8,35
90,52 9,48
143,99 9,11
91,65 8,35
167,70 10,98
91,50 8,50
166,31 12,36
89,94 10,06
196,26 13,55
90,68 9,32
REFERENCES
ASMINDO (2006), ”Tinjauan tentang Industri Permebelan dan Kerajinan Indonesia”, Kadin Roadmap Industri, 27 Juni, Kadin Indonesia.
Aswicahyono, Haryo & Hal Hill (2004), “Survey of Recent Developments”, Bulletin of Indonesian Economic Studies, 40(3),
Berry, Albert dan Brian Levy (1994), “Indonesia’s Small and Medium-Size Exporters and Their Support Systems”, Policy Research Working Paper 1402, December, Policy Research Department, Finance and Private Sector Development Division, World Bank, Washington, D.C.
Eddy Gunawan, Eddy (2006), “Industri Furniture Knock Down”, Kadin Roadmap Industri, 27 Juni, Kadin Indonesia.. ISWA (2006), ”Revitalisasi Industri Kayu Olahan Menuju Industri Yang Kompetitif”, Kadin Roadmap Industri, 27 Juni, Kadin Indonesia.
James, William E; David J. Ray & Peter J. Minor (2003), “Indonesia’s Textiles and Apparel: The Challenges Ahead,
Bulletin of Indonesian Economic Studies,39(3).
Liu, Raymond (2006), “Outlook for Pulp & Paper Market”, Kadin Roadmap Industri, 27 Juni, Kadin Indonesia.
Pangestu, Mari, 2005, “Developing the Trade Sector: Challenges and Strategy Towards Strengthening Industreial Competitiveness”, Ceramah di Symposium “Reinventing Indonesia’s Industrial Competitiveness”, Jakarta, 1 Maret.
Ray, David J. (2003), “Survey of Recent Developments”, Bulletin of Indonesian Economic Studres, 39(3).
Sandee, Henry, Roos Kities Andadari dan Sri Sulandjari (2000), “Small Firm Development during Good Times and Bad: The Jepara Furniture Industry”, dalam C. Manning dan P. van Dierman (eds.), Indonesia in Transition: Social Aspects of Reformasi
and Crisis, Indonesia Assessment Series, Research School of Pacific and Asian Studies, Australian National University,
Canberra, and Institute of Southeast Asian Studies, Singapore: 184-98.
Schiller, J. dan B. Martin-Schiller (1997), “Market, Culture and State in the Emergence of an Indonesian Export Furniture Industry”, Journal of Asian Business, 13(1): 1-23.