INTERNATIONAL ECONOMY
Asia remain to be the center of the world economic growth, particularly Southeast Asia
and East Asia, which held 7.5% growth in 2005, compared to the economic growth in
developed countries such as USA, Japan and European which merely reached 2.5% (Table
3). It is estimated that the Asian economy will expand by 7.4% with China as its main
driver (9.3%), while the growth in the developed countries will increase by 2.9% with US
to be its main contributor (3.6%).
Table 3: The Growth of Macro Economy in Asian Countries in 2005 and the
estimation of 2006
GDP Growth Inflation Trade Balance (% of GDP)
Fiscal Balance (% of GDP)
2005 2006 2005 2006 2005 2006 2005 2006
Asia
China Hong Kong India Korea Malaysia Philippines Singapore Taiwan Thailand Vietnam
Industrial
Countries
USA Japan Euro area
World
7.5 9.9 7.3 8.1 4.0 5.3 5.1 6.4 4.1 4.5 8.4
2.5
3.5 2.6 1.4
3.4
7.4 9.3 5.7 7.6 5.5 5.5 5.1 6.5 4.0 4.7 8.0
2.9
3.6 2.7 2.1
3.7
3.1 1.8 1.1 4.5 2.7 3.1 7.6 0.5 2.3 4.5 8.3
2.3
3.4 -0.1 2.2
2.9
4.2 3.5 2.6 5.0 2.6 4.1 7.0 2.0 2.0 5.2 7.5
2.4
3.4 0.5 2.1
3.1
4.1 5.5 11.1 -2.1 2.1 15.2 2.4 28.4 4.7 -2.1 -2.6
-2.0
-6.4 3.6 -0.4
-0.8
3.8 6.0 9.7 -2.5 0.7 12.6 2.0 24.4 5.0 -1.6 -2.9
-2.5
-7.3 3.7 -0.5
-1.2
-1.1 -0.9 1.0 -4.1 0.6 -2.8 -2.7 6.0 -2.4 -0.3 -2.0
-2.4
-2.6 -5.3 -2.4
-1.9
-1.2 -1.0 0.6 -3.8 0.5 -3.6 -2.0 6.0 -3.0 -1.4 -2.5
-2.3
-2.5 -4.4 -2.7
-1.9 Source: ADB and Citigroup (estimation of 2006)
though the latter is strongly dependent on the growth of domestic economic activities.
Further, export growth is also dependent on the economic growth of destination markets as
well as the production capacity in the country. In other words, the rapid growth of global
economy, particularly in Asia, is not often followed by a sharp export growth of Indonesia.
Latest data from BPS indicated that the export value in January 2006, including oil/gas
and non-oil/gas each totaled US$ 7.56 billion and US$ 5.73 billion respectively, whereas
import value each totaled US$4.39 billion and US$3.18 billion respectively. Thus, the
foreign trade balance of Indonesia for the month of January 2006, with and without oil/gas
enjoyed a surplus of each US$ 3.17 billion and US$ 2.55 billion respectively. Meaning
that, the export, with and without oil/gas each increased by 23.26% and 16.83% compared
to those in January 2005. The hike in export value mainly attributable to the increased in
the export value of mining sector from US$ 0.44 billion to US$ 0.97 billion. Meanwhile,
the import value in January 2006, with and without oil/gas, improved by 6.49% and 3.89%
respectively, compared to the same period in the previous year. During the month of
January 2006, the growth of import was mainly dominated by the import of raw materials
amounting to US$3.23 billion or improved by 1.41% compare to the same period in 2005
totaled US$ 3.18 billion.
Yet, judging from the performance back in the year of 2000, the total export value
(oil/gas and non-oil/gas) had once trimmed from around US$65.4 billion in 2000 to US$
57.4 billion in 2001, but kept growing ever since that period. During the same period,
foreign trade balance had also dropped from US$ 25 million to US$ 22.7 million (Figure
2).
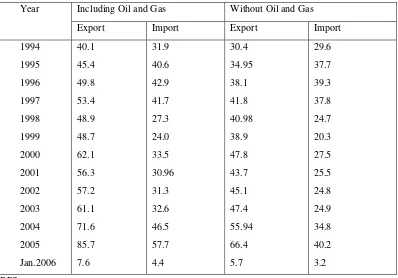
The growth of Indonesia’s foreign trade balance based on oil/gas and non-oil/gas
sectors during the last one decade may be seen in Table 4. Oil/gas sector maintain to be the
prominent factor as the source of surplus to foreign trade balance of Indonesia. Without the
role oil/gas sector, the average surplus of foreign trade balance per year was lower
compared to the surplus with oil/gas, even suffered a deficit in certain years.
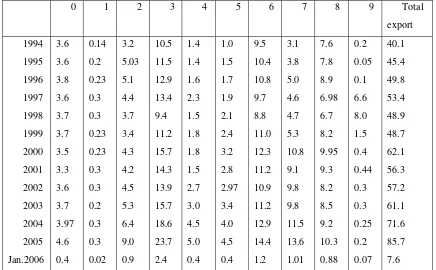
from around US$ 3.1 billion in 1994 to an almost US$ 14 billion in 2005. Export value of
industrial products based on its materials has also improved, though in a relatively
insignificant growth from US$9.5 billion to US$ 14.4 billion (Table 5).
Figure 2: The Trend of Growth of Foreign Trade Balance (NP), Export (X) and
Import (M), Indonesia, 2000-2005 (million US$).
0 10000 20000 30000 40000 50000 60000 70000 80000 90000 100000
2000 2001 2002 2003 2004 2005
NP X M
Source: BPS.
Table 4. Trade Balance of Oil and Gas and Non-Oil and Gas, Indonesia,
1994-January 2006 (billion US$)
Including Oil and Gas Without Oil and Gas Year
Export Import Export Import 1994
1995 1996 1997 1998 1999 2000 2001 2002 2003 2004 2005 Jan.2006
40.1 45.4 49.8 53.4 48.9 48.7 62.1 56.3 57.2 61.1 71.6 85.7 7.6
31.9 40.6 42.9 41.7 27.3 24.0 33.5 30.96 31.3 32.6 46.5 57.7 4.4
30.4 34.95 38.1 41.8 40.98 38.9 47.8 43.7 45.1 47.4 55.94 66.4 5.7
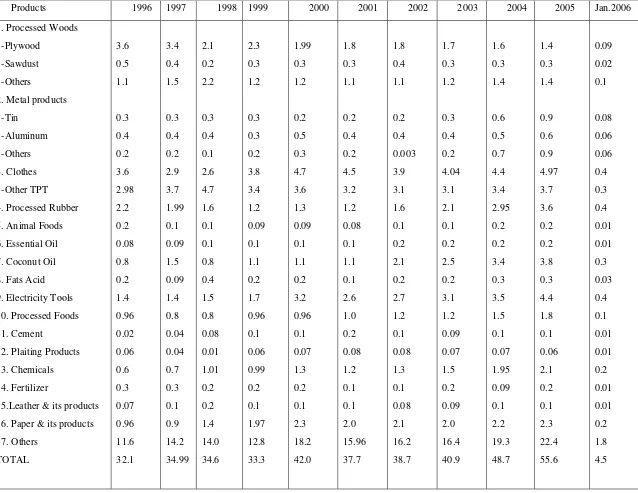
[image:3.595.133.531.441.719.2]Further, Table 6 showed that plywood, ready to wear clothes, and other textile products
(TPT) are among the industrial products of Indonesia, to be the leading export products
from the manufacturing sector. Electricity utilities have the potential to be the leading
export product from Indonesia though the average export value per year is relatively small.
Table 5. The Growth of Export Value based on Commodities Classification (SITC),
Indonesia, 1994-Jan.2006 (billion US$)
0 1 2 3 4 5 6 7 8 9 Total export
1994 1995 1996 1997 1998 1999 2000 2001 2002 2003 2004 2005 Jan.2006
3.6 3.6 3.8 3.6 3.7 3.7 3.5 3.3 3.6 3.7 3.97 4.6 0.4
0.14 0.2 0.23 0.3 0.3 0.23 0.23 0.3 0.3 0.2 0.3 0.3 0.02
3.2 5.03 5.1 4.4 3.7 3.4 4.3 4.2 4.5 5.3 6.4 9.0 0.9
10.5 11.5 12.9 13.4 9.4 11.2 15.7 14.3 13.9 15.7 18.6 23.7 2.4
1.4 1.4 1.6 2.3 1.5 1.8 1.8 1.5 2.7 3.0 4.5 5.0 0.4
1.0 1.5 1.7 1.9 2.1 2.4 3.2 2.8 2.97 3.4 4.0 4.5 0.4
9.5 10.4 10.8 9.7 8.8 11.0 12.3 11.2 10.9 11.2 12.9 14.4 1.2
3.1 3.8 5.0 4.6 4.7 5.3 10.8 9.1 9.8 9.8 11.5 13.6 1.01
7.6 7.8 8.9 6.98 6.7 8.2 9.95 9.3 8.2 8.5 9.2 10.3 0.88
0.2 0.05 0.1 6.6 8.0 1.5 0.4 0.44 0.3 0.3 0.25 0.2 0.07
40.1 45.4 49.8 53.4 48.9 48.7 62.1 56.3 57.2 61.1 71.6 85.7 7.6 Note: 0= Food Material & Live Animals; 1= Beverages & Tobacco; 2=Raw Material; 3=Fuel, Polish Material & etc; 4=Vegetable and Animal Oil/Fats; 5=Chemicals; 6=Industrial Products based on material; 7=Machineries & Transportation; 8= Other Industrial Products; 9=Others special commodities & transaction.
Table 6. The Growth of Industrial Products Export Value, 1996-Jan.2006 (billion US$)
Products 1996 1997 1998 1999 2000 2001 2002 2003 2004 2005 Jan.2006
1. Processed Woods -Plywood
-Sawdust -Others
2. Metal products -Tin
-Aluminum -Others 3. Clothes
-Other TPT 4. Processed Rubber 5. Animal Foods 6. Essential Oil 7. Coconut Oil 8. Fats Acid 9. Electricity Tools 10. Processed Foods 11. Cement
12. Plaiting Products 13. Chemicals 14. Fertilizer