Full Terms & Conditions of access and use can be found at
http://www.tandfonline.com/action/journalInformation?journalCode=cbie20
Download by: [Universitas Maritim Raja Ali Haji] Date: 19 January 2016, At: 20:08
ISSN: 0007-4918 (Print) 1472-7234 (Online) Journal homepage: http://www.tandfonline.com/loi/cbie20
Survey of recent developments
Haryo Aswicahyono & Hal Hill
To cite this article: Haryo Aswicahyono & Hal Hill (2004) Survey of recent developments, Bulletin of Indonesian Economic Studies, 40:3, 277-305, DOI: 10.1080/0007491042000231494 To link to this article: http://dx.doi.org/10.1080/0007491042000231494
Published online: 19 Oct 2010.
Submit your article to this journal
Article views: 142
View related articles
ISSN 0007-4918 print/ISSN 1472-7234 online/04/030277-29 © 2004 Indonesia Project ANU DOI: 10.1080/0007491042000231494
SURVEY OF RECENT DEVELOPMENTS
Haryo Aswicahyono
Centre for Strategic and International Studies, Jakarta Hal Hill
Australian National University SUMMARY
The survey period was dominated by the presidential election and its immediate aftermath. After receiving a clear mandate from the 20 September second-round election, on 20 October Susilo Bambang Yudhoyono (hereafter referred to as SBY) was installed as Indonesia’s sixth president, and the first to be elected directly. He announced his cabinet that evening.
The president inherits an economy which, in terms of per capita income, has recovered to pre-crisis levels, and is growing at about 4.3% per annum. Develop-ments during the survey period continued to confirm the assessDevelop-ments of previous surveys that macroeconomic stability has been restored, albeit precariously. Infla-tion is under control, though it is stubbornly above that of Indonesia’s major trad-ing partners. Interest rates have bottomed out and will probably start to rise, reflecting both international trends and the current very low real domestic rates.
A major achievement of the Megawati administration was its prudent fiscal pol-icy. The fiscal deficit has fallen to below 2% of GDP, and would be less than 1% under the proposed 2005 budget. However, the fuel subsidy has risen alarmingly, from a budgeted Rp 14.5 trillion to an officially estimated Rp 63 trillion in 2004 (and probably higher still), approximately equivalent to the central government’s entire development budget. The subsidy is of such a magnitude as to imperil the incoming administration’s development-oriented expenditure program.
The economy weathered the third major terrorist attack in two years, on 9 Sep-tember in front of the Australian embassy, with surprising ease. The longer-term ramifications may be more serious, however, especially if there are repeat attacks. With its strong mandate and the macro-economy stabilised, the SBY team has an historic opportunity to return Indonesia to strong economic growth. To do so will require the restoration of business confidence and the pursuit of a predictable, growth-oriented commercial climate. Investment, both foreign and domestic, is anaemic. Labour-intensive manufactured exports and the mining industry, to name just two problem areas, continue to languish. Serious infrastructure bottle-necks are beginning to emerge. Labour regulations constitute a major disincentive to employ workers in the modern sector. Export–import procedures are cumber-some and costly, and lag well behind regional best practice. Property rights are insecure. Corruption is just as widespread as in the Soeharto era, but much more unpredictable. Coordination between different tiers of government is weak. The reform agenda is well known and clearly articulated; the nation now waits for the new administration to make serious progress on many fronts.
INTRODUCTION
It was the best of times and the worst of times. ‘Indonesia’s shining example’, proclaimed the front cover of the London Economist magazine of 10–16 July. It might have been regarded as a wildly optimistic scenario a year ago: Indonesia has elected a domestically popular and internationally respected president, a late-running outsider who possessed only a fledgling party machine at the beginning of 2004. He has been granted a strong democratic mandate through a fair and transparent electoral process. The world’s third most populous democ-racy has conducted three nationwide elections in 2004, on 5 April (for the national and regional parliaments and the new Regional Representative Coun-cil), 5 July (the first-round presidential election) and 20 September (the final presidential run-off). Despite the country’s very limited history of open and competitive elections, all were peaceful, orderly and, for the most part, well run. Voting was not compulsory, but the participation rate was over 78%. In a world where electoral malpractice and violence remain widespread even in well-established democracies, Indonesians rightly view their 2004 electoral achieve-ments with great pride.
Susilo Bambang Yudhoyono was installed as the nation’s sixth president on 20 October. Although his party has a very small direct representation in the parlia-ment (DPR), the new president has a clear mandate, a reasonable expectation of an uninterrupted five-year rule, and an unparalleled opportunity to return the country to high growth. Moreover, he assumes power against the backdrop of an exceptionally favourable international economic environment—at least in the short term. Global economic growth in 2004 is predicted to be the highest in 30 years (5% according to the latest IMF World Economic Outlook). International energy prices are at record levels, while interest rates remain historically low.
Yet, overshadowing this success and opportunity are daunting challenges. The Megawati administration has restored macroeconomic stability. The micro, busi-ness environment is less reassuring, however. Recorded foreign direct investment (FDI) continued to be negative in the first half of 2004, with Indonesia the only crisis-affected economy in Asia for which this was the case. Investors—foreign and, more importantly, local—are still essentially holding back, waiting for clear signals that this is a government with the determination and capacity to deliver a predictable, growth-oriented policy environment. Moreover, terrorism remains an ever-present threat. On 9 September a bomb exploded outside the Australian embassy, the third major incident of this kind since 2002. Although the number of fatalities (nine, with approximately 180 injured) was fewer than in the two previ-ous cases, the bomb itself was thought to be more powerful, suggesting that ter-rorist capacity is still high.
In the realm of economic policy, the performance of the new administration will be judged according to three key economic policy milestones. The first is the composition of the new cabinet, especially the finance, coordinating economics, trade, industry, state enterprises, attorney general and labour portfolios. The next will be something resembling a ‘100-day program’, including major statements on broad development objectives, supplemented by quick-acting reforms to demonstrate to the business community the government’s serious intent. Third will be the development of a coherent medium-term development plan, address-ing issues as diverse as the deteriorataddress-ing quality of physical infrastructure,
tial labour market deregulation, targeted social programs, sweeping administra-tive simplification, and clarity in centre–region relations.
RECENT DEVELOPMENTS Politics in Command
The period under review was dominated by political developments, principally the two rounds of presidential elections and their aftermath. In the first round, no team secured the required majority of votes (table 1), necessitating a second-round run-off between the two most popular candidates. The SBY–Jusuf Kalla team won this convincingly, by 61% to 39%. It also won in all regions except for three small provinces (all with majority or significant non-Muslim communities): Bali, Maluku and East Nusa Tenggara.
As is common in modern politics, Indonesia’s presidential campaign concen-trated heavily on personalities, symbols and slick promotion. In their campaigns, there was little formally to distinguish the two rivals on economic policy. SBY–Kalla appeared more willing to commit to specific targets, though the prac-tical connections between means and ends were not enunciated. These targets included, by the end of their five-year term, an investment share in GDP of 30% (as compared to the current figure of 18%), an average growth rate of 6.7% (cur-rently 4.3%), and cutting poverty incidence to 8.2% (from 17.4%) and unemploy-ment from 9.5% to 5.1%. The candidates’ public stateunemploy-ments seemed to give credence to a popular view in Jakarta that a combination of regulatory reform, closer relations with international donors and a modest fiscal stimulus will be the keys to faster growth.
As means to achieving these objectives, the SBY–Kalla campaign also empha-sised macroeconomic stability, improved tax administration and collection, legal and customs reform, administrative simplification and, of course, an assault on corruption. Small and medium enterprises (SMEs) and agriculture are to receive priority, no doubt in part reflecting SBY’s Bogor Agricultural Institute roots.1
Infrastructure investment is to be targeted, possibly as part of external debt negotiations. In addition to his apparent willingness to consider a somewhat higher fiscal deficit, SBY also emphasised better-targeted subsidies, including
TABLE 1 Presidential and Vice-Presidential Election Results (% of votes cast)
Candidates 1st Round 2nd Round
Susilo Bambang Yudhoyono – M. Jusuf Kalla 33.6 60.6 Megawati Soekarnoputri – Hasyim Muzadi 26.6 39.4 Wiranto – Salahuddin Wahid 22.2
Amien Rais – Siswono Yudo Husodo 14.7
Hamzah Haz – Agum Gumelar 3.0
Source: Komisi Pemilihan Umum (General Election Commission), <www.kpu.go.id>.
(after the forthcoming Lebaran holiday following the fasting month) a likely increase in fuel prices. On the state-owned enterprise (SOE) sector, the emphasis appeared to be on increased professionalism and ‘de-bureaucratisation’, rather than privatisation.
However, the SBY–Kalla team did not emerge as a clear winner in the eco-nomic debates. A reinvigorated Megawati may have appeared awkward in her handling of economic questions in the TV dialogues, but she rightly underlined her administration’s record of restoring macroeconomic stability. Moreover, SBY’s running mate, Jusuf Kalla, occasionally unnerved the business community, particularly the ethnic Chinese sector, with his strong support for a ‘nationalist’ economic policy, including explicit support for Malaysian-style affirmative action programs. Observers have been quick to point out that Kalla had been a signifi-cant beneficiary of Soeharto-era patronage of pribumi (indigenous Indonesian) business, and that significant tensions may surface between such a policy approach and SBY’s commitment to deliver clean and transparent government.
An early test of the new administration will be the relationship between the executive and the bureaucracy. On the face of it, SBY could face serious obstacles in getting his reforms through the DPR, since his Democratic Party has fewer than 10% of the members. However, the general expectation is that this will not constitute a serious obstacle to a reforming administration—certainly no more serious than that with which the two previous administrations have had to con-tend.2 The power of a directly elected president—the first in Indonesia’s
his-tory—and a decisive victory, together with the resources of the executive to persuade and induce parliamentarians to pass legislation, all point in that direc-tion. Moreover, there is a general perception that SBY is less encumbered than his rivals and that he has incurred few political debts. Nonetheless, his attempt to assemble a ‘professional cabinet’ appears to have been somewhat compromised by the need to secure support from major parties and to accommodate the vari-ous regional and ethnic demands for ministerial representation. Furthermore, parliament still has sufficient power to frustrate and criticise the executive, par-ticularly if the government does not perform as well as expected.
The 9 September Bombing and Its Aftermath
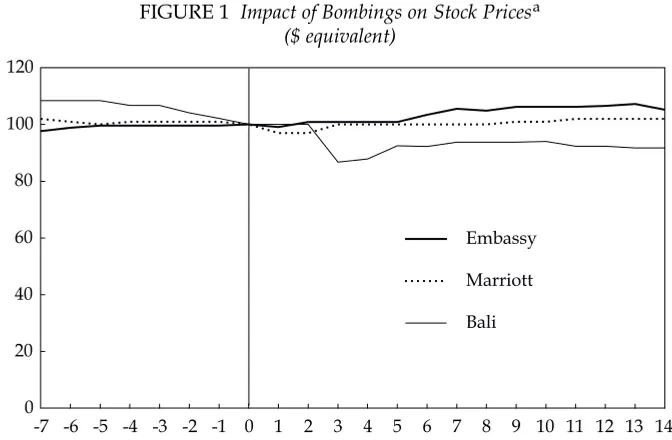
The broader ramifications of the 9 September terrorist attack are still being assessed. Undoubtedly it has further tarnished the country’s international repu-tation, and deterred tourists and potential investors. However, the immediate financial reactions were minimal. Hardly any impact was detected in the two most widely used indicators of market reaction, the Jakarta Stock Exchange (JSE) composite index and the Rp/$ exchange rate. Figure 1 takes both markets into account by showing movements in the dollar equivalent of the JSE index for one week prior to 9 September and two weeks after it. For comparison, the same series are shown for the Marriott and Bali bombings, all normalised to 100 on the day before each attack.3
The Australian embassy bombing had no perceptible impact on the daily data. By comparison, the Marriott bombing appears to have pushed the index down by about 3% for a couple of days. It is more difficult to isolate the impact of the Bali bombing—the first, and by far the most serious in terms of loss of life in an Indo-nesian terrorist attack—since the index was already falling quite rapidly prior to
it. The immediate fall exceeded 13%, but if we extrapolate the 7% decline that had occurred in the five days before the attack, the adjusted peak impact appears closer to 9%; in any case, the initial decline had largely been offset within about five days. The data suggest that the markets are learning to live with periodic ter-rorist attacks—in the sense that it is now realised that their effect on the economy is trivial by comparison with the horrific consequences for the individuals and firms directly affected, so the expected impact on asset values in general will be minor.
Such a cautiously optimistic conclusion applies to investors already in the country that have priced such risks into their calculus. Less certain, and unknow-able for the time being, is the effect on potential new investors. In particular, for-eign investors are likely to be more hesitant. Within this group there may be a continuing shift, observed since 1997, towards investors from developing Asia, arguably with a greater appetite for risk. The bombing will probably also re-inforce the predilection among investors for short-term, quick-return projects. Much will depend on the success of the authorities in capturing the perpetrators. A repeat of the Bali successes, and a strong commitment from the incoming administration to tackle terrorism, would greatly reassure the business commu-nity. Finally, it might be noted in passing that tourism to Bali has proven surpris-ingly resilient, suggesting that negative international perceptions do fade, perhaps faster than is generally appreciated.4
National Accounts
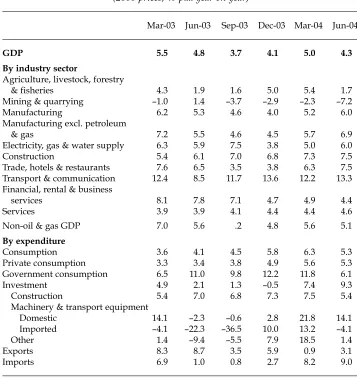
National accounts data through to the second quarter of 2004 indicate no major changes in economic trajectory (table 2). The economy continues to grow at a
-7 -6 -5 -4 -3 -2 -1 0 1 2 3 4 5 6 7 8 9 10 11 12 13 14 0
20 40 60 80 100 120
Bali Marriott Embassy
FIGURE 1 Impact of Bombings on Stock Pricesa ($ equivalent)
aThe horizontal axis measures days before and after each bomb attack.
Source: <finance.yahoo.com/q/hp?s=%5EJKSE>.
little over 4% on an annual basis. In the second quarter of 2004, it grew by 4.3% year on year (yoy), down from 5% in the first quarter. For the first half year, eco-nomic growth is therefore marginally below the government’s 4.8% target for 2004. On the production side, all sectors except mining recorded positive growth, but services continued to outstrip the goods sectors. Agricultural output grew approximately in line with projections at 3.5% in the first half year. The contrac-tion in the mining industry actually accelerated in the second quarter, despite gen-erally buoyant commodity prices—an issue to which we return shortly. Non-oil manufacturing continues to recover, though oil and gas processing has stagnated.
Practically all service sectors have been growing strongly; with construction included, services generated about two-thirds of first-semester growth.
Construc-TABLE 2 Components of GDP Growth (2000 prices; % p.a. year on year)
Mar-03 Jun-03 Sep-03 Dec-03 Mar-04 Jun-04
GDP 5.5 4.8 3.7 4.1 5.0 4.3
By industry sector
Agriculture, livestock, forestry
& fisheries 4.3 1.9 1.6 5.0 5.4 1.7
Mining & quarrying –1.0 1.4 –3.7 –2.9 –2.3 –7.2
Manufacturing 6.2 5.3 4.6 4.0 5.2 6.0
Manufacturing excl. petroleum
& gas 7.2 5.5 4.6 4.5 5.7 6.9
Electricity, gas & water supply 6.3 5.9 7.5 3.8 5.0 6.0
Construction 5.4 6.1 7.0 6.8 7.3 7.5
Trade, hotels & restaurants 7.6 6.5 3.5 3.8 6.3 7.5 Transport & communication 12.4 8.5 11.7 13.6 12.2 13.3 Financial, rental & business
services 8.1 7.8 7.1 4.7 4.9 4.4
Services 3.9 3.9 4.1 4.4 4.4 4.6
Non-oil & gas GDP 7.0 5.6 .2 4.8 5.6 5.1
By expenditure
Consumption 3.6 4.1 4.5 5.8 6.3 5.3
Private consumption 3.3 3.4 3.8 4.9 5.6 5.3 Government consumption 6.5 11.0 9.8 12.2 11.8 6.1
Investment 4.9 2.1 1.3 –0.5 7.4 9.3
Construction 5.4 7.0 6.8 7.3 7.5 5.4
Machinery & transport equipment
Domestic 14.1 –2.3 –0.6 2.8 21.8 14.1
Imported –4.1 –22.3 –36.5 10.0 13.2 –4.1
Other 1.4 –9.4 –5.5 7.9 18.5 1.4
Exports 8.3 8.7 3.5 5.9 0.9 3.1
Imports 6.9 1.0 0.8 2.7 8.2 9.0
Source: CEIC Asia Database; BPS.
tion, both residential and commercial, has recovered from the 1997–98 collapse, with high-rise mall, condominium and commercial projects booming in Jakarta and other major urban centres.5
Both lending to the sector and prices have picked up strongly in the past two years. Retail trade has been growing vigorously, particularly in the modern sec-tor, following the partial deregulation that enabled some major international players to establish operations in Indonesia. Transport has been boosted by the deregulation of domestic civil aviation, which has lowered costs and greatly increased passenger numbers. Telecommunications is also growing quickly, with the partial deregulation of cellular services a major stimulus.
In the expenditure accounts the consumption-led recovery continues. But there are some hopeful signs that investment may at last be picking up. Investment grew by 9.3% yoy in quarter two, resulting in 8.3% growth in the first half year. The composition of that investment has begun to shift from construction to plant and equipment. Capital goods import data appear to point in a similar direction. However, it is far too early to be confident that these encouraging trends indicate a significant return of investor confidence, especially since not all investment indicators point in the same direction. We noted above that balance of payments data through to the second quarter of 2004 recorded continuing negative FDI; a decomposition of the data (not presented here) reveals that realised inward FDI appears to be picking up, but that outward flows (repatriation and debt pay-ments) continue to exceed inflows.
Fiscal Issues
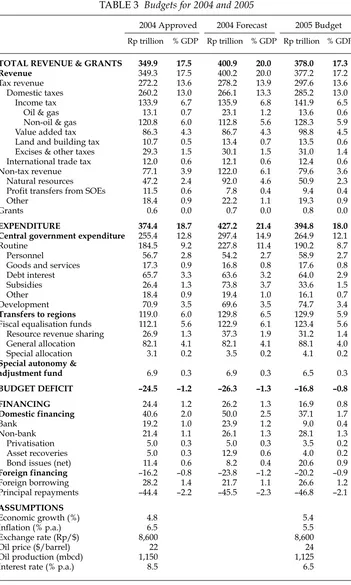
Megawati’s final independence eve address to the nation included her adminis-tration’s proposed 2005 budget, together with estimated first half 2004 outcomes. These are summarised in table 3. All figures underline the continued fiscal pru-dence that has been a hallmark of finance minister Boediono’s tenure. The figures reveal that the budget deficit is projected to fall to just 0.8% of GDP, down from the estimated 1.3% in 2004. It is not clear whether the incoming administration will adopt this budget as its own. However, SBY’s endorsement of fiscal prudence suggests, broadly speaking, that it will be a useful indicator of budgetary plans over the coming fiscal year.
If we compare the original 2004 budget projections with the estimates based on first-half results, the principal adjustment has been the oil price assumption. Ini-tially based on $22/barrel, the revised estimates assume $36, which may also be too low. But even this increase has resulted in the fuel subsidy rising from Rp 14.5 trillion to Rp 63 trillion (subsumed under ‘subsidies’ in table 3). The deficit is lit-tle affected, however, since the rising prices also increase government revenue from oil and gas. Thus the deficit is projected to increase by just 0.1% of GDP.
The proposed 2005 budget contains a mixture of optimism and caution. It assumes a growth rate of 5.4% (probably too high), an inflation rate of 5.5% (pos-sible, but rarely achieved in the past), an official interest rate of 6.5% (probably an under-estimate, especially since it implies a real interest rate of just 1%), an exchange rate of Rp 8,600/$ (possible if there is an ‘SBY euphoria effect’, but other-wise ambitious), and an oil price of $24/barrel (very unlikely on recent trends).
The revenue targets appear feasible. Tax revenues are projected to grow by about 4% in real terms over the approved 2004 budget figure. This is considered
TABLE 3 Budgets for 2004 and 2005
2004 Approved 2004 Forecast 2005 Budget
Rp trillion % GDP Rp trillion % GDP Rp trillion % GDP
TOTAL REVENUE & GRANTS 349.9 17.5 400.9 20.0 378.0 17.3
Revenue 349.3 17.5 400.2 20.0 377.2 17.2
Tax revenue 272.2 13.6 278.2 13.9 297.6 13.6
Domestic taxes 260.2 13.0 266.1 13.3 285.2 13.0
Income tax 133.9 6.7 135.9 6.8 141.9 6.5
Oil & gas 13.1 0.7 23.1 1.2 13.6 0.6
Non-oil & gas 120.8 6.0 112.8 5.6 128.3 5.9
Value added tax 86.3 4.3 86.7 4.3 98.8 4.5
Land and building tax 10.7 0.5 13.4 0.7 13.5 0.6
Excises & other taxes 29.3 1.5 30.1 1.5 31.0 1.4
International trade tax 12.0 0.6 12.1 0.6 12.4 0.6
Non-tax revenue 77.1 3.9 122.0 6.1 79.6 3.6
Natural resources 47.2 2.4 92.0 4.6 50.9 2.3
Profit transfers from SOEs 11.5 0.6 7.8 0.4 9.4 0.4
Other 18.4 0.9 22.2 1.1 19.3 0.9
Grants 0.6 0.0 0.7 0.0 0.8 0.0
EXPENDITURE 374.4 18.7 427.2 21.4 394.8 18.0
Central government expenditure 255.4 12.8 297.4 14.9 264.9 12.1
Routine 184.5 9.2 227.8 11.4 190.2 8.7
Personnel 56.7 2.8 54.2 2.7 58.9 2.7
Goods and services 17.3 0.9 16.8 0.8 17.6 0.8
Debt interest 65.7 3.3 63.6 3.2 64.0 2.9
Subsidies 26.4 1.3 73.8 3.7 33.6 1.5
Other 18.4 0.9 19.4 1.0 16.1 0.7
Development 70.9 3.5 69.6 3.5 74.7 3.4
Transfers to regions 119.0 6.0 129.8 6.5 129.9 5.9
Fiscal equalisation funds 112.1 5.6 122.9 6.1 123.4 5.6
Resource revenue sharing 26.9 1.3 37.3 1.9 31.2 1.4
General allocation 82.1 4.1 82.1 4.1 88.1 4.0
Special allocation 3.1 0.2 3.5 0.2 4.1 0.2
Special autonomy &
adjustment fund 6.9 0.3 6.9 0.3 6.5 0.3
BUDGET DEFICIT –24.5 –1.2 –26.3 –1.3 –16.8 –0.8
FINANCING 24.4 1.2 26.2 1.3 16.9 0.8
Domestic financing 40.6 2.0 50.0 2.5 37.1 1.7
Bank 19.2 1.0 23.9 1.2 9.0 0.4
Non-bank 21.4 1.1 26.1 1.3 28.1 1.3
Privatisation 5.0 0.3 5.0 0.3 3.5 0.2
Asset recoveries 5.0 0.3 12.9 0.6 4.0 0.2
Bond issues (net) 11.4 0.6 8.2 0.4 20.6 0.9
Foreign financing –16.2 –0.8 –23.8 –1.2 –20.2 –0.9
Foreign borrowing 28.2 1.4 21.7 1.1 26.6 1.2
Principal repayments –44.4 –2.2 –45.5 –2.3 –46.8 –2.1
ASSUMPTIONS
Interest rate (% p.a.) 8.5 6.5
feasible given the encouraging early results from the government’s more vigor-ous tax effort, especially the work of its Large Taxpayer Office. On the expendi-ture side, the figures underline the fact that the government’s fiscal room to move is very limited. Out of Rp 395 trillion of expenditure, about one-third (Rp 130 tril-lion) goes to the regions. Of the Rp 265 trillion at its disposal, an estimated Rp 98 trillion goes in interest payments and subsidies. The actual outlays in both cases are likely to be higher, as noted.
The government has also announced its intention to introduce a new format for the expenditure side of the budget, consistent with the government’s finance statistics format. In particular, it abolishes the long-standing, but misleading, dis-tinction between ‘routine’ and ‘development’ expenditures, instead reporting expenditures by type, function and government agency.
Most serious budget debate has centred on two issues: the rapidly growing size of the fuel subsidy, and the size (and by implication financing) of the fiscal deficit. The subsidy has blown out dramatically owing to the rapid increase in international fuel prices during 2004, and the Megawati government’s decision in early 2003 to abandon the mechanism that automatically linked domestic to inter-national prices. The fourfold fuel subsidy blow-out from the initial 2004 budget estimate of Rp 14.5 trillion (approximately $1.6 billion) to an estimated Rp 63 tril-lion, assuming a price of $36/barrel, could be higher still if international prices continue to rise through to the high-consumption Lebaran period. The estimated 2004 figure is also almost double the budgeted 2005 amount, and is approxi-mately equivalent to the budgeted figure for development expenditure in the cur-rent year.
Something has to give. Megawati’s lame response in the televised presidential debate, to the effect that oil prices will probably return to sub-$30 levels in the near future, is hardly persuasive, and does not accord with consensus interna-tional oil price projections. Her administration’s short-term populism, in discard-ing the automatic price adjustment formula, has bequeathed a nightmare for the SBY cabinet.
The SBY administration would of course have more room to move if it were willing to run larger fiscal deficits. Proponents of this view argue that a larger deficit would both stimulate the economy and address urgent public sector spending priorities. Moreover, it is pointed out, the current deficit is very small, well below that of the US and several European economies—not to mention many developing countries. The government’s response has been that achieving macroeconomic stability in the wake of the 1997–98 crisis has been extremely dif-ficult, and that any significant loosening of fiscal policy could further jeopardise the country’s seriously tarnished economic image. Furthermore, the time for a Keynesian fiscal stimulus was at the height of the crisis (when indeed the deficit did increase), whereas the challenge now is to return to the key drivers of faster economic growth, centred on a return of investor confidence. The government’s caution is also motivated by the fact that global interest rates are likely to rise, and with them public (and private) debt service.
The budget attachments, based on Department of Finance partial equilibrium modelling, give some illustrations of the approximate orders of magnitude of impacts of various factors on the budget deficit. Higher economic growth reduces the fiscal deficit: each 1% increase is projected to reduce the deficit by about
Rp 1.5 trillion. Increased interest rates obviously work in the opposite direction: a 1% increase in the 3-month SBI (Bank Indonesia Certificate) rate has about the equal but opposite effect. Each $1/barrel rise in the international oil price increases the deficit by Rp 0.9 trillion, assuming no pass-through to domestic petroleum prices. Similarly, a weakening rupiah increases the deficit (each Rp 100 depreciation against the dollar is estimated to translate into a Rp 1.2 billion increase in the deficit), principally because domestic petroleum prices cannot increase, while the rupiah cost of external debt service rises. Thus, in sum, higher growth, lower interest rates, a stronger rupiah and a smaller petroleum subsidy all help reduce the fiscal deficit. Only the last of these variables is directly amenable to government policy in the short term. The likelihood that the other three in aggregate will deliver a net positive effect on the deficit over the medium term must be considered slim.
There is also the question of how a larger deficit would be financed. A mone-tary expansion is problematic, given that Bank Indonesia (BI) appears to have dif-ficulty getting inflation down to levels comparable with that of Indonesia’s major trading partners. In any case, BI is now precluded by its own revised law from funding any budget deficit. Domestic borrowing is another possibility, but here too the scope appears to be limited. Expanded public borrowings could run a real risk of crowding out domestic borrowers, just as a fragile investment recovery appears to be getting under way.
That leaves international borrowing, probably in the form of concessional rates from multilateral and bilateral agencies. Increased borrowing in this form is almost certainly an option under certain scenarios. But the government has been boxed into a corner. Under pressure from parliamentary opinion and populist voices, it exited from the IMF program in late 2003. While this does not preclude foreign borrowing, the framework for such a program is less well defined. More-over, the head of Bappenas (the national planning agency) in Megawati’s admin-istration was a vociferous, if erratic, opponent of such borrowings. Denied this foreign borrowing option, the government has in effect been ‘more IMF than the IMF’.
The new administration might therefore be able to fund expanded develop-mental expenditure through a combination of winding back subsidies and run-ning a somewhat larger deficit funded through increased foreign borrowing. In this context it has the benefit of being able to draw on recent Indonesian economic history. During the country’s last two deep economic crises—almost 20 and 40 years ago—its leaders were able to fashion a swift and effective recovery agenda through a combination of decisive policy reform and foreign assistance. The key is that both elements are required, but both have been significantly absent since the crisis of 1997–98.
Monetary Developments
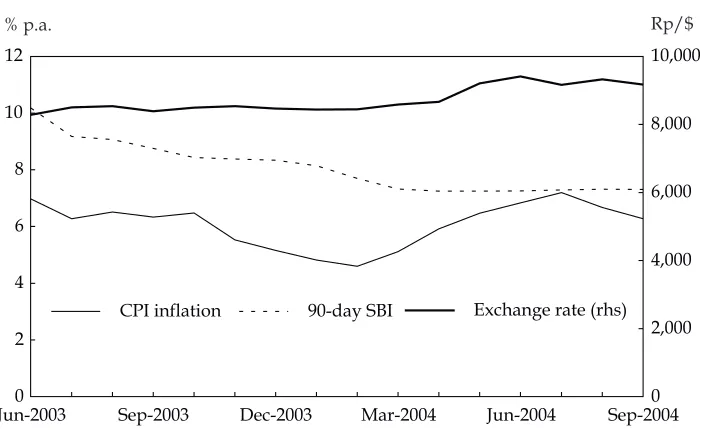
Monetary indicators continue to demonstrate that Indonesia has regained macroeconomic stability, but that this achievement is precarious (figure 2). After declining steadily through to early 2004, inflationary pressures have resurfaced, with a pick-up in the annualised rate to 7.2% yoy for the month of July, though they abated somewhat in August and September. It is now thought that the
ernment’s latest target for 2004 of 7%, announced as part of the former presi-dent’s 16 August speech, is plausible, though it is higher than the 4.5% initially forecast.
As a consequence of the pick-up in domestic inflation and international interest rates, especially in the US, the recent downward trend in domestic rates is unlikely to continue, and will probably be reversed, adding further to budgetary pressures as indicated above. There was virtually no change in the benchmark 3-month SBI rate over the period, implying a gradual decline in real interest rates. BI has been resisting any increase in interest rates, concerned about both economic and fiscal implications. In response to the rise in mid-year inflation, it has therefore resorted to some indirect responses, including an increase in reserve requirements effective 1 July, and modifications to the rules regarding banks’ net open positions, effective 1 September.
The rupiah has been sliding this year, declining by about 9% against the weak-ening dollar for the first eight months of 2004, and rendering it one of the world’s weakest currencies over this period (with only the Zimbabwe dollar and the Venezuelan bolivar declining faster). Much of the fall occurred during March–May, owing to both global factors (a sell-off in emerging markets and anticipation of the US interest rate increases) and domestic triggers (principally election-related uncertainty). Over this period, foreign exchange reserves fell by about $2 billion. However, the rupiah depreciation is in principle no major cause for concern, and is readily explained by fundamentals, in particular the persist-ent 5–7% differpersist-ential between inflation in Indonesia and that in its major trading partners, together with the modest capital flows into the country.
FIGURE 2 Inflation, Interest Rate and Exchange Rate
Jun-20030 Sep-2003 Dec-2003 Mar-2004 Jun-2004 Sep-2004 2
4 6 8 10 12
0 2,000 4,000 6,000 8,000 10,000
CPI inflation90-day SBI
Exchange rate (rhs) % p.a. Rp/$
Source: CEIC Asia Database.
DEVELOPMENT ISSUES Industrialisation
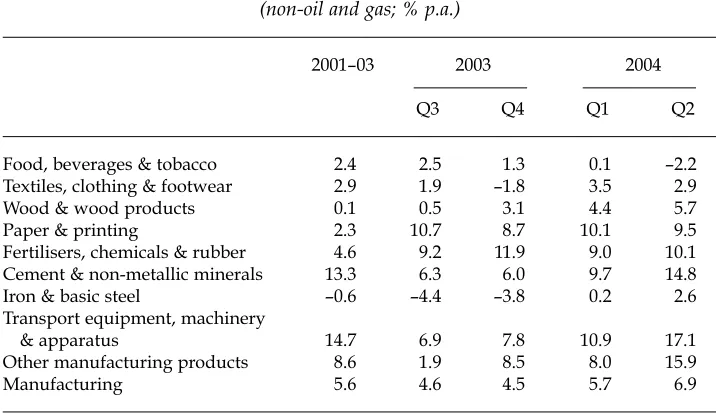
Indonesia’s industrial performance continues to be modest and uneven. In the first half year there was considerable divergence in growth rates among major branches of industry (table 4). The output of food, beverages and tobacco actually declined, continuing the sector’s weak growth rates of the past three years. Tex-tiles, clothing and footwear (TCF) also performed poorly, likewise continuing the trend of recent years. The two strongest sectors, both recording double-digit growth rates, were non-metallic minerals (dominated by cement and driven by the strong construction sector), and transport equipment and machinery, domi-nated by the automotive and electronics industry, with the former in particular growing strongly. The resource-based activities—wood, paper and chemicals— have also begun to recover. It will be useful to discuss these trends in more detail using the following classifications.
Resource-based Industries. Indonesia possesses a strong potential comparative
advantage in resource-based manufacturing, but post-crisis its performance in these sectors has continued to be mixed. The growth of food processing indus-tries has actually been negative over the past year. Some subsectors have grown quite quickly. For example, shrimp production has increased significantly. With its 81,000 km coastline Indonesia could be the world’s largest shrimp producer, and it currently boasts the world’s largest shrimp farm, in southern Sumatra, run by Thailand’s CP (Charoen Pokphand) Group. Industry output is growing rap-idly, from an estimated 8,000 tons in 2001 to 40,000 tons currently and a projected 100,000 tons by 2008; almost all output is exported. The industry could be— though often has not been—managed in an environmentally sensitive manner. The CP group is reportedly optimistic about its shrimp operations, and has been instrumental in the establishment of a Marine Research Centre to foster develop-ment of the industry. It does not report any serious problems with local govern-ments and communities. However, the group reports that Indonesia is less competitive in the poultry industry, with production costs more than double those of the US. The higher cost of corn and fishmeal is a factor in this difference. Among other processed food exports, cacaohas been increasing quite quickly, from $311 million in 2000 to $595 million in 2003. Indonesia now accounts for about 13% of global output. There are estimated to be 20 processing companies in the industry, mainly in Sulawesi. Processing quality is reportedly low, inhibiting the potential for Indonesia to be a leading chocolate exporter. The production and export of crude palm oil(CPO) has approximately doubled since 1997. Indonesia is the world’s second largest producer, and is expected to overtake Malaysia soon; on most estimates it is the lowest-cost producer. Growth has been boosted in recent years by the rupiah depreciation and the entry of several major Malaysian interests; world prices have also increased sharply over the past year.
The coffeeindustry grew quite strongly in the immediate post-crisis period, but in
recent years output has declined owing to low international prices. Unlike Brazil and Colombia, Indonesia lacks an industry association that could effectively lift quality control standards, promote exports and establish a certification scheme (for residual pesticide and fertiliser content, for example).
Wood-based manufacturing firms allege that raw material supplies are now problematic, principally owing to rampant export smuggling of logs, mainly to
China. The industry most adversely affected is plywood, which over the past 20 years (since a log export ban was imposed) has been a vehicle for capturing the rents from the artificially depressed domestic timber prices, rather than using the opportunity to develop an efficient processing industry. The furniture industry has been similarly affected by rising timber prices, though it has been better able to adapt, through improved quality control, better design, an ability to meet inter-national environmental standards, and improved interinter-national marketing.
In much of the large petrochemical industry, investment in both new plants and increased capacity has been frozen since the crisis. Investments from Japan, the dominant foreign actor in the industry, are indicative. Pre-crisis, these were in excess of $400 million per year, but in the past three years they have averaged just $24 million. The comparable figures for China and Thailand respectively are $131 million and $144 million (in 1997), and $180 million and $93 million (2001–03 average).6
The collapse in domestic demand was the immediate cause, together with slow debt workouts in several major corporations. Unreliable power supply in this energy-intensive industry has become a major problem. A recent, albeit minor, irritant is a 2004 Department of Industry and Trade stipulation that 50% of raw salt, a significant input into PVC production, should be procured domestically; furthermore, for at least 1–2 months before and after the domestic salt harvest season, raw material imports are prohibited.
‘Traditional’ Export-oriented Industries. This group is dominated by the once
vibrant textile, clothing and footwear industries, which led Indonesia’s labour-intensive, export-oriented industrialisation drive of the 1980s. An air of pessimism permeates these sectors. In the immediate aftermath of the crisis, export-oriented firms that were not engulfed by the crisis benefited from the sharp but short-lived
TABLE 4 Manufacturing Growth (non-oil and gas; % p.a.)
2001–03 2003 2004
Q3 Q4 Q1 Q2
Food, beverages & tobacco 2.4 2.5 1.3 0.1 –2.2 Textiles, clothing & footwear 2.9 1.9 –1.8 3.5 2.9 Wood & wood products 0.1 0.5 3.1 4.4 5.7
Paper & printing 2.3 10.7 8.7 10.1 9.5
Fertilisers, chemicals & rubber 4.6 9.2 11.9 9.0 10.1 Cement & non-metallic minerals 13.3 6.3 6.0 9.7 14.8 Iron & basic steel –0.6 –4.4 –3.8 0.2 2.6 Transport equipment, machinery
& apparatus 14.7 6.9 7.8 10.9 17.1
Other manufacturing products 8.6 1.9 8.5 8.0 15.9
Manufacturing 5.6 4.6 4.5 5.7 6.9
Source: BPS.
real exchange rate depreciation. However, export growth has decelerated sharply since 2000, and in general the industries appear unable to compete with China and other low-cost producers. Constant market share (CMS) analysis by Aswicahyono
et al. (2004) suggests that Indonesia is losing ‘competitiveness’ in the garment
industry, even though its unit labour costs (wage costs adjusted for productivity) apparently remain competitive. FDI in the industry has virtually disappeared. The once major Japanese presence is fading: Japanese textile firms invested on average $119 million per year in the four years immediately preceding the crisis; over the past two years, the figure has averaged just $7 million.
Over the past decade international competition in these industries has
intensi-BOX 1 NEWSOCIALSECURITY ANDLABOURLAWS:
GRANDIOSEPROMISES WITHCOUNTERPRODUCTIVECONSEQUENCES?
On its last evening the outgoing parliament passed a new social security law that promised all Indonesians a comprehensive health insurance program, a pension, an old age benefit, and other benefits. The programs are to be pub-licly managed through existing state-owned pension agencies. A tripartite ‘trust’ council appointed by (and accountable to) the president is to be estab-lished to oversee policy and manage social security funds. While the law does not specify the payroll tax rates to fund the programs, earlier proposals suggested that taxes could range from 17 to 20% of workers’ wages. Contri-butions would also somehow be collected from better-off workers in the informal sector, while the poor would have their premiums paid by the gov-ernment.
Despite parliament’s support for the bill there was considerable resistance from key stakeholders—in particular, employer and worker representa-tives—who complained that the drafting committee did not engage them from the start of the process, or provide them with all the information neces-sary to undertake a proper assessment of the proposal.
There is concern about the financial sustainability of the plan—a ‘defined benefit’ plan under which the government has to provide a pension benefit directly linked to workers’ wages at the time of retirement. The concern is well grounded. For example, the Philippine defined benefit pension plan had accumulated unfunded liabilities amounting to $21 billion by 2000, forcing the government to raise taxes and freeze pension benefits from 2001 to restore solvency. More generally, Indonesia could have learned from the reform expe-rience of social security programs in more than 30 countries over the past 20 years, especially the financial and governance challenges associated with tra-ditional public sector pension and health care schemes. Unfortunately, in opt-ing for a traditional public sector program, the drafters of the law did not appear willing or able to draw on these important lessons of history.
The social security law is not the only recent initiative that increases the cost of employing labour in Indonesia. Although the pressure to raise mini-mum wages has abated, other aspects of the labour regulatory regime con-tinue to push up labour costs. In 2003 parliament passed the labour protection act, which consolidates a comprehensive set of regulations
fied, while Indonesia has become less competitive. Two major problems affect export-oriented firms in Indonesia; these have been documented in previous sur-veys (see also James et al.2003), and are discussed in more detail below. The first is labour problems, including mandated minimum wages, costly dismissal pro-cedures, and now the recently passed social security bill (box 1). The second is that import–export procedures have become increasingly costly, cumbersome and unpredictable in recent years.
Without significant and quick reforms, the situation is likely to get worse. The Multi-Fibre Agreement (MFA), which governs world trade in textiles and cloth-ing, and which, over the past 20 years, has been successively a protector, inhibitor
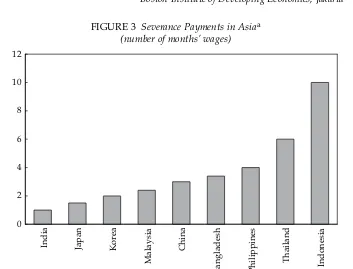
ing labour conditions and standards. In the last 18 months 26 implementing regulations have been enacted, with many more in the pipeline. In conse-quence, labour policy has become much more restrictive than in other Asian economies. For example, Indonesia’s severance rates are among the most costly in Asia, if not the world (figure 3).
Kelly Bird GIAT (Growth through Investment and Trade) Project,
Boston Institute of Developing Economies, Jakarta
FIGURE 3 Severance Payments in Asiaa
(number of months’ wages)
aData apply to an employee with four years’ service with the firm being dismissed because of economic restructuring.
Sources: Departments of Labour in the countries shown.
and again protector of Indonesian exporters (depending on whether they were internationally competitive), will terminate by the end of 2004. In the face of open competition, particularly from China, Indonesia is expected to lose market share. As an early indicator of the problems ahead, Indonesia’s export performance in the world’s largest non-MFA import market, Japan, has been disappointing, and it has lost about 40% of its market share there in recent years.
There are also momentum effects arising out of the progressive shift of major exporters and trading networks towards China (and, on a much smaller scale, Vietnam). The China–ASEAN free trade agreement may well hasten this trend. The increased uncertainty is also resulting in greatly reduced investment in the industry and an aging stock of machinery, much of it dating back to the peak of the export boom in the late 1980s.7Industry sources report that at least $500
mil-lion is needed for a modernisation program. Banks are said to be reluctant to lend to TCF firms owing to the uncertain export outlook.
There are of course exceptions to this gloomy picture. Some firms are manag-ing quite well in niche markets, on the basis of well-established supply channels or fashion innovation. The latter includes segments of Bali’s garment industry, which continues to be innovative in design. The capital-intensive fibre and yarn sector, especially the higher quality end, is reported to be doing better, on the basis of accumulated industrial expertise and competitive raw material costs.
‘New’ Export-oriented Industries. The picture is somewhat brighter for the
so-called new export-oriented industries, among which electronics is dominant. The industry is dominated by multinational enterprises (MNEs) and is not so sensi-tive to labour costs. Many of Indonesia’s export-oriented firms are located in Batam, adjacent to the Singapore-centred regional MNE networks, which also include limited access to the US–Singapore FTA provisions. Import–export proce-dures therefore do not present such a serious problem. Electronics has been one of Indonesia’s fastest growing export items in recent years. Nevertheless, the country was a latecomer to the global electronics industry (Hobday 2001) and it is a relatively minor actor in regional networks (Aswicahyono et al. 2004). It remains predominantly in early-stage assembly activity, and has yet to develop a broader range of products and significant local backward linkages.
Consumer Durables. These industries, dominated by the automotive and
con-sumer electronics subsectors, have experienced mixed fortunes since the crisis. Both, but particularly the former, have undergone massive structural adjustment in the wake of the crisis, owing to the collapse in domestic demand (on which they are overwhelmingly dependent) in 1997–98 and to the sudden withdrawal of protection. But both have recovered surprisingly quickly in the recent past, as domestic demand has surged ahead and efficiency gains have allowed domestic firms to compete with imports.
The auto industry in aggregate has now recovered from the crisis. Sales in 2004 are likely to be at least 420,000 units, exceeding the pre-crisis peak of 390,000 units. In the last two years sales have been booming, and firms have struggled to meet demand. Efficiency has almost certainly risen significantly, since the indus-try now receives quite modest levels of protection following the June 1999 reform, which reduced most tariffs to no more than 20%. As with electronics, industry sources regard 20% as the approximate threshold protection level above which smuggling is induced. The auto industry is actually the only manufacturing
branch (at the 2-digit International Standard Industrial Classification level) in which Japanese investment exceeds that of pre-crisis times—by a margin of more than 2:1.
By volume, exports have risen from 1.4% of output in 1997 to about 17% cur-rently. CBU (completely built up) vehicles constitute a rising proportion of these exports. So-called multipurpose commercial vehicles (MPVs) dominate the mar-ket with about 60% of total sales, and Indonesia has the potential to develop as a major base for this segment of the market. Local content for these vehicles is cur-rently around 50%, and is projected to rise to 70% as Indonesia becomes more competitive in raw materials, dies and parts. Yet auto component exports remain modest and are growing only slowly. They currently total about $700 million annually, or 5% of total domestic sales. For the industry leader, Astra Otoparts, exports (mostly batteries) constitute about one-quarter of its revenue.
The lower levels of protection have resulted predictably in considerable indus-try rationalisation, with fewer models, and longer production runs for both vehi-cles and components (Aswicahyono et al. 2004). The challenge is to increase efficiency, exploit scale economies, undertake technological upgrading, lift qual-ity and develop global market niches.
The motorcycle industry is also booming and, as was the case before the crisis, it is the most efficient segment of the auto industry, with four main producers sharing the world’s third largest domestic market; all are able to exploit scale economies. Domestic sales in 2004 are expected to be about 4 million units— double the pre-crisis peak. These firms have been able to weather the challenge of much cheaper Chinese products that flooded in immediately after the opening of the domestic market in 1999, but which proved to be highly unreliable and lacked spare parts and service facilities.
While auto exports are rising, they remain modest compared to those of the region’s leader, Thailand. Within Southeast Asia, excluding Malaysia, there is now in principle free trade in the industry. This has yet to be realised in practice, owing to the need for harmonisation of standards (for example, on safety and emissions), and Indonesian firms need to move to global best practice if they are to be serious players in global markets. In any case, industry sources and MNE auto firms conclude that Thailand is generally a more efficient production base than Indonesia, except for motorcycles and perhaps certain utility vehicles. Thai-land liberalised earlier. It has attracted all major auto MNEs, including, increas-ingly, those in the major components sectors. Its rapidly growing exports have enabled firms to shift further down the cost curve, and it has a stronger skill base (including some government-supported testing and calibration facilities). Poor-quality raw material supplies continue to hamper the Indonesian industry, including steel plate from the state-owned Krakatau Steel, and aluminium prod-ucts. Export-oriented firms can in principle avail themselves of duty drawback facilities but, as noted below, these are costly, time-consuming and unpredictable. They also necessitate considerably larger inventories.
The demand for consumer electronics has been growing strongly: over the period 1999–2003, it is estimated to have increased by about 350% for colour TV sets, 300% for refrigerators, 400% for washing machines and 500% for air condi-tioners (JP, 20/9/2004). Even with lower protection, smuggling is reported to be rampant, with industry sources claiming that up to 50% of sales are of illegal
imports. The reduction in the luxury tax to 10–20% is thought to have dimin-ished smuggling somewhat. An uncertain investment environment is especially deleterious for the electronics industry, given the very rapid rate of global prod-uct innovation. The electronics MNEs are holding back from upgrading their capabilities in Indonesia, in products as diverse as plasma TV sets, notebook computers, digital cameras and other IT-based items. The weak domestic sup-plier base also hampers the industry’s growth. In the immediate post-crisis period, the major Korean producers entered the industry aggressively, and took market share from the hitherto dominant Japanese players, two of which (Aiwa and Sony) have withdrawn from Indonesia in the past two years. The Korean entrants saw an opportunity to outcompete the Japanese companies, many of which were seriously affected by foreign exchange losses and rising debt in 1997–98. Encouragingly, one major Korean electronics company interviewed by the authors reported that its Indonesian operations ex-factory were internation-ally competitive, that it had no serious labour problems, and that it could even manage with the rapid wage increases since 2000, provided employment prac-tices were flexible. However, its export competitiveness was severely affected by the import–export procedures and logistical problems referred to below. As a result, it had undertaken no major new investments in Indonesia since 2000.
Comparative Industrial Export Performance. As a result of these developments,
Indonesia’s export performance continues to languish. Non-oil export growth since the crisis has averaged about 3% per annum, compared to about 16% between 1990 and 1996. Apart from intensifying global competition, the sources of the slowdown are almost entirely domestic, supply-side factors, since global trade growth in the two periods has been broadly similar. Even in sectors where its exports have been performing well, notably electronics, Indonesia’s share of world trade has been slipping.
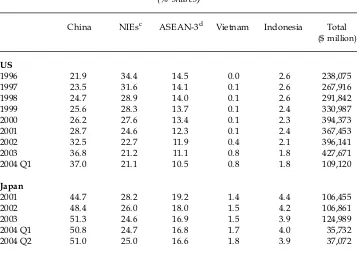
Indonesia is also struggling to hold its position in major manufacturing export markets. This can be seen from its share in US and Japanese imports through to early 2004 (table 5).8In the US, China’s share has almost doubled since the mid
1990s, from around 20–22% to almost 40%. Most East Asian exporters have lost market share, except for the special case of Vietnam after the signing of its bilat-eral trade agreement with the US. Indonesia’s share held up through to around early 2001, but it has been slipping since. China’s share of Japanese manufactured imports is higher still, and now exceeds 50%. Indonesia’s share has been sliding, also since around early 2001, and in contrast to the constant (and higher) share of Thailand (included in ‘ASEAN-3’) and the increase recorded by Vietnam. Con-versely, of course, while Indonesia is losing market share to China in third coun-try markets, China itself is now a rapidly growing destination for Indonesian exports.
The Mining Industry
‘It’s the pits’ seems to be the most common characterisation of the Indonesian mining industry since the late 1990s. The East Asian economy of any size with the strongest comparative advantage in natural resource based activities, Indonesia has struggled to maintain its mining sector, notwithstanding historically high international mineral prices. The decline of the sector, which has continued dur-ing the survey period, is a microcosm of the development challenges of the
Soeharto period. For most of the New Order period, Indonesian mining policy was regarded as a model for developing countries: it offered security and pre-dictability for investors, and considerable revenues for the central government. The system was of course seriously flawed, in that local interests were subjugated to national priorities, environmental protection was accorded low priority, and high-level corruption was widespread. Yet among the major developing country mineral producers, Indonesian was recognised for its many positive achieve-ments.
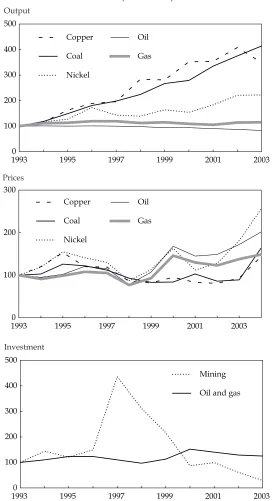
The record since the late 1990s has been extremely disappointing. Figure 4 shows trends in output, prices and investment, disaggregated into the oil and gas sector and major mineral products. Output growth was sluggish for much of the 1990s owing to low international prices and the emergence of several major new
TABLE 5 US and Japanese Imports of Manufacturesa
from Selected Developing Countriesb
(% shares)
China NIEsc ASEAN-3d Vietnam Indonesia Total
($ million)
US
1996 21.9 34.4 14.5 0.0 2.6 238,075
1997 23.5 31.6 14.1 0.1 2.6 267,916
1998 24.7 28.9 14.0 0.1 2.6 291,842
1999 25.6 28.3 13.7 0.1 2.4 330,987
2000 26.2 27.6 13.4 0.1 2.3 394,373
2001 28.7 24.6 12.3 0.1 2.4 367,453
2002 32.5 22.7 11.9 0.4 2.1 396,141
2003 36.8 21.2 11.1 0.8 1.8 427,671
2004 Q1 37.0 21.1 10.5 0.8 1.8 109,120
Japan
2001 44.7 28.2 19.2 1.4 4.4 106,455
2002 48.4 26.0 18.0 1.5 4.2 106,861
2003 51.3 24.6 16.9 1.5 3.9 124,989
2004 Q1 50.8 24.7 16.8 1.7 4.0 35,732
2004 Q2 51.0 25.0 16.6 1.8 3.9 37,072
aManufactured goods include all products belonging to sections 5 through 8 of the Stan-dard International Trade Classification (SITC), excluding SITC 67 (ferrous and non-ferrous metal).
bNon-OECD countries plus Korea.
cKorea, Taiwan, Hong Kong and Singapore. dMalaysia, Thailand and the Philippines.
Sources: Compiled from the online database of the United States International Trade Com-mission, <dataweb.usitc.gov/script/user_set.asp>, and Japan Customs, Ministry of Finance, <www.customs.go.jp/toukei/srch/indexe.htm>.
Output
19930 1995 1997 1999 2001 2003
100 200 300 400 500
Copper
Coal
Nickel
Oil
Gas
5c Investment
19930 1995 1997 1999 2001 2003
100 200 300
Copper
Coal
Nickel
Oil
Gas Prices
19930 1995 1997 1999 2001 2003
100 200 300 400 500
Mining
Oil and gas Investment
FIGURE 4 Mining Sector Output, Prices and Investment (1993 = 100)
Sources: Output: Department of Energy and Mineral Resources, Directorate of Mineral and Coal Enterprises, <www.dpmb.esdm. go.id>; prices: International Financial Statistics Online, <ifs.apdi.net/imf/>; investment: 1993–98, <strategis.gc.ca/epic/internet/inimr-ri.nsf/fr/gr-81122f.html>; 1999–2002, Department of Energy and Mineral Resources, Directorate General of Geology and Mineral Resources, <www.djgsm.esdm.go.id>.
exporters. Since around the late 1990s, however, international prices for virtually all products have risen strongly. Indonesia’s production response has been patchy, with output of most mining products increasing more slowly than in the pre-crisis period.
Nickel is the only major mineral whose output is growing faster than in the 1990s. Its international price has improved more than most, and the country’s largest producer, Sulawesi-based Inco, has maintained relatively good relations with local stakeholders, to some extent insulating it from the problems experi-enced by many other miners. Coal production has been increasing in shallow open-cut mines where existing permits enable the producers to maintain produc-tion more or less unhindered. Similarly, copper concentrates come mainly from the Freeport mine in Papua, whose operations have been maintained. But in both cases, output is growing at little over half its rate from 1990 to 1997. With the exception of gold produced as a by-product of the Freeport mine, the rest of that industry is likely to close in the near future, apart from various illegal operations. Output of both oil and gas is stagnant. It is worth noting that, obviously, offshore oil and gas activities have been relatively unaffected by the forestry provisions and demarcation disputes mentioned below.
Of major concern is the fact that there appears to have been virtually no invest-ment response to the price increases. Investinvest-ment has declined sharply across all sectors, particularly in the non-oil and gas sector. Investment in exploration in the latter has declined every year since 1997, from about $44 million pre-crisis to less than $7 million currently. In the case of oil and gas, 75 exploration contracts were signed in 2003, but no investment is thought to have commenced in any of them. Three inter-related problems bedevil the industry. The first is the absence of a legal and regulatory framework. Until recently, the industry was regulated by Law 11/1967, one of the first laws introduced by the New Order regime. This was revoked in 1999, but has still not been replaced by a new one. In effect, the indus-try is operating in a legal vacuum. A new law has been promised for several years, and various drafts have been proposed. However the Department of Mines and Energy and the various interest groups are apparently still not close to pro-ducing an acceptable law, which then would have to be proposed to the DPR. The parliamentary process is likely to take some time, after which implementing reg-ulations will be needed. Hence, even under the most optimistic scenario this lack of certainty will continue for another couple of years. Then, given the long lead times in the industry, investment would not be expected to pick up for several more years. In effect, the industry has been set back at least a decade.
The second difficulty, in part a consequence of the first, is that the legal vac-uum problem has been compounded by the stipulation in Law 41/1999 on forestry, that open pit mining may not be undertaken in areas designated as ‘pro-tected forests’ (hutan lindung), defined as areas where the slope of the terrain is at least 15%. Obviously, there is a strong argument for prohibiting, or at least signif-icantly restricting, mining in national parks and in other areas judged to be of environmental importance, such as water catchments and slopes vulnerable to erosion. Clearly, also, environmental safeguards ought to be imposed on mining operations, regarding waste disposal, re-vegetation requirements, and so on. However, the ban on open pit mining in ‘protected forest’ areas is a blunt and highly restrictive instrument. It is estimated that protected forests account for
over 18% of Indonesia’s total land area and almost 30% of its prospective mining area (Aspinall 2004), and include land that has been extensively logged (and often still is, illegally), is under cash crops, or in some cases is covered by alang alang grass.
The third problem relates to secure property rights and, in particular, the oper-ations of illegal miners in the context of rapid decentralisation to the regions. Under Law 22/1999 on regional autonomy, regional governments have argued that they have the right to regulate the industry. Both provincial and especially
kabupaten(district) governments, in cooperation with the military, have become
major players. Many are issuing mining permits of dubious legal validity. More-over, there is no inter-jurisdictional consistency, even if the permits are legal. It is difficult to estimate the incidence of illegal mining, but it is reported to be ram-pant in practically all significant mine sites. Since local authorities are invariably involved, tacitly or actively, the officially approved miners have little legal pro-tection. Illegal miners do not contribute to government revenue. They flout envi-ronmental safeguards, and they access quick-return mining deposits, often to the detriment of viable long-term mining practices.
Various international assessments confirm Indonesia’s unattractive mining investment climate. An example is the annual and widely cited Fraser Institute (2004) report, which ranks 53 national and (in federal systems) subnational juris-dictions, based on a survey of 159 global mining companies. According to its ‘mineral potential index’, a survey of geological potential, Indonesia ranks sixth (behind Russia, Western Australia, Peru, Chile and Nevada). However, on a ‘pol-icy potential index’, which incorporates a range of regulatory, taxation and envi-ronmental indicators, with particular attention to enforcement and predictability, Indonesia ranks fourth lowest, below even Zimbabwe, Venezuela and Russia.
Perhaps these developments are the inevitable consequence of Indonesia’s post-crisis institutional paralysis and the pent-up local frustration with 30 years of highly centralised control. In some respects, the current situation resembles that of the mid 1960s, in the sense that most major international mining compa-nies have exited Indonesia and regard it as a risky and insecure option. It will take some time to re-establish the country’s investment credentials. As in the late 1960s, credible and simple regulatory arrangements and a competitive tax regime will be required to win back confidence. Whether the new administration will be able to convince public opinion of the desirability of change, and implement reforms in concert with the regional authorities, remains to be seen. Perhaps one ray of hope for the industry is that SBY was the Minister for Mines and Energy for about nine months during the Gus Dur presidency, and it is thought that he has an understanding of the industry.
The Investment Climate
Indonesia’s investment picture is gloomy. Perhaps the gloom is overstated (Jaya-suriya and Manning 2004), yet both the anaemic investment data and various comparative international surveys of the investment climate underscore the need for major reform. It will be useful briefly to survey some recent research on this subject to illustrate where and how the new administration might institute quick-acting reforms. Many of the findings of course have a sense of déjà vuabout them. Indonesia does not possess accurate, timely and disaggregated investment
data (Thee 2004). The latest Investment Coordinating Board (BKPM) approvals data, not shown here, report continuing low levels of investor interest. They also report the trends of recent years: the rising importance of East Asia as a source of FDI; the much higher share of mergers and acquisitions (M&As) rather than ‘greenfields’ projects as compared to the pre-crisis period (the M&A share of approved FDI rose from 5% to 36% over the period 1997–2003); and the increased importance of non-tradable sectors (such as real estate) in total investment.9
Indonesia’s regulatory environment continues to rank poorly in most interna-tional comparisons. The latest UNCTAD World Investment Report(2004) ranked Indonesia’s score on its investment performance index the second lowest among 140 countries. According to the 2004 International Finance Corporation (IFC)/World Bank report, Doing Business in 2005, released in September, it takes, on average, 151 days to register a business in Indonesia, one of the longest lead times among the 145 nations surveyed. (The OECD average is reported to be 27 days, while that for East Asia is 61 days.) Indonesia also scored poorly on vari-ous aspects of labour market regulation and the cost of contract enforcement. The 2004 edition of the annual JETRO survey of Japanese-affiliated manufactur-ers in Asia asked respondents to compare the investment environment in the six main ASEAN economies plus India. Indonesia scored worst in five of the six areas covered—local governments, tax practices, customs procedures, recent wage increases and general labour issues.
Some recent research has attempted to estimate the costs associated with an inefficient logistics industry, including slow and complex export procedures, finding that Indonesia compares poorly with most major East Asian economies.10
For example, Carana Corporation (2004) concluded that up to 50% of the total cost of logistics and transport for Indonesian exporters occurs prior to interna-tional shipment, and that this particularly affects a range of agricultural products such as plywood, coffee and rubber. Indonesian exporters are also estimated to pay 30–40% more than their Singapore counterparts for cargo insurance, owing to theft and piracy in the ports. The report also pointed out that 75% of Indo-nesia’s export shipments go through regional hubs in Singapore and Malaysia in order to benefit from their high-quality maritime services. Indonesian exporters pay on average about $800 per container for these hub services, on top of uncom-petitive port, customs and ‘facilitation charges’ at home. Moreover, customs pro-cedures are corrupt and slow. One estimate suggests that it takes Indonesian garment exporters on average 22 days to ship from factory to arrival in Los Ange-les, compared to 15 days for those operating in coastal China.
In any discussion of the investment climate the role of Japan deserves special attention. For most of the three decades of Soeharto rule Japan was the dominant foreign commercial power, as foreign investor, donor and close supporter. The Jakarta–Tokyo axis was one of the most durable and powerful examples of north–south cooperation in the last quarter of the twentieth century, notwith-standing occasional hiccups such as the ‘Malari’ riots of January 1974. Although the subject of little academic comment, at least in the English language (Odano 2004 is one of the few exceptions of which we are aware), that axis appears to have weakened considerably. The process was already under way before the events of 1997–98. Japan’s economy was becoming less energy-intensive and dependent, and therefore the resource security motive (and hence Indonesia and the Malacca
Straits) figured less prominently in its strategic thinking. Indonesia was becoming less aid-dependent, and thus Japan’s absolute dominance as a bilateral donor was less of a consideration. Japan’s decade-long recession had already resulted in it becoming a less important regional actor, and its importance was even beginning to be doubted by an influential Indonesian constituency philosophically predis-posed towards ‘Japan-style’ industrial policy. For both countries the rapid rise of China was a new element in the East Asian economic equation, and both were making a commercial reorientation towards that country.
The 1997–98 crisis accelerated this geo-strategic reappraisal. Japan was the most generous (and in Indonesian eyes ‘faithful’) of the foreign donors, but ‘Washington’ (both the international agencies and the administration) set the agenda. Both Indonesia and Japan were attracted to alternative crisis-resolution strategies—from less onerous conditionality to some sort of ‘Asian Monetary Fund’—but these inclinations have thus far amounted to little. Meanwhile, Japan-ese commercial interests were adversely affected by Indonesia’s sudden and unexpected regime change. The debt workouts inevitably have been painful, and the policy settings in sectors of major Japanese interest have sometimes been altered dramatically, as for example in the automotive industry.
It is important not to overstate this argument. Each country has diminished expectations of the other, but both remain central to the other’s economic and strategic thinking. Japan’s East Asian strategy is now dominated by what is often termed ‘China plus one’: China is the major commercial player, but other coun-tries are relevant for the purposes of risk diversification. In practice, the ‘one’ is now more likely to be Thailand, or even Vietnam, rather than Indonesia. The international political and strategic implications for Indonesia are far-reaching. For almost the entire Soeharto era, the country could count on the unswerving loyalty of the world’s two dominant economic powers (in the US case, at least until the end of the Cold War). Indonesia now has cordial relations with both, but arguably not at the same level of intimacy.
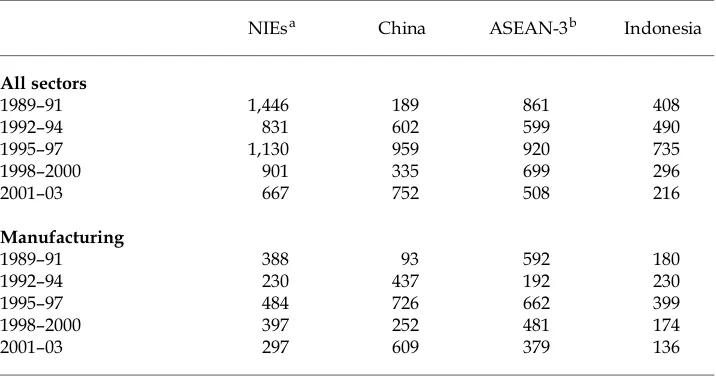
One indication of the Japanese commercial reorientation away from Indonesia and towards China is the composition of its outward investment flows. Table 6 reports outward flows by major East Asian destination in total, and for manufac-turing, since the late 1980s.11Japanese investment in China overtook that to
Indo-nesia in the early 1990s, but in the second half of the 1990s (i.e. continuing into the immediate post-crisis period) the flows to China were only 10–20% larger. In the past three years, they are more than three times larger. The turnaround, and the orientation towards China, in manufacturing FDI has been greater still. Partly these figures simply reflect the growing dominance of China with respect to all countries. But Indonesia has also been slipping compared to the Asian NIEs and other ASEAN countries, albeit not as quickly.
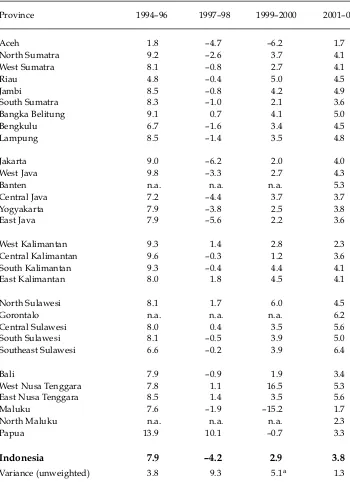
Regional Development
Indonesia is nearly four years into its major decentralisation experiment. It is obviously too early to draw authoritative conclusions about the impact on regional dynamics, given the ongoing changes in centre–region relations and a wide array of events—from rapidly rising commodity prices to terrorist attacks— with region-specific effects. Nevertheless, it may be worth looking for signs of new patterns beginning to emerge in regional (provincial) growth rates. Table 7