Full Terms & Conditions of access and use can be found at
http://www.tandfonline.com/action/journalInformation?journalCode=cbie20
Download by: [Universitas Maritim Raja Ali Haji] Date: 18 January 2016, At: 19:35
Bulletin of Indonesian Economic Studies
ISSN: 0007-4918 (Print) 1472-7234 (Online) Journal homepage: http://www.tandfonline.com/loi/cbie20
Survey of recent developments
Anton H. Gunawan & Reza Y. Siregar
To cite this article: Anton H. Gunawan & Reza Y. Siregar (2009) Survey of recent developments, Bulletin of Indonesian Economic Studies, 45:1, 9-38, DOI: 10.1080/00074910902836148
To link to this article: http://dx.doi.org/10.1080/00074910902836148
Published online: 26 Mar 2009.
Submit your article to this journal
Article views: 125
View related articles
ISSN 0007-4918 print/ISSN 1472-7234 online/09/010009-30 © 2009 Indonesia Project ANU DOI: 10.1080/00074910902836148
SURVEY OF RECENT DEVELOPMENTS
Anton H. Gunawan Reza Y. Siregar
PT Bank Danamon Indonesia, Jakarta IMF–Singapore Regional Training Institute
SUMMARY
Two major elections and the increasingly severe global fi nancial crisis (GFC) will
dominate politics and economics in Indonesia in 2009. The parliamentary election will be held in April, followed by the presidential election in July. The public is now experienced at voting, and these events are expected to be peaceful and suc-cessful. The impact of the GFC is of much greater concern.
The economy continued to perform well in 2008. With quite robust economic growth, commendable progress with administrative reform in the fi nance
min-istry, and higher than expected oil prices, both tax and non-tax revenues signifi
-cantly exceeded their 2008 budget targets, leaving the government with unspent funds in excess of Rp 50 trillion. The banking sector also performed well, with lending continuing to expand rapidly. However, there was a signifi cant fall in
average capital adequacy as banks took on more risky assets and wrote down their capital in response to falling bond portfolio values.
Signs of economic slowdown began to emerge in the second half of 2008, how-ever. The collapse of the global fi nancial services fi rm Lehman Brothers in
Septem-ber sparked massive sell-offs on stock exchanges and foreign exchange markets around the world, including in Indonesia. In the fourth quarter the disruption in the global economy fi nally hit Indonesia’s real sector. General slowdowns were
felt in both the tradable and non-tradable sectors, although the quarterly data were distorted by strong seasonal effects. The robust annual growth of non-oil and gas exports over the last four years came to an abrupt end in the fourth quar-ter, but the same was true of imports. Thus, although the GFC and a weak rupiah are likely to have a negative impact on export-oriented and high import content industries in 2009, potential balance of payments pressures are more likely to originate in the capital account than in the current account.
With a growing expectation that the GFC’s impact would intensify, a wide range of fi scal, monetary, fi nance and trade policy packages were announced in
recent months. Financial sector safety net policies were given high priority ini-tially, with the primary aim of supporting the balance of payments rather than avoiding worker lay-offs. Subsequently, fi scal stimulus packages have been
intro-duced, expanded and modifi ed, and the offi cial stance of monetary policy has
become more expansionary. However, institutional shortcomings and political bottlenecks seem likely to constrain the effectiveness of these policies as a whole.
A YEAR OF ELECTIONS
Two sets of elections will be held in 2009. They will infl uence both the political
landscape and government efforts to deal with the global economic slowdown, which is expected to worsen during the year. Elections for the national parliament (DPR), the national-level Regional Representatives Council (DPD) and regional parliaments (DPRDs) at provincial and local government levels will be held on 9 April. The presidential election will follow on 8 July (table 1). Given the strong possibility that, as in 2004, no president–vice-president pairing will obtain more than 50% of fi rst-round votes, a second round will be held on 8 September and
the winning team inaugurated on 20 October. In total, around 44 political parties are competing for over 18,000 parliamentary seats at national and regional levels.1
Despite its length and complexity, another season of successful and peaceful elec-tions is expected (Fatah 2009), given that Indonesians are now experienced voters. Over 100 elections have been held annually on average during the last fi ve years,
with the average individual voting in seven or eight separate ballots.2
A number of changes in the election laws have been approved. First is the introduction of a ‘closed’ campaign period of about eight months, to precede the
1 This includes six local parties in Nanggroe Aceh Darussalam province, where the usual eligibility requirement for parties to have a wide national presence does not apply. 2 These include elections of parliaments at national, provincial and local government lev-els, and of government leaders ranging from the president to village heads.
TABLE 1 Election Timetable for 2009
Legislative elections
12 July 2008 – 5 April 2009 Campaign period, with open political rallies only in last three weeks
9 April Election of members
9 May Announcement of provisional results
15–24 May Dispute resolution and announcement of fi nal results
1 October Inauguration of DPD, DPR and DPRD members
Presidential elections (subject to issue of formal decree by Elections Commission) 10 May – 9 June Registration of candidate president–vice-president
pairings
1 June Announcement of candidate president–vice-president pairings
12 June – 5 July Campaign period for fi rst round
8 July First-round election
25 July Announcement of provisional results of fi rst round
26 July – 7 August Dispute resolution and announcement of pairings for second round
1–4 September Campaign period for second round
8 September Second-round election
25 September – 7 October Dispute resolution and announcement of fi nal results
20 October Inauguration of president and vice president
Sources: National Election Commission (Decree 20/2008); Koran Tempo, 28 January 2009.
three-week period in which open campaign rallies may be held (as in the 2004 DPR elections). This lengthy campaign period is proving a boon to advertising agencies, media production houses and television stations, with several politi-cal parties buying considerable television air time. The second change relates to parliamentary and electoral thresholds. Only those political parties securing at least 2.5% of the vote can gain a seat in the DPR, and president–vice-president candidate pairings can only be nominated by a political party or parties securing at least 20% of DPR seats or at least 25% of the vote, compared with only 3% of seats previously.
These new measures are expected to limit the number of political parties in the parliament and of president–vice-president candidate pairings: had the 2.5% DPR threshold been introduced in the 2004 election, there would have been eight parties in the parliament instead of 16 (Fatah 2008). The tighter requirement for president–vice-president candidate pairings is likely to constrain the emergence of newcomer candidates relying on the support of newly established parties. It may also force President Susilo Bambang Yudhoyono and his Democrat Party to be more accommodative in securing the support of other political parties (espe-cially the Golkar Party) in order to surpass the 20% electoral threshold. On the other hand, if the Democrat Party can exceed this threshold, the president will be freer than in 2004 to choose his own vice-presidential running mate, though he will still need to concern himself with maintaining majority support in the DPR.
In the 2004 DPR elections, members gained seats based on their party’s internal candidate ranking rather than the number of votes they received, although can-didates could circumvent the party ranking if they reached a full electoral quota. Article 214 of Law 10/2008, which governs procedures for electing DPR members, lowered that threshold to just 30% of an electoral quota, but the Constitutional Court annulled this stipulation in December 2008. The process is now much more transparent, such that seats won by each party are allocated in accordance with the number of votes obtained by its candidates. There has been some resentment of this decision, particularly because it reduces the opportunity for political parties to secure DPR seats for their preferred cadres and to implement affi rmative action to
increase the number of female members. On the other hand, many expect the new ruling to encourage more active campaigning and more explicit policy platforms.
MACROECONOMIC OVERVIEW
The economy maintained moderately high growth in 2008. However, by the fourth quarter (Q4) the rapidly accelerating downturn in important trading partner coun-tries (particularly the US, Europe and Japan) and turmoil in global fi nancial
mar-kets were beginning to have an impact. This became apparent with a rapid decline in prices on the Indonesia Stock Exchange, followed by signifi cant disturbances in
the bond and foreign exchange markets. But the negative impact on the real sector remained surprisingly mild until Q4. The most obvious explanations for this are that Indonesia’s economy is less tied to world markets through inter national trade than those of some other Asian countries, and that the fi nancial sector remained in
fairly good shape after all the major banks were recapitalised in the late 1990s. The suddenness of the plunge into recession of some major world economies leaves no room for complacency, however. The authorities have moved quickly to
introduce policy responses designed to offset rapidly falling export demand and prevent collapse of the fi nancial system. But seemingly straightforward textbook
prescriptions for dealing with an unexpected decline in aggregate demand turn out to be not at all straightforward in reality. In Indonesia, as elsewhere, few policy responses are uncontroversial or unambiguously correct.
It is widely agreed that policy should try to stimulate aggregate demand in order to offset the sudden and probably continuing fall in demand for Indonesia’s exports. Beyond that, opinions differ as to the relative effi cacy of fi scal and monetary stimuli
and, on the fi scal side, of additional government spending compared with tax
reduc-tions and transfers intended to boost private sector spending. The offi cial responses
so far suggest that the government is concerned to minimise not only the job losses and wage cuts that would result from declines in aggregate demand, but also any loss of inter national reserves or depreciation of the rupiah. It is by no means clear whether this second set of objectives is achievable or even makes good sense.
Assuming the government resists the temptation to strengthen controls on capital outfl ow or to impose additional barriers to imports, further reductions in
international reserves seem inevitable, as does further depreciation. More over, depreciation would provide a boost to the producers of tradable goods and serv-ices, which is precisely what the government seeks to achieve through fi scal
stim-ulus measures. Indeed, a fl exible exchange rate acts as an automatic stabilising
mechanism in response to declining export demand. In any case, the balance of payments impact of falling export demand should not be over-stated. Indonesia’s exports have a high import content, so it is not surprising that declining export growth has been roughly matched by declining growth of imports. Providing high infl ation can be avoided, therefore, it is by no means obvious that there will
be major disturbance to the balance of payments from the current account. The outlook for the fi nancial sector is less clear. Both the stock market and the
bond market have suffered severe declines in recent months. And although the offi cial data suggest that the banks are in good shape, market participants appear
to have serious reservations about the accuracy of these numbers. There are reports that smaller domestic banks and even some foreign banks are now fi nding
it diffi cult to borrow in the inter-bank market—a sure sign of concern about their
solvency. The authorities have responded to this by substantially reducing the minimum reserve requirement (thereby boosting liquidity) and by greatly increas-ing the size of guaranteed bank deposits (thereby reducincreas-ing the likelihood of a run on the banks). Even so, the guarantee does not cover deposits above Rp 2 billion, which, although small in number, account for a large proportion of total deposits. It is precisely these large deposits that can be expected to be extremely sensitive to changing risk perceptions, so a run on the banks cannot be ruled out.
An unresolved policy issue is whether to extend the guarantee to cover all deposits and, if not, how to handle a bank run should it eventuate. Policy mak-ers are mindful of the huge losses the general public incurred as a result of the blanket guarantee introduced in January 1998, and are understandably reluctant to go down this road again. Nonetheless, they are conscious that blanket guaran-tees have been introduced in other countries—including some of Indonesia’s near neighbours—which increases the likelihood of a run. Related to this is the choice of response to potential further bursts of capital fl ight: ‘defend the currency’ by
selling off international reserves; leave it to market forces to determine a new
value for the rupiah; or impose controls on capital fl ows and barriers to imports.
At the same time, choices need to be made about monetary policy. If the policy stance is expansionary (because of the perceived need to encourage private sector spending), liquidity may be used instead to fi nance purchases of foreign assets,
resulting in even further declines in reserves or depreciation of the currency.
Growth
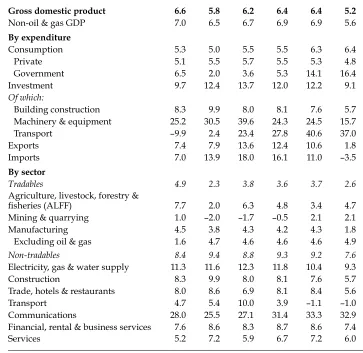
Given the severity of the global slowdown, the year-on-year growth rate of quar-terly GDP remained remarkably strong in the last two quarters of 2008 (table 2A). The economy expanded at an average rate of 5.8% p.a. in the second half, putting Indonesia among the fastest-growing emerging market economies in Asia. Signs
TABLE 2A Components of GDP Growth (2000 prices; % year on year)
Sep-07 Dec-07 Mar-08 Jun-08 Sep-08 Dec-08
Gross domestic product 6.6 5.8 6.2 6.4 6.4 5.2
Non-oil & gas GDP 7.0 6.5 6.7 6.9 6.9 5.6
By expenditure
Consumption 5.3 5.0 5.5 5.5 6.3 6.4
Private 5.1 5.5 5.7 5.5 5.3 4.8
Government 6.5 2.0 3.6 5.3 14.1 16.4
Investment 9.7 12.4 13.7 12.0 12.2 9.1
Of which:
Building construction 8.3 9.9 8.0 8.1 7.6 5.7
Machinery & equipment 25.2 30.5 39.6 24.3 24.5 15.7
Transport –9.9 2.4 23.4 27.8 40.6 37.0
Exports 7.4 7.9 13.6 12.4 10.6 1.8
Imports 7.0 13.9 18.0 16.1 11.0 –3.5
By sector
Tradables 4.9 2.3 3.8 3.6 3.7 2.6
Agriculture, livestock, forestry &
fi sheries (ALFF) 7.7 2.0 6.3 4.8 3.4 4.7
Mining & quarrying 1.0 –2.0 –1.7 –0.5 2.1 2.1
Manufacturing 4.5 3.8 4.3 4.2 4.3 1.8
Excluding oil & gas 1.6 4.7 4.6 4.6 4.6 4.9
Non-tradables 8.4 9.4 8.8 9.3 9.2 7.6
Electricity, gas & water supply 11.3 11.6 12.3 11.8 10.4 9.3
Construction 8.3 9.9 8.0 8.1 7.6 5.7
Trade, hotels & restaurants 8.0 8.6 6.9 8.1 8.4 5.6
Transport 4.7 5.4 10.0 3.9 –1.1 –1.0
Communications 28.0 25.5 27.1 31.4 33.3 32.9
Financial, rental & business services 7.6 8.6 8.3 8.7 8.6 7.4
Services 5.2 7.2 5.9 6.7 7.2 6.0
Source: CEIC Asia Database.
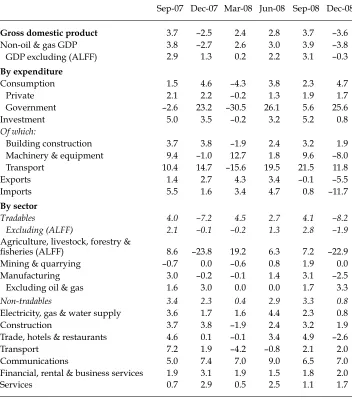
of an economic slowdown emerged in the last quarter, however, when output declined by 3.6% (3.8% if the oil and gas sectors are excluded) (table 2B). Exports fell in the face of accelerating downturns in key trading partner economies and a worsening of the terms of trade owing to rapidly declining prices of key com-modities in world markets. But the contraction of exports was more than offset by a much larger contraction in imports, implying a positive impact of net exports on GDP. Investment spending grew very modestly in Q4, but its deceleration was more than offset by a huge jump in government consumption. This fortuitous out-come refl ects a well-established pattern in which ineffi cient budgetary processes
TABLE 2B Components of GDP Growth (2000 prices; % quarter on quarter)
Sep-07 Dec-07 Mar-08 Jun-08 Sep-08 Dec-08
Gross domestic product 3.7 –2.5 2.4 2.8 3.7 –3.6
Non-oil & gas GDP 3.8 –2.7 2.6 3.0 3.9 –3.8
GDP excluding (ALFF) 2.9 1.3 0.2 2.2 3.1 –0.3
By expenditure
Consumption 1.5 4.6 –4.3 3.8 2.3 4.7
Private 2.1 2.2 –0.2 1.3 1.9 1.7
Government –2.6 23.2 –30.5 26.1 5.6 25.6
Investment 5.0 3.5 –0.2 3.2 5.2 0.8
Of which:
Building construction 3.7 3.8 –1.9 2.4 3.2 1.9
Machinery & equipment 9.4 –1.0 12.7 1.8 9.6 –8.0
Transport 10.4 14.7 –15.6 19.5 21.5 11.8
Exports 1.4 2.7 4.3 3.4 –0.1 –5.5
Imports 5.5 1.6 3.4 4.7 0.8 –11.7
By sector
Tradables 4.0 –7.2 4.5 2.7 4.1 –8.2
Excluding (ALFF) 2.1 –0.1 –0.2 1.3 2.8 –1.9 Agriculture, livestock, forestry &
fi sheries (ALFF) 8.6 –23.8 19.2 6.3 7.2 –22.9
Mining & quarrying –0.7 0.0 –0.6 0.8 1.9 0.0
Manufacturing 3.0 –0.2 –0.1 1.4 3.1 –2.5
Excluding oil & gas 1.6 3.0 0.0 0.0 1.7 3.3
Non-tradables 3.4 2.3 0.4 2.9 3.3 0.8
Electricity, gas & water supply 3.6 1.7 1.6 4.4 2.3 0.8
Construction 3.7 3.8 –1.9 2.4 3.2 1.9
Trade, hotels & restaurants 4.6 0.1 –0.1 3.4 4.9 –2.6
Transport 7.2 1.9 –4.2 –0.8 2.1 2.0
Communications 5.0 7.4 7.0 9.0 6.5 7.0
Financial, rental & business services 1.9 3.1 1.9 1.5 1.8 2.0
Services 0.7 2.9 0.5 2.5 1.1 1.7
Source: As for table 2A.
in government departments and agencies prevent budgeted spending from get-ting under way early in the year.
The non-tradables sector continued to out-perform tradables in the second half of 2008, as it has for several years now—maintaining modest positive growth in Q4 in the face of a large (8.2%) decline in tradables output (table 2B). The latter is largely explained by the very high degree of seasonality in the agriculture, live-stock, forestry and fi sheries (ALFF) sector, which contracted by about 23% quarter
on quarter in Q4—just as it did in 2007. Indeed, the apparently disappointing result for output growth in the December quarter seems overwhelmingly to be driven by this sector: GDP net of ALFF declined by just 0.3%. The mining and quarry-ing sector continued its disappointquarry-ing performance, refl ecting the government’s
inability to provide a satisfactory legal basis for mining activity.3 Surprisingly,
the performance of non-oil and gas manufacturing improved towards the end of 2008: the decline in manufacturing output in Q4 was entirely the consequence of a drop in oil and gas manufacturing. That said, outcomes for the sub-sectors of non-oil and gas manufacturing varied considerably. Of particular concern is that labour-intensive industries—especially the textiles, leather products and footwear group—continued their poor performance of recent years, experiencing a second full year of contraction, including a large decline in Q4 2008. Within the non-tradables sector, communications continued to stand out, with remarkably rapid year-on-year growth throughout 2008—in contrast to notable deceleration in several other sub-sectors. Persistent, intense price wars among mobile commu-nication service providers led to signifi cant increases in demand for mobile phone
voice and messaging services.
Budget outcome
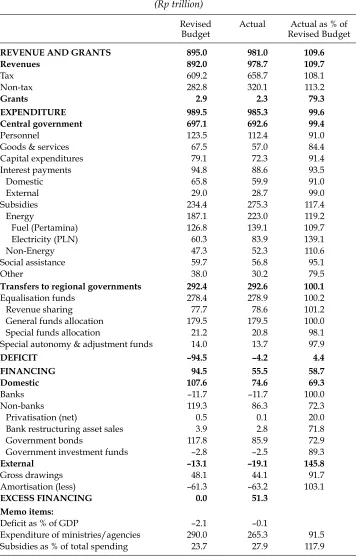
The realised budget outcome for 2008 recorded a negligibly small defi cit of around
0.1% of GDP, far lower than the initially projected 2.1%, because revenues were about 10% higher than in the revised budget announced in April 2008 (table 3). Presumably the 8.1% increase in tax revenues refl ects the signifi cant bureaucratic
reform being undertaken in the fi nance ministry, the ‘sunset policy’ (which
elimi-nated penalties for unsubmitted, late or incorrect tax returns for previous years) and the drive to encourage individuals to obtain taxpayer registration numbers (and thus avoid paying tax at a higher rate from 2009).4 The 13.2% increase in
non-tax revenues is due mainly to much higher than expected average world oil prices in 2008.
Whereas total expenditure came in almost right on target, spending by min-istries and government agencies fell short of the budgeted amount by 8.5%, or around Rp 25 trillion. Surprisingly, spending on personnel was 9% less than budgeted, but there were also signifi cant shortfalls in spending on goods and
services, capital items, social assistance and ‘other‘ items. There was a substantial
3 Investors have been waiting for years for the enactment of a new mining bill. Although this was at last approved by the DPR in December 2008, the implementing regulations are not yet ready.
4 Employees without taxpayer registration numbers are now subject to a withholding tax on their salaries 20% higher than the income tax rate that would otherwise apply, and to much higher fi skal withholding taxes if they go overseas.
TABLE 3 Planned and Actual Budget for 2008
REVENUE AND GRANTS 895.0 981.0 109.6
Revenues 892.0 978.7 109.7
Goods & services 67.5 57.0 84.4
Capital expenditures 79.1 72.3 91.4
Interest payments 94.8 88.6 93.5
Domestic 65.8 59.9 91.0
External 29.0 28.7 99.0
Subsidies 234.4 275.3 117.4
Energy 187.1 223.0 119.2
Fuel (Pertamina) 126.8 139.1 109.7
Electricity (PLN) 60.3 83.9 139.1
Non-Energy 47.3 52.3 110.6
Social assistance 59.7 56.8 95.1
Other 38.0 30.2 79.5
Transfers to regional governments 292.4 292.6 100.1
Equalisation funds 278.4 278.9 100.2
Revenue sharing 77.7 78.6 101.2
General funds allocation 179.5 179.5 100.0
Special funds allocation 21.2 20.8 98.1
Special autonomy & adjustment funds 14.0 13.7 97.9
DEFICIT –94.5 –4.2 4.4
FINANCING 94.5 55.5 58.7
Domestic 107.6 74.6 69.3
Banks –11.7 –11.7 100.0
Non-banks 119.3 86.3 72.3
Privatisation (net) 0.5 0.1 20.0
Bank restructuring asset sales 3.9 2.8 71.8
Government bonds 117.8 85.9 72.9
Government investment funds –2.8 –2.5 89.3
External –13.1 –19.1 145.8
Expenditure of ministries/agencies 290.0 265.3 91.5
Subsidies as % of total spending 23.7 27.9 117.9
Source: Offi ce of the Coordinating Minister for Economic Affairs (2009).
saving on interest payments on the government’s domestic borrowing, not least because the net amount of bonds issued was far lower than expected. On the other hand, outlays on subsidies were 17% higher than budgeted, mainly because of the dramatic increase in the world oil price early in the year and the government’s considerable reluctance to adjust the domestic prices of fuels and electricity com-mensurately. Subsidies accounted for well over a quarter of total spending; in particular, subsidies to electricity consumption were almost 40% higher than the budgeted amount. Although offi cial kerosene prices were held far below
equiva-lent world prices, the government kept the total subsidy to kerosene much smaller than this implies by limiting availability (box 1).
The higher than expected revenues averted the need for the government to confront much tighter conditions in the global fi nancial market, which would
have increased signifi cantly its cost of borrowing internationally—or even limited
its capacity to do so. It was able to cease issuing bonds early in Q4, and ran down its outstanding foreign borrowings by the equivalent of Rp 19 trillion during the year. In the event, the total amount of fi nancing obtained was more than 60%
below the planned amount, notwithstanding some Rp 28 trillion of bilateral and multilateral external loans disbursed in December. Despite this, the very small realised defi cit of Rp 4.2 trillion left the government with a surplus cash fl ow for
the year of around Rp 51.3 trillion.
Manufacturing sector: the threat of job losses
The threat posed by the GFC prompted the Ministry of Industry to revise its fore-cast for growth in non-oil and gas manufacturing sector output in 2008 slightly downward, from 5% to 4.8%; the fi nal outcome fell between these two numbers.
The forecast for 2009 is considerably lower, at 3.6%. To get a better sense of the BOX 1 FUELSUBSIDIES: SMOKEANDMIRRORS
One of the dangers of holding fuel prices low is that it encourages additional consumption, implying an even higher total amount of subsidy. In response to this, the government’s policy has been to control quantities as well as con-sumption. To this end, the subsidy it pays to the state-owned oil company, Pertamina, to distribute fuels at prices below equivalent export prices is based on fi xed quantities (‘quotas’) determined before the beginning of the year,
multiplied by a per unit fee (‘alpha’) that depends on the forecast world price of oil. Of course, the price actually paid by consumers depends on supply to the market. In the case of gasoline and diesel, most of which is sold at the retail level by Pertamina itself, the quantities supplied appear roughly to match demand at the subsidised prices. But most kerosene is sold ‘on the street’ and in markets by very small traders, and the actual retail price recently has been far above the nominal subsidised price because the amount supplied in total is far lower than the level of demand at this price. In turn, this is because the government wants to encourage households to convert from using kerosene to using liquefi ed petroleum gas (LPG). Rather than suffer the odium that would
attend the announcement of a big price increase for kerosene, the government has chosen to achieve the same practical result by restricting the supply.
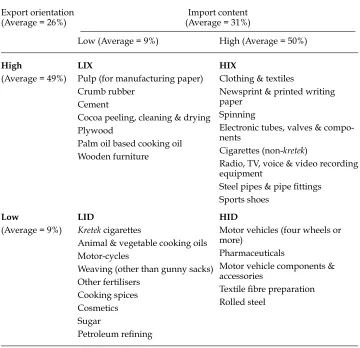
likely sectoral pattern of the GFC’s impact on manufacturing we begin by cal-culating two indicators: namely, the import content (imports as a share of total material inputs) and market orientation (domestic or export) of Indonesia’s man-ufacturing industries, based on the recently published 2006 Industrial Statistics (BPS 2008).5 We then classify large and medium-scale manufacturing into four
major categories (table 4): low import content and export oriented (LIX); low import content and domestic oriented (LID); high import content and export ori-ented (HIX); and high import content and domestic oriori-ented (HID), where the
5 Our analysis is restricted to the larger fi rms (ranked by value added) that together
account for 80% of total value added.
TABLE 4 Major Manufacturing Industries’ Exposure to Global Tradea
Export orientation (Average = 26%)
Import content (Average = 31%)
Low (Average = 9%) High (Average = 50%)
High
Radio, TV, voice & video recording equipment
Motor vehicles (four wheels or more)
Pharmaceuticals
Motor vehicle components & accessories
Textile fi bre preparation
Rolled steel
a The top 29 industries by value added are listed.
LIX: low import content and export oriented; LID: low import content and domestic oriented; HIX: high import content and export oriented; HID: high import content and domestic oriented. Demarcations between ‘high’ and ‘low’ are the relevant average values.
Sources: BPS (2008) and authors’ calculations.
demarcations between ‘high’ and ‘low’ are the relevant average values. Given recent and expected declines in global demand and the likelihood of a continu-ing weak rupiah, the severity of the GFC’s impact on Indonesia’s manufacturcontinu-ing industries is likely to depend on which of these four categories they belong to.
The adverse impact of the GFC will be stronger for industries in the LIX and HIX categories because of their strong export orientation. Although these indus-tries would benefi t from a weakening rupiah, the sharp decline in demand from
major trading partners is likely to be the more dominant force. Industries in these categories contributed around 38% of manufacturing value added, and employed around 39% of the manufacturing sector labour force. They include industries such as pulp (for paper manufacture); crumb rubber; cement; palm oil based cook-ing oil; wooden furniture; plywood; clothcook-ing and textiles; newsprint and printed writing paper; electronics; steel pipes; and sports shoes. For example, 40–50% of the output of the clothing, textiles and footwear industries was exported in 2006. Industries relying on locally produced raw materials also depend heavily on external demand. Close to 80% of the output of the rubber industry was destined for the export market, for example, together with over half the output of the pulp and paper and plywood industries.
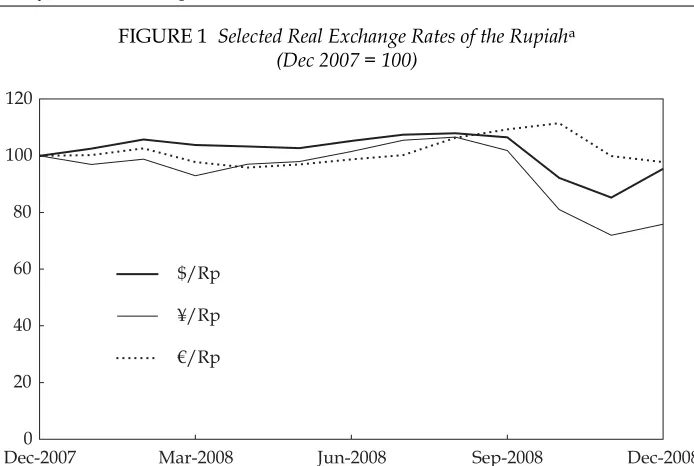
The last quarter of 2008 saw the rupiah depreciate in real terms against major trading partners’ currencies, notwithstanding some recovery in Decem-ber (fi gure 1). We expect the nominal rupiah to remain weak and infl ationary
pressure to moderate in 2009, preventing any signifi cant real appreciation this
year. If the real exchange rate remains weak, then the HID industries, which con-tribute about 25% of value added and 19% of employment, will also bear the adverse consequences of the GFC, since rupiah weakness will drive up the pro-duction costs of these industries, making their products less affordable. Two of a A decrease in the index implies a real depreciation.
Source: CEIC Asia Database.
FIGURE 1 Selected Real Exchange Rates of the Rupiaha (Dec 2007 = 100)
Dec-20070 Mar-2008 Jun-2008 Sep-2008 Dec-2008
20 40 60 80 100 120
$/Rp
¥/Rp
€/Rp
Dec-20040 Dec-2005 Dec-2006 Dec-2007 Dec-2008 2
4 6 8 10 12
Exports
Imports
Export trend
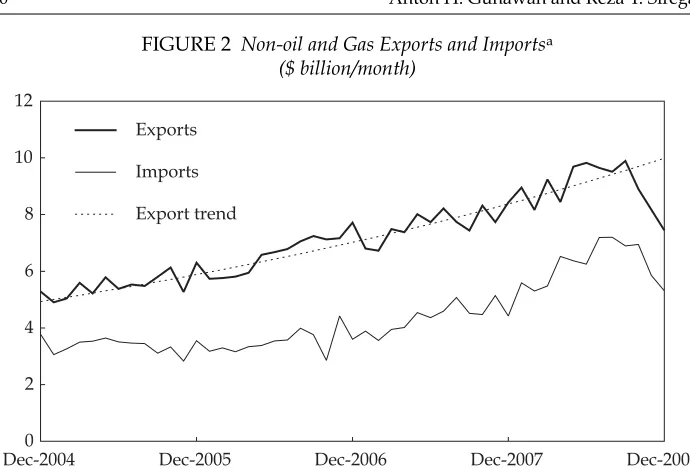
a The trend rate of growth for non-oil and gas exports for the period December 2004 through Septem-ber 2008 was 19.1% p.a. Imports shown here are those from outside the bonded economic zones.
Source: CEIC Asia Database.
FIGURE 2 Non-oil and Gas Exports and Importsa ($ billion/month)
the industries in question are motor vehicles (four wheels or more), and motor vehicle components and accessories.
The expected further slowdown of manufacturing output has prompted con-cern over likely job losses. The Indonesian Rattan Furniture and Craft Producers Association (AMKRI) estimated that this industry would have to lay off some 35,000 workers by the end of 2008, while some 700 textile fi rms had already
‘tem-porarily’ dismissed a total of 14,000 workers by mid-December (Adamrah 2008). Business leaders expect that up to 1.5 million people could be laid off in 2009, par-ticularly from labour-intensive industries, as fi rms cut back on production
(Kris-mantari 2008)—although the basis for such estimates is unclear. An additional concern is job losses and repatriation of Indonesian workers overseas, as the GFC slows economies elsewhere.
Balance of payments
Confi rming the picture suggested by the latest national income accounts data,
trade data for Q4 of 2008 show signifi cant disruption to Indonesia’s merchandise
trade performance as the GFC deepened (fi gure 2). In addition to the decline in
the terms of trade as commodity prices fell,6 economic downturns in key export
destinations had a strong negative impact. The very healthy 19.1% trend rate of annual growth in non-oil and gas exports established over the previous four years came to an abrupt end, with the value for December 2008 some 25% below
6 For example, the price of crude palm oil increased by over 40% during the fi rst two
months of 2008 to $1,315 per tonne, before plummeting to just $386 in late October 2008. Exports of palm oil account for around 9% of total exports.
March0 May July September November January 20
40 60 80 100 120
Government bonds
SBIs
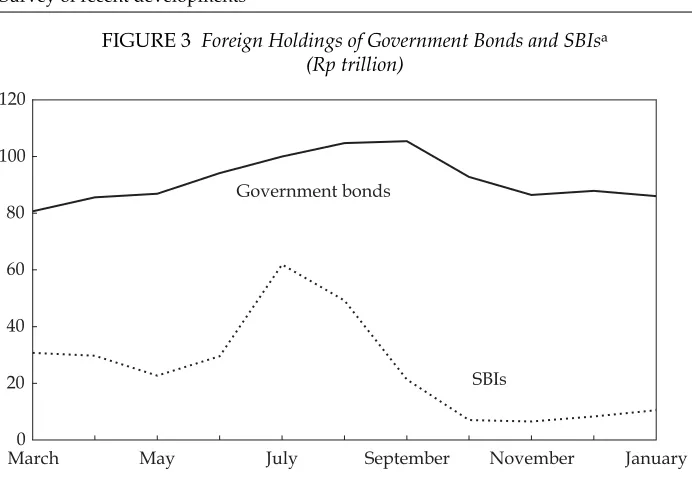
a SBI = Bank Indonesia Certifi cate.
Sources: Bond data: Ministry of Finance <http://www.dmo.or.id/>; SBI data kindly supplied by Bank Indonesia.
FIGURE 3 Foreign Holdings of Government Bonds and SBIsa (Rp trillion)
the corresponding trend value. Although this triggered market concern about the strength of the balance of payments, its impact on the current account defi cit
has been relatively slight. Indonesia’s imports tend to move hand in hand with exports because of the high import content of the latter. In particular, manufactured exports (which comprise over 80% of the total) such as electronics, clothing, tex-tiles, footwear and cigarettes have import content levels of 35–85%.
The values of oil and gas exports and imports during 2008 and early 2009 were dominated by the unprecedented surge and subsequent decline in world oil prices. The price of light sweet crude oil at the New York Mercantile Exchange had risen to around $99 per barrel in early January 2008. It went on to peak at around $145 in July, only to fall to $34 by December. Again, the impact on the current account was relatively slight, however, because Indonesia imports roughly the same value of oil and gas products as it exports.
In this era of highly mobile capital, potential balance of payments pressures are more likely to come from the capital account than the current account. One indication of this is the massive sell-off by foreign investors of government bonds and Bank Indonesia Certifi cates (SBIs) that occurred in the second half of
2008 (fi gure 3). At the end of July foreign investors held Rp 162 trillion in these
government and central bank securities combined, but this had fallen to only Rp 97 trillion January—a decline equivalent to about $6 billion.7 By comparison,
net merchandise exports actually grew by over $1 billion in Q4. Managing capital
fl ows will be a critical aspect of economic policy making in 2009.
7 It is possible that other domestic assets were substituted for these securities, but it seems more likely that a large part of the funds generated by this divestment was repatriated.
FINANCIAL SECTOR
Capital, bond and foreign exchange markets
The meltdown in major fi nancial markets in the US and Europe fi nally triggered
a massive sell-out on the Indonesia Stock Exchange (IDX) early in the last quarter of 2008, bringing the market index back to its level in the fi rst half of 2006. After
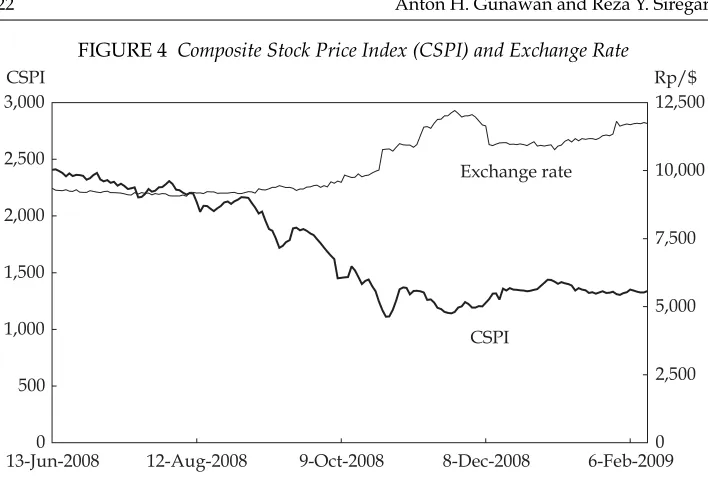
peaking at 2,830 in early January 2008, the Composite Stock Price Index (CSPI) came under heavy pressure in March, before recovering to a lower peak of 2,511 in May. Following this there was a period of steady decline until the beginning of September. However, the collapse of the globally renowned Lehman Brothers in the US sparked consecutive weeks of corrections in the global fi nancial markets in
September and October, triggering a fall of almost 50% in the CSPI during those months (fi gure 4).
This period was notable for the suspension of trading activities on the IDX from 9 to 13 October 2008, triggered by a 10% decline in the index on 8 October. This decline was in large part the consequence of uncertainty surrounding the fate of PT Bumi Resources, a company controlled by the family of the Coordinat-ing Minister for People’s Welfare, Aburizal Bakrie. With its ability to service and re-fi nance debt obligations of around $1.2 billion in September 2008 called into
question, PT Bakrie & Brothers—the fl agship holding company of the Bakrie
fam-ily—was forced to sell many of its shares in various companies, including Bumi Resources, one of the world’s largest thermal coal exporters. There was concern over the lack of transparency in share transactions involving Bumi Resources and these other companies, including the possibility that the government might be misusing state-owned enterprises to help out the Bakrie group. There were also strong rumours of a rift between the president and the fi nance minister over the
suspension of trading in shares of Bumi Resources. The minister had called an end to the suspension on 5 November, but the IDX then announced that ‘after
13-Jun-20080 12-Aug-2008 9-Oct-2008 8-Dec-2008 6-Feb-2009 500
1,000 1,500 2,000 2,500 3,000
0 2,500 5,000 7,500 10,000 12,500
CSPI Exchange rate
CSPI Rp/$
Sources: Indonesia Stock Exchange; Pacifi c Exchange Rate Service.
FIGURE 4 Composite Stock Price Index (CSPI) and Exchange Rate
considering a request from the government, the Exchange decided to delay lifting the suspension until further notice’ (Wei 2008). Bakrie & Brothers stood to ben-efi t from continued suspension, which would prevent further falls in the share
price of Bumi Resources and other companies controlled by the group—falls that would have made it much more diffi cult for the group to obtain the new equity fi nancing needed in order to reduce its high gearing ratios.
The 50% decline in IDX share prices translates to a corresponding 50% reduction in market capitalisation, equivalent to nearly 20% of Indonesia’s 2008 GDP. Share price declines were felt in all major sectors, with the commodity sectors among the worst affected. Large falls in the prices of key commodities such as crude oil, crude palm oil, rubber, coal and steel were mainly responsible. The prices of some of these commodities in global markets had fallen back to their 2007 levels by the end of 2008, although they remained high relative to previous years—especially those of the energy commodities. It would appear that large declines in commod-ity prices, rather than the GFC, are mainly to blame for declining share prices in these industries. Agricultural stocks suffered a decline of almost 80% in market capitalisation for the full year, with over 85% of this loss occurring in the second half. Similarly, at its peak in early 2008, the market value of mining sector stocks was over Rp 400 trillion, but by the end of the year it was barely above Rp 100 tril-lion. Three other sectors—fi nancial services, manufacturing and construction—
have also been experiencing sharp downturns in demand that are likely to have signifi cant medium-term implications for the economy. These sectors collectively
accounted for about 65% of total IDX market capitalisation; on average, each lost at least 40% of its market value during 2008. Despite some recovery of stock prices in December and early January, the stock exchange remained fragile through to mid-February. Given the relatively weak outlook for the world economy—and, because of this, for the domestic economy—any substantial recovery in the IDX during the fi rst semester of 2009 seems unlikely.
The government bond market also witnessed considerable volatility during the fourth quarter of 2008, as global risk aversion resulted in a credit crunch in the industrial countries. Bond prices fell dramatically, such that the yield on 5-year rupiah-denominated government bonds shot up to a peak of 22.2% on 28 Octo-ber. Yields then fl uctuated wildly during November before falling back quickly
to 12.2% by the end of the year on expectations of declining infl ation and
inter-est rates. Rising bond prices early in 2009 mainly refl ected increasing demand
by domestic players, especially banks, while foreign investors remained on the sidelines.
Investors’ attempts to reduce their exposure to both private sector shares and government paper in Indonesia resulted in signifi cant capital outfl ow and,
even-tually, in considerable depreciation of the rupiah. The currency came under pres-sure from about August, to which the central bank responded initially by running down its international reserves by about $10 billion—some $6.5 billion in October alone. But after the exchange rate was pushed beyond Rp 10,000/$ toward the end of October despite this intervention, Bank Indonesia (BI) chose to allow the market to determine a new level, and the rate went to well over Rp 12,000/$ within a month (fi gure 4). The strong recovery evident in December was not sustained,
and the rate had moved back to beyond Rp 11,700/$ by mid-February 2009, fol-lowing the recent strengthening of the US dollar against other currencies.
Banking
At a time when several of the world’s largest and most respected fi nancial
insti-tutions have had to be closed down or recapitalised by national governments, it is important to assess the health of Indonesia’s banking sector, even though it has had little direct exposure to the global sub-prime lending phenomenon. Despite the sharp global economic downturn, signifi cant declines in asset values (in
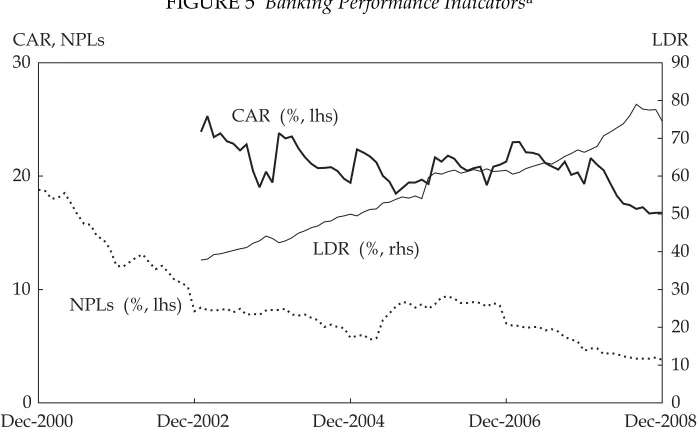
par-ticular, of stocks, bonds and the rupiah) and substantial increases in interest rates since March 2008 (particularly in the second half of the year), the banking sec-tor still appears on the surface to be in surprisingly good shape (fi gure 5). The
average capital adequacy ratio (CAR, the ratio of capital to risk-weighted assets) ended the year at 16.8%—over twice the regulatory minimum of 8.0%—while average non-performing loans (NPLs) continued their long-established down-ward trend, falling to 3.2% of total loans in December. The doubling of the aver-age loans-to-deposits ratio (LDR) over the last several years is explained by the declining relative importance of recapitalisation bonds (injected by the govern-ment as new equity following the 1990s crisis) as the banks expanded their loan portfolios
It is important, however, to treat these bank data with a degree of scepticism. For example, while the average CAR seems very healthy, there was a decline dur-ing 2008 of more than 4 percentage points from the average of about 21% that had been maintained from mid-2003. The decline in the average CAR during 2008 has at least two explanations: fi rst, the switch from SBIs (safe assets) to loans (riskier
assets) in that year, resulting in higher risk-weighted assets in the denominator of the CAR; and second, reductions in banks’ capital because they were required
Dec-20000 Dec-2002 Dec-2004 Dec-2006 Dec-2008
10 20 30
0 10 20 30 40 50 60 70 80 90
LDR (%, rhs) CAR (%, lhs)
NPLs (%, lhs)
CAR, NPLs LDR
a CAR = capital adequacy ratio; NPLs = non-performing loans as a share of total loans; LDR = loans-to-deposits ratio.
Source: CEIC Asia Database.
FIGURE 5 Banking Performance Indicatorsa
to ‘mark to market’ the value of bonds held in their trading portfolios when the prices of those bonds fell. In addition, it may be unwise to accept the NPL data at face value. In practice, banks have considerable discretion in classifying loans as non-performing—and are usually reluctant to do so. The steady decline in this measure may simply refl ect the diminishing relative importance of bad loans left
over from the 1997–98 crisis. A very large proportion of these had been classifi ed
as non-performing as part of the recapitalisation process at that time—because larger NPLs generated bigger capital injections by the government. Banks may have been reluctant subsequently to make realistic provisions against losses on newer loans; if so, this would imply commensurate over-statement of capital adequacy. It is important to appreciate that many highly reputed banks in the advanced economies failed abysmally to maintain adequate provisions against unexpected losses; it would be foolhardy to assume that this could not also hap-pen in Indonesia.
Market players, of course, take published balance sheet data at face value at their peril. They are much more likely to be guided by ‘market intelligence’— which may amount to little more than speculation and rumours. Bad news trav-els fast, usually making its presence felt initially in the inter-bank market rather than in formal reports to the supervisory authorities. Banks that fi nd themselves
under a cloud face rapidly increasing borrowing costs, eventually being unable to borrow at all if they cannot dispel negative rumours. Indeed, one such case has already resulted in the take-over of a small bank, Bank Century, by the Indonesia Deposit Insurance Corporation (Lembaga Penjamin Simpanan, LPS).
There had been doubts for some years about Bank Century, and in 2005 BI had required its owner to put some funds in an escrow account as a guarantee because of concerns about the quality of some of its assets. By the time the authorities realised it was having diffi culty obtaining inter-bank loans, Bank Century had
already lost a signifi cant proportion of its deposits. Its seemingly healthy
capi-tal adequacy ratio of 18% at the end of September 2008 fell abruptly to –2.3% in early November. Two weeks after Bank Century’s take-over by the authorities, the Capital Market and Financial Institutions Supervisory Agency, Bapepam–LK, received complaints of payment defaults from investors in a closely affi liated
securities company, PT Antaboga Delta Sekuritas Indonesia. Using Bank Century as its selling agent, Antaboga claimed to be operating a mutual fund, although Bapepam–LK has denied issuing it with a permit to do so. Investors who had naïvely put their savings with Antaboga in response to alleged promises of high returns eventually faced the prospect of being unable to retrieve even their initial investments (JP, 12/9/2008). The Antaboga–Century case demonstrates the dan-ger of relying too heavily on published balance sheet data, and on banking and capital market regulators.
Banks’ declining confi dence in each other is refl ected in the shrinking
vol-ume of inter-bank borrowing and lending transactions—down by almost 60% to Rp 84 trillion in December 2008 from Rp 206 trillion in December 2007 (Guna-wan, Arman and Hendranata 2009). Declining confi dence can also be seen among
depositors. There is some evidence of a ‘fl ight to quality’—depositors shifting
their savings to the larger private banks and state banks (although not to foreign banks as in the 1997–98 crisis), exacerbating the liquidity imbalance and segmen-tation of the banking system.
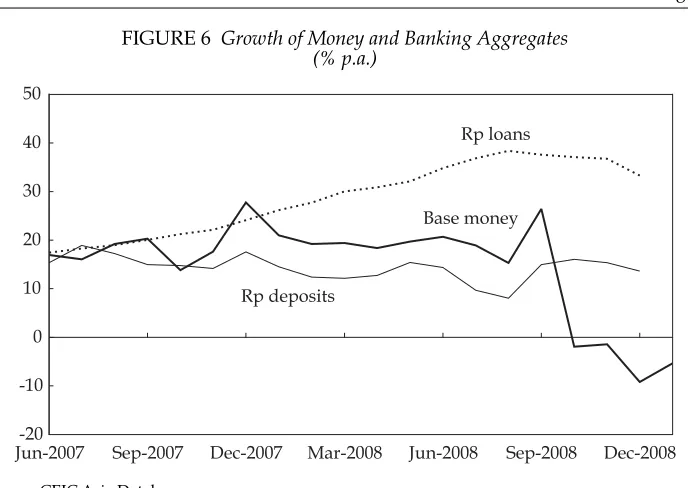
In mid-2007, rupiah-denominated loans and deposits had been growing by a little under 20% annually, as had base money (fi gure 6). Base money and lending
growth then accelerated until early 2008, at which stage the former levelled off at about 20%, while lending continued to accelerate, fi nally peaking at 38% in
August. In contrast, the growth of deposits had declined throughout this period to a low of 8%. With system liquidity declining relative to bank lending, and with BI reluctant to allow yields on SBIs to increase, the banks began to replace their holdings of SBIs with loans to the private sector from January; by August, banks’ SBIs had fallen by almost two-thirds. As their holdings of SBIs fell towards zero, some banks began to compete more strongly for deposits. Deposit rates began to edge upwards from mid-year, and then to increase very rapidly in September and October: interest rates offered by some banks for large deposits (of the order of, say, Rp 1 billion) were as high as 16% by December.8 Lending rates followed
a similar pattern, despite the fact that BI’s policy rate peaked at around this time and then began to fall. As the GFC began to bite more strongly in December, the banks started to cut back on new lending (by 1.3% month-on-month), using the additional liquidity from accelerated government spending and a cut in the minimum reserves requirement (discussed below) to rebuild their investment in SBIs—holdings of which doubled by the end of the year—and government bonds.
8 The sudden contraction of base money in October 2008 mainly refl ects the reduction in
the minimum reserve requirement. Although this freed up liquidity, adding to the impact of accelerated government spending, these effects were offset by issues of SBIs and sales of foreign exchange by BI.
Jun-2007-20 Sep-2007 Dec-2007 Mar-2008 Jun-2008 Sep-2008 Dec-2008 -10
0 10 20 30 40 50
Rp loans
Base money
Rp deposits
Source: CEIC Asia Database.
FIGURE 6 Growth of Money and Banking Aggregates (% p.a.)
POLICY RESPONSES
In his New Year press conference, President Susilo Bambang Yudhoyono pledged a fi scal stimulus to achieve several priority targets in 2009, and specifi cally to
minimise the impact of the GFC. The main objectives were to maintain economic growth at no less than 4.5% annually and minimise any increase in unemploy-ment; to protect those below the poverty line; to maintain food and energy
suf-fi ciency; and to bring infl ation down to the targeted range of 5–7%. To meet these
objectives, a number of response packages have been announced, including fi scal,
monetary and trade policies.
The government’s capacity to implement these packages remains to be seen, however. In their annual survey of governance, Kaufmann, Kraay and Mastruzzi (2008) provide the latest estimates of six indices of governance, one of which focuses on government effectiveness (GE). This encompasses the quality of public services; the quality of the civil service and the degree of its independence from political pressures; the quality of policy formulation and implementation; and the credibility of the government’s commitment to its stated policies. The index ranges from –2.5 (least effective) to 2.5 (most effective). In spite of a notable improvement since 2003, Indonesia’s GE index for 2007 remained clearly the lowest among those for the fi ve major ASEAN countries, much the same as for Vietnam, and
signifi cantly higher only than those for the newly emerging Southeast Asian
nations of Myanmar, Cambodia and Laos (fi gure 7).
Myanmar Cambodia Laos Vietnam
Indonesia
Philippines India China Thailand Brunei Taiwan Malaysia South Korea Japan Hong Kong Singapore
-2.5 -2.0 -1.5 -1.0 -0.5 0.0 0.5 1.0 1.5 2.0 2.5 2003
2007
Source: Kaufmann, Kraay and Mastruzzi (2008).
FIGURE 7 Effectiveness Index for Governments in Asia
Financial sector safety net policies
In October 2008, the administration introduced three government regulations in lieu of law (peraturan pemerintah pengganti undang-undang, Perpu) to protect the
fi nancial system from a potential crisis. The fi rst was Perpu 2/2008 to further
amend the Central Bank Law of 1999 so as to expand the range of types of collateral acceptable for gaining access to BI’s short-term lending and emergency fi nancing
facilities. The second was Perpu 3/2008 to expand the coverage of the LPS guar-antee of bank deposits from Rp 100 million to Rp 2 billion. The third was Perpu 4/2008, which would allow the government and the central bank jointly to inject emergency liquidity into fi nancial institutions—not just banks—in the event of a
potential systemic collapse, without fi rst obtaining approval of the DPR. In relation
to Perpu 4/2008, the fi nance minister stipulated three criteria that could indicate a
major problem in the fi nancial system: a shortage of bank liquidity; potential
insol-vencies among the banks; and signs of liquidity or solvency problems in non-bank
fi nancial institutions. The regulations could be implemented only if the liquidity
and solvency problems of fi nancial institutions were deemed to be ‘systemic’. A
‘systemic’ problem was defi ned as a condition requiring such intervention in order
to maintain confi dence in the fi nancial system and the national economy; this, in
turn, would be at the discretion of the government in consultation with BI. During a DPR hearing in December 2008, Commission XI (which deals with matters related to the fi nance sector) approved the fi rst of these two regulations,
but rejected the third on liquidity injections. Legislators from seven of the 10 par-ties represented on the commission opposed the regulation, voicing concern that it could be misused, and that the authority it conferred on BI would limit scope for public oversight of potential bail-outs of the fi nancial system. There was
par-ticular concern with a provision stating that the fi nance minister and the central
bank governor could not be prosecuted in relation to liquidity injections intended to prevent collapse of the fi nancial system. Both proponents and opponents of this
provision presumably had in mind the crisis of 1997–98, in which the authorities succeeded in preventing a collapse of the banking system only by virtue of mas-sive last-resort lending (BLBI) by the central bank, followed by the introduction of a blanket guarantee of bank liabilities by the government. Only a small proportion of the BLBI was repaid, and top offi cials of the central bank who had approved
it were subsequently accused of improper behaviour—a number of them ending up in prison—so it is not surprising that their successors would want to avoid a similar fate. On the other hand, these policies ended up costing the general public at least $50 billion (Frécaut 2004; McLeod 2004), so the legislators had good reason to insist that similar policy choices could not be taken too lightly in the future.
As in some other countries, the political bottleneck over the fi nancial
insti-tution bail-out regulation highlights the diffi culty of implementing appropriate
safety net policies rapidly at times of incipient severe economic downturn. Ide-ally these policies should be designed when conditions are normal rather than when crisis conditions are already emerging, but in normal conditions there is little interest in such matters. Evidently the law that established the LPS follow-ing the last crisis is now seen as inadequate for dealfollow-ing with a threatened sudden and unexpected loss of confi dence in the banking system—hence the move to
make borrowing from BI easier, and the dramatic expansion in coverage of the deposit guarantee.
Aside from the political diffi culties involved in responding to this threat,
how-ever, there are also a number of potential shortcomings in the fi nancial sector
safety net policies implemented so far. Perhaps most signifi cant is the possibility
that the Rp 2 billion maximum guarantee on bank deposits may not be effective in preventing a bank run. The government has emphasised that this guarantee will cover almost all depositors. Indeed it does, but in terms of the value of deposits, only around 54% of the total amount (as of December 2008) would be protected by the guarantee (table 5). Moreover, interest rates offered for large deposits are now signifi cantly higher than the latest maximum guarantee rate of 9.0% set by
the LPS; this also reduces the extent to which the deposit guarantee can be relied on to prevent bank runs.9 In our day-to-day discussions with market analysts,
private bankers and regional economists in Singapore, we found that there had already been outfl ows of deposits from Indonesia to Singapore, where all local
and foreign currency deposits of individuals (including foreign residents) and non-bank customers at banks and fi nance companies are fully guaranteed until
the end of 2010. Elsewhere in the region, Hong Kong and Malaysia have adopted similar measures. In these circumstances, Indonesia’s newly expanded guarantee alone cannot be relied upon to prevent a run on the banks.
In late October 2008, in an attempt to prevent a potentially massive exodus of domestic residents’ capital, BI introduced a new administrative control on foreign exchange transactions (BI Regulation 10/28/PBI/2008). This measure requires any entity wanting to purchase foreign currency exceeding the equivalent of $100,000 a month in either the spot or the forward market to provide a statement justify-ing the need for the transaction. The objective of the control was to minimise speculative transactions in the foreign exchange market. But the penalty for banks involved in such transactions if they fail to comply is merely an administrative
9 The guarantee applies only if the interest rate on deposits does not exceed the LPS guar-antee rate. This is to reduce moral hazard by preventing banks from offering excessively high deposit rates in order to fi nance very risky assets.
TABLE 5 Size Distribution of Customer Deposits (December 2008)
Size Range (Rp million)
Number of Accounts Total Value
(‘000) Cumulative Share (%)
(Rp trillion) Cumulative Share (%)
0–100 80,766 97.7 331 18.7
100–200 882 98.7 120 25.5
200–1,000 846 99.8 355 45.5
1,000–2,000 108 99.9 152 54.1
2,000–5,000 50 100.0 160 63.2
>5,000 30 100.0 652 100.0
All 82,682 1,769
Source: Indonesia Deposit Insurance Corporation (LPS).
reprimand and a trivially small fi ne of Rp 10 million (less than $1,000). Given
the light penalty and the lack of clarity as to what are considered to be justifi able
underlying motives, this policy is unlikely to have any signifi cant impact.
Rather than making it diffi cult for people to shift their assets offshore, or
try-ing to persuade them not to do so by offertry-ing a government guarantee that is potentially extremely expensive to the general public, it would seem desirable for the authorities to address the underlying problem of fragile confi dence in
Indo-nesia’s fi nancial institutions. Offi cial assertions that there have been considerable
improvements in the effectiveness of prudential supervision since Indonesia’s last crisis are beginning to sound hollow with the collapse of Bank Century and the alleged embezzlement by Antaboga.10 These cases invite urgent reconsideration of
the desirability of establishing an independent supervisory agency for the entire
fi nancial sector, which was strongly debated in 2002–04 without any conclusive
decision or follow-up action (Siregar and James 2006)—even though chapter 34 of Law 3/2004 on Changes to Law 23/1999 on Bank Indonesia requires that this should be achieved by the end of 2010.
The GFC lends urgency to the need to re-assess the regulations on banks’ capi-tal adequacy. Work is already under way to modify the Basel II capicapi-tal adequacy regulations11 in such a way as to ensure greater sensitivity of capital requirements
to the different risks to which banks are exposed (Turner 2009). There is a strong perception that, under the present regulations, the capital requirement has been too low relative to the risks being taken on by banks. Indeed, in his speech to the Annual Bankers Dinner on 30 January 2009, BI Governor Boediono mentioned the need for banks to strengthen their CARs (Boediono 2009)—although just a few days earlier BI had moved in the other direction by delaying the full inclusion of operational risks into the CAR measurement until January 2011.12 While the
authorities are waiting for a new internationally accepted minimum CAR, it might be a good time to announce a signifi cant increase in Indonesia’s own requirement.
Ensuring that bank share-holders had much more to lose should their bank fail would lessen the severe moral hazard inherent in the recently expanded govern-ment guarantee of bank deposits. Since Indonesia’s banks had an average CAR of more than twice the minimum requirement at the end of 2008, increasing the minimum CAR would require no further action on the part of many of them. Individual banks with relatively low CARs would have to cut back on lending if they were unwilling or unable to increase their capital, but this would be entirely appropriate in current circumstances, given that confi dence in banks is absolutely
essential. It is important that bank lending continues to expand, but it would be counter-productive to rely too heavily for this on banks with inadequate capital.
10 January 2009 saw the emergence of another embezzlement case involving a securities company, PT Sarijaya Permana Sekuritas, that reportedly has cost investors billions of ru-piah (Krismantari 2009).
11 The International Convergence of Capital Measurement and Capital Standards: A Revised Framework—known as ‘Basel II’—stipulates that banks need to take into account a wider set of risks, especially their operational risks, when calculating their CARs.
12 The inclusion of an allowance for operational risks in the CAR was to commence from 1 January 2009, but it is now to be phased in gradually over two semesters, starting from 1 January 2010 (BI Circular 11/3/DPNP, dated 27 January 2009).
Counter-cyclical fi scal measures
The diffi culty of forecasting the severity of the economic downturn means that
any budget is likely to miss its targets. It is important, therefore, to have as much
fl exibility as possible in responding to rapidly changing circumstances. Faced
with considerable uncertainty about the near-term future, the government sought parliamentary approval for urgent adjustments to the 2009 budget in mid-January 2009. Article 23 of Law 41/2008 on the Budget for 2009 stipulates that, in an emer-gency, the government can propose budget revisions if the following three condi-tions apply: fi rst, if deviations from key macroeconomic assumptions will result
in a signifi cant reduction in revenue or increase in expenditure; second, if there is
a dramatic rise in the yield on government bonds; and third if there is a crisis in the banking and fi nance system requiring additional funds to guarantee bank and
non-bank institutions.
On the grounds that Indonesia was now—or might soon be—facing most if not all of these circumstances, the fi nance minister unveiled a fi scal stimulus package
that would have the effect of increasing the 2009 budget defi cit by around Rp 71
trillion, or 1.4% of GDP (table 6). The package has four major categories: income tax cuts; waivers of various taxes and import duties; additional energy subsidies for fi rms; and additional government spending. It aims to stimulate aggregate
demand mainly through the business sector. Additional government spending accounts for only a small part of the total amount, and there is little by way of stimulus to the household sector: more than 60% of the package is devoted to income tax cuts, but most income tax is derived from businesses rather than indi-viduals. Moreover, the rate cuts will tend to be offset by ongoing efforts to encour-age more individuals and fi rms to register as taxpayers.
TABLE 6 January 2009 Fiscal Stimulus Package
Policy Measure Rp trillion %
Income tax cuts for individuals & businesses, including increase in individuals’ non-taxable income threshold
43.0 60.3
Waivers of taxes & import duties (mainly for businesses) 13.3 18.7
VAT on oil & gas exploration, cooking oil 3.5 4.9
Import duties on raw materials & capital goods 2.5 3.5
Income taxes of employees 6.5 9.1
Income taxes of geo-thermal energy producers 0.8 1.1
Energy subsidies & government spending for businesses 4.2 5.9
Price reduction of Rp 300/litre for diesel fuel 2.8 3.9 Discounted peak load electricity tariff for manufacturers 1.4 2.0
Additional government spending 10.8 15.1
Infrastructure 10.2 14.3
Expansion of National Program for Empowerment of Society 0.6 0.8
Total 71.3 100.0
Source: Abimanyu (2009).
Simply put, the most immediate problem facing policy makers is a rapid decline in demand for Indonesian exports, together with generalised reductions in spend-ing by both fi rms and individuals in response to a highly uncertain outlook. In light
of this, it seems preferable to introduce measures intended to encourage as many individuals and fi rms as possible to increase their spending. While the stimulus
package will certainly help to improve business sector cash fl ows, neither improved
cash fl ow nor ready availability of bank loans will suffi ce to keep production near
capacity and thus avoid large-scale lay-offs of workers if there is a lack of demand. Given the urgency of increasing spending on infrastructure, it is disappoint-ing that only a relatively small amount is allocated to it. It is true that there are signifi cant lags involved in spending on new infrastructure, but there is surely
plenty of scope for doing much more almost immediately by way of small-scale, labour-intensive maintenance work, since this requires no new land acquisition and no new design work. Its own spending aside, the government already has at its disposal a mechanism for putting additional income and spending power in the hands of vast numbers of consumers, through the existing direct cash transfer program introduced to compensate the poor for fuel price rises in 2005 and 2008. The program connects directly with about 20 million families, or perhaps 100 mil-lion individuals—by contrast with only about 6 milmil-lion mainly wealthy, urban-based individuals who might benefi t from income tax reductions—and it would
be a simple matter to increase the value of monthly transfers to them. Unfortu-nately, many members of the DPR are strongly opposed to this idea, fearing (with some justifi cation) that the president and his party would use it as a means of
gaining electoral advantage. This policy—which would contribute to the stated objective of poverty alleviation as well as stimulating the economy—is a notable omission from the stimulus package.
The pattern of spending in previous budgets also underlies concern about the capacity of the government to pursue counter-cyclical fi scal measures. In principle,
to offset the decline in export demand and predictable cutbacks in private sector spending, the stance of fi scal policy would need to be increasingly expansionary
during the fi rst semester of 2009. By contrast, the 2008 budget outcome was in fact
somewhat contractionary. In particular only about 90% of funds allocated to min-istries and government agencies was actually spent, with spending concentrated in the second half. Successful implementation of broad-based expansionary fi scal
policy requires a strong policy commitment across the various ministries, agen-cies and regional governments. Public sector reforms carried out at the Ministry of Finance (McLeod 2008) seem to be having a commendable impact on tax rev-enue collection, and should be a model for other ministries to follow. Ironically, however, what is needed at present is more spending, not more tax revenue, and as yet there has been little progress in bureaucratic reform on the expenditure side of the budget. The fi nance minister has spoken of the need to accelerate the
project tender process, and possibly to increase the maximum value of projects that can be implemented without a call for tenders. Her ministry has little control over spending at the regional government level, however, or over that of other ministries and government agencies.
The lack of capacity to spend at regional government level is one of the greatest challenges to the counter-cyclical policy agenda in 2009. By July and December 2008, for example, the government of the capital city, Jakarta, had managed to