Full Terms & Conditions of access and use can be found at
http://www.tandfonline.com/action/journalInformation?journalCode=vjeb20
Download by: [Universitas Maritim Raja Ali Haji] Date: 12 January 2016, At: 23:00
Journal of Education for Business
ISSN: 0883-2323 (Print) 1940-3356 (Online) Journal homepage: http://www.tandfonline.com/loi/vjeb20
Evaluating and Improving Student Achievement
in Business Programs: The Effective Use of
Standardized Assessment Tests
H. Tyrone Black & David L. Duhon
To cite this article: H. Tyrone Black & David L. Duhon (2003) Evaluating and Improving Student Achievement in Business Programs: The Effective Use of Standardized Assessment Tests, Journal of Education for Business, 79:2, 90-98, DOI: 10.1080/08832320309599095
To link to this article: http://dx.doi.org/10.1080/08832320309599095
Published online: 31 Mar 2010.
Submit your article to this journal
Article views: 97
View related articles
Evaluating and Improving Student
Achievement in Business
Programs: The Effective Use of
Standardized Assessment Tests
H.
TYRONE BLACK
DAVID L. DUHON
zyxwvutsrqponmlkjihgfedcbaZYXWVUTSRQPONMLKJIHGFEDCBA
The University
zyxwvutsrqponmlkjihgfedcbaZYXWVUTSRQPONMLKJIHGFEDCBA
of
Southern Mississippi
Hattiesburg, Mississippi
ur purpose in writing this article is
0
to improve assessment of student learning by (a) reviewing issues related to the appropriateness of any particular standardized test of student achieve- ment and (b) providing examples of how test results can be used for evalua- tion and performance improvement. Allen and Bycio (1997), using data from administration of the Educational Testing Service’s (ETS) Major Field Test in Business, addressed test appro- priateness, and Mirchandani, Lynch, and Hamilton (2001) compared the use of grade point averages versus scores on the ETS business field test for assess- ment of student learning. We use data from administering the ETS business field test to extend these studies, partic- ularly in the area of applications of stan- dardized test results. Before addressing standardized tests and their uses, how- ever, we provide some background on educational accountability and learning assessment.Accountability Background
In the 1970s, a few state governments and institutional governing boards attempted to hold institutions of higher learning more accountable for the funds that they received. These embryonic
ABSTRACT. Having made “continu- ous improvement” the theme of its accreditation process a decade ago, the Association to Advance Collegiate Schools of Business (AACSB) is poised to make “assurance of learn- ing” the current focus of the facultyhtudent exchange. In this arti- cle, the authors discuss how to use standardized assessment tests appro- priately and constructively for compli- ance with this requirement. They pro- vide an overview of accountability in higher education and then focus on assessing student achievement and development. They use results from the Educational Testing Service’s Major Field Test in Business to illus- trate verification of test reliability and validity. Finally, they suggest ways that standardized test results can be used for evaluating and enhancing stu- dent performance.
accountability efforts included perfor- mance budgets, performance audits, and program reviews. Folger (1977) under- scored the output/effectiveness aspect of these early activities in the following descriptions: Performance budgets base “at least some funding on the outcomes
or quality of the budgeted activity ”;
zyxwvutsrqponmlkjihgfedcbaZYXWVUTSRQPONMLKJIHGFEDCBA
performance audits are “an assessment of the effectiveness of an activity or organization in achieving its goals and objectives”; and program reviews assess “the need for and the effectiveness of a proposed or existing program” (pp. viii
and ix). Yet according to a 1976 survey of state higher education agencies, only six states were collecting and reporting outcome measures in their budgeting systems (Peterson, Erwin, & Wilson, 1977); similarly, Berdahl (1977) found just seven states that were engaged in intensive performance audits. Finally, Barak (1977) reported that only a few states were conducting comprehensive program reviews.
Thus, by 1980, rather than focusing on performance, academic assessment still emphasized structure and resources. Troutt (198 1) criticized regional accrediting bodies for their lack of attention to outcomes, arguing that “accreditation standards suggest checking the cumculum is more reliable than checking the student” and adding that “concerns about the outcomes of the educational process generally appear only as appendages to accredita- tion standards” (p. 47).
Nonetheless, accountability was about to move to center stage. The catalyst was a series of studies and reports pointing to a deterioration in educational quality. Perhaps the most influential of these cri-
tiques was
zyxwvutsrqponmlkjihgfedcbaZYXWVUTSRQPONMLKJIHGFEDCBA
A Nation at Risk: The Imper- ativezyxwvutsrqponmlkjihgfedcbaZYXWVUTSRQPONMLKJIHGFEDCBA
for Educational Reform (National Commission on Excellence in Educa-tion, 19831, which recited evidence of a
90 Journal of Education for Business
decline in the abilities of high school and college graduates. In the meantime, state governments, institutional govern- ing boards, education commissions, and the public began asking for evidence that educational dollars were producing qualified students and worthwhile ser- vices. Responding to these calls for
more accountability,
zyxwvutsrqponmlkjihgfedcbaZYXWVUTSRQPONMLKJIHGFEDCBA
U.S. Secretary ofLabor William Bennett issued an execu- tive order in 1988 requiring all federally approved regional accreditation organi- zations to include evidence of institu- tional effectiveness in their accredita-
tion criteria (Palomba
zyxwvutsrqponmlkjihgfedcbaZYXWVUTSRQPONMLKJIHGFEDCBA
& Banta, 1999). Consequently, the six regional accredit-ing agencies began giving more weight to outcomes in their accreditation reviews. In this regard, the Southern Association of Colleges and Schools was the initial leader, but Kimmell, Marquette, and Olsen (1998) identified the North Central Association of Col- leges and Schools as the association most insistent that the candidate institu- tion document student achievement and overall institutional effectiveness.
Likewise, at the program level many accrediting agencies have reoriented standards to focus more on results and accompanying processes, although structure still plays a significant role in some areas such as curriculum. The AACSB began a review of business and accounting standards in the late 1980s in response to criticisms that business graduates lacked writing, interpersonal, and other skills critical to career success. Addressing such crit- icisms, an AACSB-commissioned
study,
zyxwvutsrqponmlkjihgfedcbaZYXWVUTSRQPONMLKJIHGFEDCBA
Management Education and Development: Drift o r Thrust Into the21st Century? (Porter & McKibbin, 1988), made recommendations for changes in the content and delivery of management education, thereby setting the stage for new AACSB accreditation standards. Subsequently, in 1992 AACSB replaced resource-oriented standards for business program accred- itation with requirements emphasizing “continuous improvement” (AACSB, 1994-1995). The AACSB (2002) has drafted new accreditation standards with a curriculum component that would emphasize “assurance of learn- ing.” According to the draft, “This is a shift of perspective from structural
input to learning outcome. It asks for
evidence, rather than intent” (p. 5).
zyxwvutsrqponmlkjihgfedcbaZYXWVUTSRQPONMLKJIHGFEDCBA
InstitutionaVProgram Eff ectlveness
Nichols and Nichols (2000b) distin- guished between strategic planning and institutional effectiveness. Strategic
planning focuses on implementing
action plans designed to align organiza- tional structure, resources, activities, and related processes with institutional mission, vision, and strategic goals. On the other hand, institutional efjrective-
ness is concerned with the extent to
which intended outcomes are being achieved. Thus, a strategic plan may include an objective of obtaining addi- tional resources for altering a particular program, and success would be judged by whether the resources were secured and used to modify the program. Assuming that funds were obtained and the program was modified, institutional effectiveness would involve evaluation of success according to evidence of improved program outcomes.
The following description of educa- tional program evaluation within the institutional effectiveness framework is an adaptation of the Nichols and Nichols (2000a) model:
The institution’s mission, vision, and goals are the basis for a program’s intend- ed outcomes, which should concentrate
on student achievement and development.
Programs must decide on means of assessment, including the data to be gath-
ered and how to process it, as well as cri- teria for success. Program assessment
should focus on concrete, verifiable
results, such as how much students have
learned and whether they find employ- ment upon graduation. Results, then, determine program effectiveness, thereby
indicating whether changes are needed to achieve intended outcomes and better conformance with mission, vision, and goals. Finally, institutional effectiveness structure, processes, and results should be reviewed regularly with the aim of con- tinuous improvement.
Hence, true program accountability with- in the institutional effectiveness frame- work focuses on results and improve- ments, particularly in terms of student achievement and development rather than level of resources or structure.
A considerable body of assessment
literature deals with institutional and program accountability with related work on measuring and improving stu- dent achievement. Assessment manuals by Nichols (1995) and Palomba and Banta (1999) contain comprehensive institutional effectiveness models with detailed implementation guidelines. At the program level, works by Barak and Mets (1995) and Nichols and Nichols (2000a) outline procedures for effective evaluation. In the business area, accounting appears to be the program most involved in assessment, possibly because of the outgrowth of experience with the certified public accountant (CPA) examination. DeMong, Lind- gren, and Perry (1994) examined issues related to the design of assessment processes and presented a matrix of techniques for assessing student out- comes. Ackers and Giacomino (1997) discussed details of the design and implementation of their school’s system of accounting program assessment, and Apostolou (1999) argued that account- ing program assessment can be improved by using proven practices from other disciplines. A case study by Stivers, Campbell, and Hermanson (2000) demonstrated how their account- ing program has been dealing with design and implementation issues and the use of assessment results for pro- gram improvements.
For student achievement assessment and development, works by Erwin (1991) and Halpern (1987) contain information on design and implementa- tion. In addition, the following studies are examples of ways to use student achievement data to strengthen pro- grams: Staik and Rogers (1996), who discussed how results on the ETS Major Field Test in Psychology led to curricu- lum modification; Magruder and Young (1996), who reported general-education curriculum changes based on outcomes on standardized examinations; Hanson (1996), who described a regression model used to place freshman students in an appropriate introductory writing class; Young (1996), who explained how her institution has used standard- ized examinations administered to seniors in all majors to make program changes; and Franklin and Tolbert (1993, who described how assessment
November/December 2003 91
results have been the catalyst for improvements in their nursing program. These examples may give the impres- sion that accountability is the modus operandi of higher education. However, assessment is still not the rule. For instance, in a recent survey of account- ing administrators, Kimmell et al. (1998) reported that only 42% indicated the existence of a comprehensive insti- tutional assessment program at their universities. Even more focused learn- ing evaluation is far from universal, as demonstrated by the following assess- ment rates found by Kimmell et al. among the institutions in their survey: tests of general education, 46%; major field tests, 36%; tests of reading, writ- ing, and/or listening ability, 21%; and critical-thinking tests, 12%.
Even when assessment occurs, the results all too frequently are ignored. Franklin and Tolbert (1995, p. 37) argued: “Traditionally, assessment data have primarily been used to report pro- gram outcomes for accrediting bodies. Unfortunately these valuable data have been underutilized in curriculum devel- opment and individual student enrich- ment.” To some extent, the relatively few applications reflect the considerable investment of time and effort required for effective use of assessment results. More- over, faculty members are often skeptical about the value of accountability, espe- cially when they observe the extent to which organizational interest in assess- ment waxes and wanes with accreditation and other review cycles. In this article, we attempt to help readers use standard- ized tests appropriately for gathering stu- dent achievement data that become the
basis for making improvements.
zyxwvutsrqponmlkjihgfedcbaZYXWVUTSRQPONMLKJIHGFEDCBA
Standardized Achievement
Tests-The ETS
zyxwvutsrqponmlkjihgfedcbaZYXWVUTSRQPONMLKJIHGFEDCBA
Major
Field Testin Business
zyxwvutsrqponmlkjihgfedcbaZYXWVUTSRQPONMLKJIHGFEDCBA
Standardized Tests
Standardized tests can be an effective tool for assessing student achievement: “A standardized test is one in which the initial construction, as well as condi- tions for administration and scoring, have a uniform procedure so that the scores may be interpreted in a consistent manner from one administration to the
next” (Ball State University, 1992, sec- tion IV). Standardized tests can be developed internally or acquired from testing organizations. Local tests require considerable faculty effort and other resources for test development, scoring, reporting, and improving. Nonetheless, local instruments can be tailored to a specific course or program so that scores accurately reflect the extent to which learning objectives are being met. On the other hand, the test- ing organizations that offer standardized tests generally provide valuable com- parative data on other schools; more- over, external tests usually are devel- oped by test experts who thoroughly address desirable test properties such as reliability and validity (Ewell, 1987;
Nichols
zyxwvutsrqponmlkjihgfedcbaZYXWVUTSRQPONMLKJIHGFEDCBA
& Nichols, 2000a). Conse- quently, the standardized tests offeredby testing organizations have become a
popular vehicle for determining whether learning objectives are being met.
The ETS Major Field Test in Business
The Educational Testing Service describes the ETS Major Field Test in Business as a “test of achievement” that provides a measure of the “mastery of the concepts, principles, and knowledge” within the student’s major field of study, in this case business (Educational Test- ing Service, 1997b, p. 1). The business field test is a 120-item, 2-hour multiple- choice examination with possible scores ranging from 120 to 200 and with asso- ciated percentiles. The subject matter covered is typical of the “business core,” or what was referred to as the “common body of knowledge” in pre-1992 AACSB accreditation standards. Thus, the test’s eight components are account- ing, economics, management, quantita- tive business analysis, finance, market- ing, legal and social environment, and international business. To collect the data reported in this study, we used version I of the ETS business field test, which more than 300 institutions used to test over 45,000 examinees (Educational Testing Service, 1997a). The major field tests are revised on a 5-year cycle.
We collected data during 3 semesters
in 1996-1997 when the ETS Major Field Test in Business was administered to 456 seniors enrolled in a senior business-core
course. Any student taking the ETS major field test who scored at the nation- al 50th percentile or better was given an extra-point bonus, which was used for calculating the final course grade. If this or a similar incentive is not used, some students will not take the test seriously and the results therefore may be mis- leading (Allen & Bycio, 1997).
Students who took the test typically were in their last or next-to-last semes- ter, and the majority of examinees had completed the business core or were currently enrolled in their last core courses. We did not include in our study students who had more than 6 hours of core course work remaining after the end of the semester. In addition, we
wanted to determine the association between ETS test scores and perfor- mance on the ACT and therefore excluded students who had not taken the ACT. As a result, our analysis included 297 students out of the 456 who took the ETS major field test during the study period.
Reliability Issues
Schools using standardized test scores for evaluation and decision mak- ing should determine that the scores are reliable and valid. Test scores are reli- able when they provide consistent (sta- ble) rank-order results. Reliable tests, among other desirable properties, con- tain questions that are unambiguous. Although there are various methods of measuring test reliability, ETS employs an indicator of internal reliability known as Kuder-Richardson Formula 20. ETS’s version I business field test reliability coefficient is 0.89. According to Ebel and Frisbie (1991), schools can make decisions about individual stu- dents when the reliability coefficient is 0.85 and above and can make decisions or draw conclusions about groups when
the coefficient is 0.65 and above.
zyxwvutsrqponmlkjihgfedcbaZYXWVUTSRQPONMLKJIHGFEDCBA
Validity IssuesTest-score reliability is a necessary but not sufficient condition for validity. Validity exists when scores on the instrument (a) reflect achievement on
the dimensions that the school wishes to evaluate and (b) are used appropriately
92 Journal of Education for Business
for evaluation and decision making
(Ebel &
zyxwvutsrqponmlkjihgfedcbaZYXWVUTSRQPONMLKJIHGFEDCBA
Frisbie, 1991). Validity has sev- eral dimensions, including content andcontext validity. For a particular pro-
gram,
zyxwvutsrqponmlkjihgfedcbaZYXWVUTSRQPONMLKJIHGFEDCBA
content validity exists when test coverage is consistent with the curricu-lum, whereas context validity addresses the extent to which scores are correlated logically with other variables expected to be associated with student achieve- ment. Test reliability and validity were addressed by Herring and Izard (1992), who analyzed scores from the AICPA
Level II Achievement Test, and by Allen
and Bycio (1997), who examined the ETS Major Field Test in Business.
ETS addresses content validity by using faculty committees and expert consultants to construct and evaluate the items on the business field test (Educa- tional Testing Service, 1997a); never- theless, any school considering the instrument should thoroughly review content to assure that scores reflect the extent to which learning objectives are being met. Our faculty members reviewed the business field test and determined that scores would measure achievement appropriately in our busi- ness core curriculum. To enhance con- tent validity, schools may include up to 50 locally written questions that ETS will score and report; however, it is the school’s responsibility to assure the reli- ability of scores on these items.
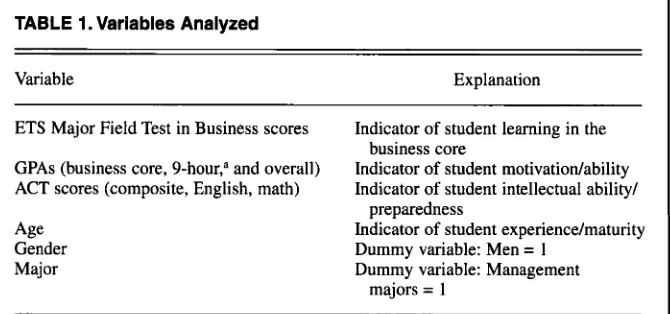
Criterion validity is the extent to which scores on the standardized test are correlated with other variables that the school expects to be associated with test performance (Ebel & Frisbie, 1991). Such expectations are formed to a large extent by the school’s previous experience in assessing the performance of its students. Furthermore, for a par- ticular standardized test, other users of the test may have reported their findings related to criterion validity, and this information can be useful in forming expectations about variables most likely to be associated with student perfor- mance. Finally, ETS reports collective data that also can be helpful in assessing criterion validity. Based on these con- siderations, Table 1 lists the variables analyzed in our consideration of criteri- on validity. The first item in the table is the dependent variable, ETS Major Field Test in Business scores, and the
remaining items are variables that we expected to be related to ETS business test scores for the following reasons:
Grade point averages (GPAs). GPA is an indicator of student ability and motivation and therefore should be associated positively with ETS test per- formance. We evaluated three specific grade point averages: (a) business core GPA (given the similarity of the subject matter covered by the ETS Major Field Test in Business and our school’s busi- ness core, this GPA should be and was the one most closely associated with ETS test performance), (b) overall GPA, and (c) a 9-hour GPA that included grades in Principles of Economics I and I1 and Introduction to Financial Accounting. We chose this 9-hour GPA because we wanted to develop a predic-
tive model
zyxwvutsrqponmlkjihgfedcbaZYXWVUTSRQPONMLKJIHGFEDCBA
of ETS test performance (seethe applications section of this article). Allen and Bycio (1997) considered sev- eral GPAs in their study of ETS busi- ness field test criterion validity and found the strongest association between business core GPAs and ETS test scores. Mirchandani, Lynch, and Hamil- ton (2001) found the strongest associa- tion between a group of quantitative courses and ETS test scores.
ACT scores. ACT scores are an indication of academic ability and pre- paredness and should be associated pos- itively with ETS test scores (we ana- lyzed composite scores as well as scores on the English and mathematics compo- nents). Allen and Bycio found a positive association between SAT and ETS test
scores, as did Mirchandani, Lynch, and Hamilton.
Gender. Because ETS reports that
the national mean score of men is
zyxwvutsrqponmlkjihgfedcbaZYXWVUTSRQPONMLKJIHGFEDCBA
3.41points higher than women’s mean scores, a similar pattern would be expected for our students. Moreover, the Allen and Bycio and the Mirchandani, Lynch, and Hamilton studies reported that male students performed better than female students. (We could not explain the disparity between male and female test performance by controlling for ACT scores and GPA differences. We surmise that work experience may be a con- tributing factor; however, we did not have detailed work-related information to test this hypothesis.)
Age. Given our experience with nontraditional students, we believe that age is a proxy for work experience and thus should be positively related to ETS test performance.
Majorfield
zyxwvutsrqponmlkjihgfedcbaZYXWVUTSRQPONMLKJIHGFEDCBA
of study. Given the dif- ferences in coverage of business topicsin course work specific to our various majors, performance on the ETS major field test should be influenced by a stu- dent’s major. Allen and Bycio reported a statistically significant variation of ETS test scores among the various majors offered by their school.
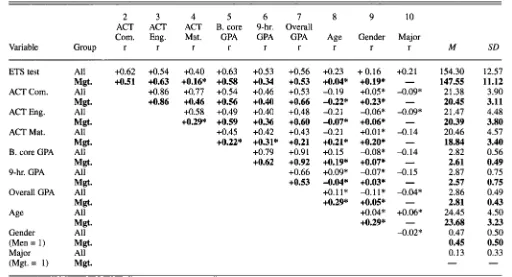
In Table 2, we provide descriptive
data for all 297 students in our study, in a format that follows Allen and Bycio (1997). In addition, we selected man- agement majors ( n = 3 8 ) from among
[image:5.612.224.559.541.698.2]our six undergraduate programs to illus- trate how additional descriptive infor-
TABLE 1. Variables Analyzed
Variable Explanation ETS Major Field Test in Business scores
GPAs (business core, 9-hour: and overall) ACT scores (composite, English, math)
Age Indicator of student experiencehaturity Gender
Major Dummy variable: Management Indicator of student learning in the Indicator of student motivatiodability Indicator of student intellectual ability/
business core preparedness
Dummy variable: Men = 1 majors = 1
aThe 9-hour GPA includes grades in Principles of Economics I and
zyxwvutsrqponmlkjihgfedcbaZYXWVUTSRQPONMLKJIHGFEDCBA
I1 and Inrroduction to Finan- cial Accounting.NovembedDecember 2003 93
TABLE 2. Descriptive Statistics: Correlations, Means, and Standard Deviations (All:
zyxwvutsrqponmlkjihgfedcbaZYXWVUTSRQPONMLKJIHGFEDCBA
NzyxwvutsrqponmlkjihgfedcbaZYXWVUTSRQPONMLKJIHGFEDCBA
= 297; Mgt.:zyxwvutsrqponmlkjihgfedcbaZYXWVUTSRQPONMLKJIHGFEDCBA
n=
38)zyxwvutsrqponmlkjihgfedcbaZYXWVUTSRQPONMLKJIHGFEDCBA
2 3 4 5 6 7 8 9 10
zyxwvutsrqponmlkjihgfedcbaZYXWVUTSRQPONMLKJIHGFEDCBA
ACT ACT ACT B. core 9-hr. Overall
Corn. Eng. Mat. GPA GPA GPA Age Gender Major
Variable Group
zyxwvutsrqponmlkjihgfedcbaZYXWVUTSRQPONMLKJIHGFEDCBA
r r r r r r r r r M SD ETS testACT Corn.
ACT Eng. ACT Mat. B. core GPA 9-hr. GPA Overall GPA Age
Gender
(Men = 1) Major
(Mgt. = 1)
All All Mgt. All Mgt. All Mgt. All Mgt. All Mgt. All All Mgt. All Mgt. All Mgt. M%. Mgt.
+0.62 +0.54 +0.40 +0.63 +0.51 +0.63 +0.16* +0.58
+0.86 +0.77 +0.54 +0.86 +0.46 +0.56
+0.58 +0.49 +0.29* +0.59
+0.45 +0.22*
+0.53 +0.56 +0.34 +0.53 +0.46 +0.53 +0.40 +0.66 +0.40 +0.48 +0.36 +0.60 +0.42 +0.43 +0.31* +0.21 +0.79 +0.91 +0.62 +0.92
+0.66 +0.53 +0.23 +0.04* -0.19 -0.22” -0.21 -0.07* -0.21 +0.21* +0.15 +0.19* +0.09* -0.04” +0.11* +0.29*
+
0.16+0.19*
zyxwvutsrqponmlkjihgfedcbaZYXWVUTSRQPONMLKJIHGFEDCBA
+0.05*
+0.23* -0.06* +0.06*
+o.o
1*
+0.20* -0.08* +0.07* -0.07* +0.03* -0.11* +0.05* +0.04* +0.29* +0.21 -0.09*
-
-
-0.09* -0.14-
-
-0.14-
-0.15-
-0.04* +0.06* -0.02”-
-
154.30 147.55 21.38 20.45 2 1.47 20.39 20.46 18.84 2.82 2.61 2.87 2.57 2.86 2.81 24.45 23.68 0.47 0.45 0.13-
12.57 11.12 3.90 3.11 4.48 3.80 4.57 3.40 0.56 0.49 0.75 0.75 0.49 0.43 4.50 3.23 0.50 0.50 0.33-
zyxwvutsrqponmlkjihgfedcbaZYXWVUTSRQPONMLKJIHGFEDCBA
Note. Figures for all majors are in standard font; figures for management majors are in bold font. All correlations are significant at p < .01 except those indicated with an asterisk (*).
mation can be generated for any major area of study. Furthermore, in the multi- variate analysis below, we estimated the impact of majoring in this area on ETS test scores. (Other majors also could be singled out for similar treatment.) In Table 2, the mean ETS test score is 154.30 for all majors (46th percentile for ETS student-total-score distribution) and 147.55 for management majors (27th percentile). Compared with all majors, management students had the lowest mean ACT scores and grade point averages and were slightly younger. For all majors, the strongest ETS test score correlations were with business-core GPA (r = +0.63) and with the ACT composite score (r = +0.62). All ETS test score correlation coeffi- cients listed for “All” and “Mgt.” in Table 2 (first two data rows) were statis- tically significant at the .01 level except for the mathematics ACT, age, and gen- der correlations for management majors.
Allen and Bycio (1 997) used regres- sion analysis to study the association of grade point averages and SAT scores
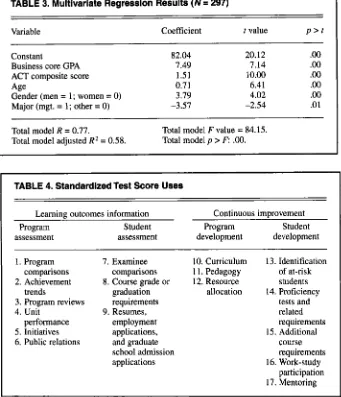
with ETS business field test scores; however, they employed analysis of variance when considering the associa- tion of gender and major with ETS test scores. Mirchandani, Lynch, and Hamil- ton (2001) also used a regression model that explained 37% of the variation in the ETS field test scores of their native students for whom they had SAT scores. Our model explains 58% of the varia- tion in ETS scores (see the
RZ
adjusted in Table 3 below) and includes the fol- lowing variables: business core GPA, composite ACT score, age, gender, and major. (We treated gender and major as dummy variables, with men = 1 and management majors = 1.) The multi- variate regression results in Table 3 reveal the following:A business core GPA that is one point higher is associated with an ETS test score that is 7.49 points higher.
A composite ACT score that is one point higher is associated with an ETS test score that is 1.51 points higher.
A l-year positive age differential is associated with an ETS test score that is 0.71 points higher.
Men have an ETS test-score advan- tage of 3.79 points over women.
After controlling for GPA, ACT scores, age, and gender, we found that management majors were at a 3.57- point disadvantage relative to other business majors on the ETS test.
A high correlation (at least +/-0.70) between any pair of independent vari- ables would indicate the presence of collinearity and its attendant statistical distortions (Anderson, Sweeney, &
Williams, 2002). Because the correla- tion of +0.54 between ACT composite scores and business core GPAs is the highest correlation for any pair of inde- pendent variables (see Table 2), we were satisfied that our regression coef- ficients provide credible, useful infor- mation. In addition, the value of R2
adjusted (0.58) in Table 3 and the high significance levels of R2 and the inde-
pendent-variable coefficients indicate that ETS Major Field Test in Business scores have criterion validity for our program. Having addressed the issues of score reliability and validity satisfac-
94 Journal of Education for Business
[image:6.612.51.563.63.340.2]I 1
TABLE 3. Multivariate Regression Results ( N
zyxwvutsrqponmlkjihgfedcbaZYXWVUTSRQPONMLKJIHGFEDCBA
=zyxwvutsrqponmlkjihgfedcbaZYXWVUTSRQPONMLKJIHGFEDCBA
297)zyxwvutsrqponmlkjihgfedcbaZYXWVUTSRQPONMLKJIHGFEDCBA
Variable Coefficient
zyxwvutsrqponmlkjihgfedcbaZYXWVUTSRQPONMLKJIHGFEDCBA
t valuezyxwvutsrqponmlkjihgfedcbaZYXWVUTSRQPONMLKJIHGFEDCBA
P’tConstant 82.04 20.12
.oo
Business core GPA 7.49 7.14.oo
ACT composite score 1.51 10.00.oo
0.71 6.41.oo
Gender (men = 1; women = 0) 3.79 4.02
.oo
AgeMajor (mgt. = 1; other = 0) -3.57 -2.54
.o
1Total model R = 0.77.
Total model adjusted R 2 = 0.58.
Total model F value = 84.15. Total model p > F .OO.
1 I
TABLE 4. Standardized Test Score Uses
Learning outcomes information Continuous improvement Program Student Program Student assessment assessment development development
1. Program comparisons 2. Achievement
trends
3. Program reviews
4. unit performance
5 . Initiatives
zyxwvutsrqponmlkjihgfedcbaZYXWVUTSRQPONMLKJIHGFEDCBA
6. Public relations
7. Examinee comparisons 8. Course grade or
graduation requirements employment applications, and graduate school admission applications 9. Resumes,
10. Curriculum 13. Identification 1 1. Pedagogy of at-risk 12. Resource students
tests and related requirements 15. Additional
course requirements
16. Work-study participation 17. Mentoring allocation 14. Proficiency
torily, we conclude that schools can turn to using standardized test results for evaluation and enhancement.
Using Student Achievement Test Results
In Table 4, we classify uses of stan- dardized test results as either learning outcomes information or continuous improvement. We further divide learn-
ing information uses into program assessment and student assessment, and continuous improvement applications into program development and student development. The learning information provided by standardized tests can indi- cate if actual learning outcomes are con- sistent with intended outcomes. Contin- uous improvement involves using test results to enhance student achievement by making program changes and inter-
vening in the individual student learning process.
Uses of
zyxwvutsrqponmlkjihgfedcbaZYXWVUTSRQPONMLKJIHGFEDCBA
Learning Outcomes InformationProgram assessment, The percentile
level of the mean score of the cohort who took the test (see Table 4, item 1) is probably the most useful statistical com- parison among groups of test takers. For example, a cohort mean score at the 60th percentile indicates that this cohort performed as well as or better than 60% of the groups that have taken the test. ETS provides percentile levels for com- paring group (and individual) scores but maintains that the percentiles are not “norms” because the schools that partic- ipate in the ETS testing process are nei- ther the entire population of schools offering such programs nor a random
sample of such schools (Educational Testing Service, 1997a). Whatever the relative program performance level for any particular administration of the test, longitudinal test results are also impor- tant in evaluating student achievement progress (see Table 4, item 2).
A school can use standardized tests
in accreditation and other program reviews to relate learning outcomes, thereby providing information on the success of its students in achieving learning objectives (see Table 4, item
3). For institutions that use multifac- eted performance measures to assess unit productivity, student-learning out- comes and improvements can serve as unit performance indicators (see Table 4, item 4).
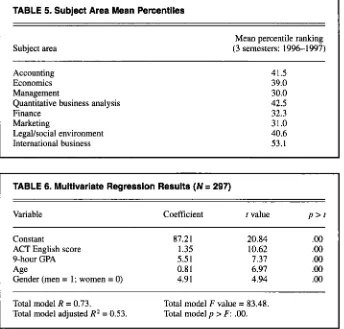
Schools using the ETS Major Field Test in Business receive percentile scores for each of the eight subject-mat- ter areas covered by the test. In Table 5,
we show the mean national percentile subject area ratings for our school for the
3 semesters covered by this study. This information can be useful in evaluating program initiatives (see Table 4, item 5 ) .
For instance, international business is a high priority for our college: We (a) offer an international business major, (b) require all students to take an interna- tional economics course, (c) have an international component in several core courses, (d) require an international course in most majors, (e) offer an extensive array of study-abroad courses and programs, and (f) have administered three federal grants for enhancing inter- national programming. The relatively good performance in the international business area, as reported in Table 5,
indicates that this particular initiative has produced positive results.
Finally, for cases in which standard- ized test performance is relatively strong or significant improvement is occurring, the school may want to use the results for public relations (e.g., in newsletters and press releases; see Table 4, item 6).
Student assessment evaluation. Compar-
isons can be made between the score of a particular examinee and the mean score of all students who have taken the test (see Table 4, item 7). ETS provides each examinee a percentile level indicat-
November/December 2003 95
[image:7.612.48.389.47.444.2]TABLE 5. Subject Area Mean Percentiles
zyxwvutsrqponmlkjihgfedcbaZYXWVUTSRQPONMLKJIHGFEDCBA
Mean percentile ranking
Subject area
zyxwvutsrqponmlkjihgfedcbaZYXWVUTSRQPONMLKJIHGFEDCBA
(3 semesters: 1996-1997) Accounting 41.5Economics 39.0 Management 30.0 Quantitative business analysis 42.5 Finance 32.3 Marketing 31.0 LegaVsocial environment 40.6 International business 53.1
TABLE 6. Multivariate Regression Results ( N
zyxwvutsrqponmlkjihgfedcbaZYXWVUTSRQPONMLKJIHGFEDCBA
=zyxwvutsrqponmlkjihgfedcbaZYXWVUTSRQPONMLKJIHGFEDCBA
297)Variable Coefficient
zyxwvutsrqponmlkjihgfedcbaZYXWVUTSRQPONMLKJIHGFEDCBA
t valuezyxwvutsrqponmlkjihgfedcbaZYXWVUTSRQPONMLKJIHGFEDCBA
P > tConstant 87.21 20.84
.oo
ACT English score 1.35 10.62
.oo
9-hour GPA 5.5 1 7.37
.oo
Age 0.8 1 6.97.oo
Gender (men = 1; women = 0) 4.91 4.94.oo
Total model R = 0.73.Total model adjusted R 2 = 0.53.
Total model F value = 83.48.
Total model p > F: .OO.
zyxwvutsrqponmlkjihgfedcbaZYXWVUTSRQPONMLKJIHGFEDCBA
ing the examinee’s standing in the array of all students who have taken the test.
Schools can use scores on standard- ized tests in determining course grades or as a condition for graduation (see Table 4, item 8). For example, our col-
lege currently is using business field test scores as a component of the grade in the business policy/strategy course. Schools could make further use of scores by requiring a minimum standard of performance-for example, a score within the 25th percentile-as a condi- tion of graduation. Livingston and Zieky (1982) provided guidance on methods for using standardized test scores in making decisions on matters such as graduation, course completion, the need for remedial instruction, and advanced placement.
Students should be made aware that evidence of good performance on a standardized test may be included on a resume, employment application, or graduate school admissions application (see Table 4, item 9). Particularly for a student whose grade point average is not outstanding, a high score on the ETS Major Field Test in Business or
other standardized test can shed a more favorable light on his or her ability or learning achievement.
Uses for Continuous Improvement Program development. Scores on stan- dardized tests can be a basis for curricu- lum changes (see Table 4, item 10). The data in Table 5 indicate a wide range of relative performance among the eight ETS business subject areas at our school and suggest priorities for considering curriculum changes. Course content may be modified or additional course work may be added in areas with relatively weak performance. As for pedagogy (see Table 4, item 1 l), areas with weak learn- ing outcomes may benefit from experi- mentation with more cases, inclusion of more team work, and requirement of more written assignments and oral pre- sentations. Last, schools may want to use test results as a basis for resource alloca- tion (see Table 4, item 12) by rewarding faculty members and departments whose students do well or improve. Alternative- ly, resources can be directed at improv- ing performance in a particular area by
such means as a discipline-focused lec- ture series.
Student development. Information from administering standardized achievement tests can be used for development of a predictive model of expected learning. Predictions from such a model can iden- tify at-risk students whose characteris- tics are associated with a low level of student learning (see Table 4, item 13). In Table 6, we provide such a model: We developed it to predict ETS test scores (and the level of learning indicated by the scores) when students have complet- ed lower-division course work. The independent variables are English ACT score, 9-hour GPA for Introduction to Financial Accounting and Principles of Economics I and 11, age, and gender. We used the English ACT score instead of the composite ACT score because the composite score does not lend itself to identification of deficiencies that can be addressed with specific course work. (We also evaluated the math ACT score as a predictor of learning in the business core, but its coefficient was not statisti- cally significant.) The information in Table 6 indicates that a 19-year-old
sophomore male student with an English ACT score of 18 and a 9-hour GPA of 2.00 has an expected ETS test score of 142.83 (18th percentile), whereas a 22- year-old sophomore female student with an English ACT score of 25 and a 9-hour GPA of 3.61 has a predicted score of 159.00 (59th percentile). When predict- ed ETS test scores are at or below a cer- tain percentile (e.g., the 25th), students might be required or advised to take remedial courses or be involved in spec- ified activities either as a condition of admission to upper-division business courses or as a postadmission program requirement. For example, these individ- uals could be required or encouraged to take the following steps:
Take an English proficiency exam- ination, followed by additional course work for those whose proficiency test results are below a specified standard (Table 4, item 14);
Retake any course in the 9-hour accounting/economics block until a minimum of a C grade is achieved (Table 4, item 15; in our study group
96 Journal
zyxwvutsrqponmlkjihgfedcbaZYXWVUTSRQPONMLKJIHGFEDCBA
of Education for Business [image:8.612.47.391.41.370.2]there were 88 students with ETS test scores at or below the 25th percentile who made a total of 25 Ds in the 9
hours, whereas the
zyxwvutsrqponmlkjihgfedcbaZYXWVUTSRQPONMLKJIHGFEDCBA
63 students at orabove the 75th percentile had no Ds whatsoever):
Participate in work-study programs to better integrate classroom learning and
real-world applications (Table
zyxwvutsrqponmlkjihgfedcbaZYXWVUTSRQPONMLKJIHGFEDCBA
4, item 16; as noted earlier, we surmised that thepositive association of age/gender and ETS test scores is related to exposure to the business environment): and
Work with mentors such as upper- division students, designated faculty members, or managers who would help develop good study habits and attitudes
conducive to success (Table
4,
zyxwvutsrqponmlkjihgfedcbaZYXWVUTSRQPONMLKJIHGFEDCBA
item 17). Of course, all of the actions listed abovecould be undertaken independently of predicted performance on the ETS examination. However, the advantage of linking the remediation process to the ETS test is that actual ETS test scores can be compared with earlier predic- tions to help determine if the remedia-
tion program is beneficial.
zyxwvutsrqponmlkjihgfedcbaZYXWVUTSRQPONMLKJIHGFEDCBA
Summary and Conclusions
More accountability for higher educa- tion in the United States means that insti- tutions and programs are being asked to demonstrate that resources are generat- ing intended outcomes. Accountability has therefore shifted the focus from pro- gram inputs and structure to results, par- ticularly student achievement. In this article, we have outlined steps for using standardized student-achievement test scores to draw conclusions about pro- gram and student performance and to make improvements. The process begins with careful test development or selec- tion, including the assurance that scores are reliable and are valid for their intend- ed purposes.
There are many uses of standardized achievement test results. Informational uses include making comparisons of individual examinees and groups of test takers, as well as documenting student achievement for program reviews. Test scores also can be used by schools for course and graduation requirements or by students on resumes and applica- tions. In the continuous improvement area, test results can be used as a cata-
lyst for curriculum or pedagogy changes. Schools also can develop pre- dictive models to identify at-risk stu- dents whose curricula and experiences can be enriched to improve learning outcomes.
In conclusion, assessment of student achievement as a component of a system of accountability can pay dividends in terms of better programs and more qual- ified students. Although such results can- not be expected if the school approaches assessment haphazardly or unenthusias- tically, we believe that addressing the issues outlined in this article will make assessment of student achievement a
more rewarding endeavor.
REFERENCES
AACSB-The International Association for Man- agement Education. (1994-1995). Achieving
quality and continuous impmvement through self-evaluation and peer review: Standards for accreditation, business administration and accounting. St. Louis, MO: Author.
AACSB-The Association to Advance Collegiate Schools of Business. (2002). Eligibility pmce-
dures and standards for business accreditation
(second working draft). St. Louis, MO: Author. Ackers, M. D., & Giacomino, D. E. (1997). Designing and implementing an accounting assessment program. Issues in Accounting Edu-
cation, 12, 259-280.
Allen,
zyxwvutsrqponmlkjihgfedcbaZYXWVUTSRQPONMLKJIHGFEDCBA
J. S., & Bycio, P. (1997). An evaluation of the Educational Testing Service Major FieldAchievement Test in Business. Journal of
Accounting Education, 15, 503-514.
Anderson, D. R., Sweeney, D. J., & Williams, T. A. (2002). Statistics for business and econom-
ics (8th ed.). Cincinnati: South-Western. Apostolou, B. A. (1999). Outcome assessment.
Issues in Accounting Education, 14, 177-197.
Ball State University, Offices of Academic Assessment and Institutional Research. (1992).
Assessment workbook. Muncie, IN: Ball State University.
Barak, R. J. (1977). Program reviews by statewide higher education agencies. New Directions for
Institutional Research, N(4). 67-90.
Barak, R. J., & Mets, L. A. (Eds.). (1995). Using
academic program review. San Francisco: Jossey-Bass.
Berdahl, R. 0. (1977). Legislative program evalu- ation. New Directions f o r Institutional
Research, IV(4). 35-66.
DeMong, R. F., Lindgren, J. H., Jr., & Perry, S. E. (1 994). Designing an assessment program for accounting. Issues in Accounting Education, 9, Ebel, R. L., & Frisbie, D. A. (1991). Essentials of
educational measurement (5th ed.). Englewood Cliffs, NJ: Prentice-Hall.
Educational Testing Service. (1997a). Compara-
tive data guide and descriptions of reports- Majorfield tests. Princeton, NJ: Author. Educational Testing Service. (1997b). Test admin-
istration manual-Major field tests. Princeton, NJ: Author.
Erwin, T. D. (1991). Assessing student learning
and development: A guide to the principles,
11-27.
goals, and methods of determining college out- comes. San Francisco: Jossey-Bass.
Ewell, P. T. (1987). Establishing a campus-based assessment program. In D. F. Halpern (Ed.).
Student outcomes assessment: What institutions stand to gain (pp. 9-24). San Francisco: Jossey- Bass.
Folger, J. K. (Ed.). (1977). Increasing the public accountability of higher education. New Direc-
tions f o r Institutional Research, IV(4). San
Francisco: Jossey-Bass.
Franklin, D. A,, & Tolbert, R. P. (1995). Maximiz- ing the use of pre-existing assessment results for improvement in higher education. Assessment
and Evaluation in Higher Education, 7, 37-44, Halpern, D. F. (Ed.). (1987). Studenr outcomes
assessment: What institutions stand to gain.
San Francisco: Jossey-Bass.
Hanson, L. K. (1996). Placement for success: The writing program placementkredit portfolio. In T .W. Banta, J. P. Lund, K. E. Black, & F. W. Oblander (Eds.), Assessment in pracrice:
Putting principles to work on college campuses
(pp. 199-203). San Francisco: Jossey-Bass. Herring, H. C. 111, & Izard, C. D. (1992). Out-
comes assessment of accounting majors. Issues
in Accounting Education, 7, 1-17.
Kimmell, S. L., Marquette, R. P., & Olsen. D. H. (1998). Outcomes assessment programs: His- torical perspective and state of the art. Issues in
Accounting Education, 13, 85 1-868.
Lawrence, J. K., & Solomon, L. C. (1981). Repu- tational ratings and undergraduate education assessment. New Directions for Institutional
Research, VIlI(l), 1-14.
Livingston, S . A., & Zieky, M. (1982). Passing
scores, a manual for setting standards of perfor-
mance
zyxwvutsrqponmlkjihgfedcbaZYXWVUTSRQPONMLKJIHGFEDCBA
on educational and occupational tests.Princeton, NJ: Educational Testing Service. Magruder, W. J., & Young, C. C. (1996). Value-
added talent development in general education. In T. W. Banta, J. P. Lund, K. E. Black, & F. W. Oblander (Eds.), Assessment in practice:
Putting principles to work on college campuses
(pp. 169-171). San Francisco: Jossey-Bass. Mirchandani, D., Lynch, R., & Hamilton, D.
(2001). Using the ETS Major Field Test in Business: Implications for assessment. Journal
of Education for Business, 77( I), 51-56.
National Commission on Excellence in Educa- tion. (1983). A nation at risk: The imperative
for educational reform. Washington, DC: U.S. Government Printing Oftice.
Nichols, J. 0. (1995). A practitioner's handbook
f o r institutional effectiveness and student out- comes assessment implementation (3rd ed.). New York: Agathon Press.
Nichols, J. 0.. & Nichols, K. W. (2000a). The
departmental guide and record book f o r student outcomes assessment and institutional effec- tiveness. New York: Agathon Press.
Nichols, J. O., & Nichols, K. W. (2000b). The
department head's guide to assessment imple- mentation in administrative and educational support units. New York: Agathon Press. Palomba, C. A., & Banta, T. W. (1999). Assess-
ment essentials. San Francisco: Jossey-Bass. Peterson, M. W., Erwin, J. M., & Wilson, R.
(1977). State-level performance budgeting.
New Directions f o r Institutional Research,
Porter, L. W., &. McKibbin, L. E. (1988). Man-
agement education and development: Drifr or thrust into the 2Ist century? New York: McGraw-Hill.
Staik, I. M., & Rogers, J. S. (1996). Listening to
your students. In T. W. Banta, J. P. Lund, K. E.
IV(4). 1-34.
NoveinbedDecember
zyxwvutsrqponmlkjihgfedcbaZYXWVUTSRQPONMLKJIHGFEDCBA
2003 97Black, and F. W. Oblander (Eds.), Assessmenr
zyxwvutsrqponmlkjihgfedcbaZYXWVUTSRQPONMLKJIHGFEDCBA
in practice: Putting principles to work on col-lege campuses (pp. 132-135). San Francisco: Jossey-Bass.
M. (2000). An assessment program for account-
ing: Design, implementation, and reflection. Young, C. C. (1996). Triangulated assessment
zyxwvutsrqponmlkjihgfedcbaZYXWVUTSRQPONMLKJIHGFEDCBA
ofIssues in Accounting Education, 15,
zyxwvutsrqponmlkjihgfedcbaZYXWVUTSRQPONMLKJIHGFEDCBA
553-581.zyxwvutsrqponmlkjihgfedcbaZYXWVUTSRQPONMLKJIHGFEDCBA
the major. In T. W. Banta, J. P. Lund, K. E.Troutt, W. E. (1981). Relationships between Black,
zyxwvutsrqponmlkjihgfedcbaZYXWVUTSRQPONMLKJIHGFEDCBA
& F. W. Oblander (Eds.), Assessment inregional accrediting association standards and practice: Putting principles to work on college Stivers, B. P., Campbell, J. E., & Hermanson, H. educational quality. New Directions for Institu- campuses (pp. 101-104). San Francisco:
tional Research, VIll( l), 45-60. Jossey-Bass.
98
zyxwvutsrqponmlkjihgfedcbaZYXWVUTSRQPONMLKJIHGFEDCBA
Journal ofzyxwvutsrqponmlkjihgfedcbaZYXWVUTSRQPONMLKJIHGFEDCBA
Education for Business