Implementation of Real Coded Genetic Fuzzy System for Rainfall
Forecasting
Tirana Noor Fatyanosa1 and Wayan Firdaus Mahmudy2
Faculty of Computer Science, Universitas Brawijaya, Malang, Indonesia 1[email protected], 2[email protected]
Abstract. This paper deals with rainfall forecasting using three meteorological data (wind speed,
temperature, relative humidity) which taken from Indonesian Agency for Meteorology, Climatology and Geophysics (BMKG) and NOAA Satellite and Information Service for Banyuwangi district. To forecast the rainfall, this paper proposes a Real Coded Genetic Fuzzy System (RCGFS) which utilizes real numbers as chromosome representation to determine the fuzzy membership function. The novel of real number representation is used to reach some point solutions if the range of solution is in the continuous area. The experiment results demonstrate that the RCGFS obtained 332 correct classifications with accuracy 92.22% for four rainfall classes. The better results are also obtained using elitist selection rather than the tournament selection. These results have proved the robustness of the RCGFS.
Keywords: Prediction, rainfall, fuzzy system, genetic algorithm.
1
INTRODUCTION
Indonesia is categorized as a tropical country because it is located at the equator. The characteristics of the tropical climate in Indonesia is a heavy rain, a little wind, and the temperature and humidity are high. The average rainfall in the lowlands in Indonesia is 180-320 cm (70-125 in) per year. While in some mountainous areas increased to 610 cm (240 in) per year [1].
The rain became one of the important source of livelihood for the people of Indonesia. Various benefits obtained from the rain, as a source of energy, water resources, until the economic resources of society, especially in the agricultural sector because Indonesia is an agricultural country.
In Indonesia, approximately 82.71% is agricultural land. Various kinds of agricultural production are produced in Indonesia specifically rice, sweet potatoes, soybeans, peanuts, corn, and the production of horticulture which consists of vegetables and fruits [2]. One of the agricultural areas is Banyuwangi which has food crops, horticulture, and plantation crops. The results of the agricultural sector in Banyuwangi are strongly influenced by climate change.
The climate change is marked on the changing rainfall patterns, an extreme climate that often occurs from floods or droughts, and rising temperatures and sea levels [3]. Therefore, proper handling should be done so that the results obtained from the agricultural sector becomes more leverage.
One way of handling to address the impact of climate change on agriculture is by forecasting the rainfall for the determination of the planting season in accordance with the intensity of rainfall that occurred for maximum results.
Forecasting the rain became very complicated because a lot of things that become the benchmark forecasting, among others, air humidity, wind direction, temperature, and things that become important parameters in forecasting. Additionally, forecasting rain must also be able to measure the frequency of daily rainfall, much of its outpouring, continuity of water, and others. Therefore we need an algorithm to solve the problems of forecasting rainfall.
To solve the problems non-optimal fuzzy system, in this study using the Real Coded Genetic Fuzzy System, which is a method of merging fuzzy and genetic algorithm (GA). The rationale for this method is to assist in determining the performance of fuzzy membership function, so the determination can be done without the help of experts and the results obtained are more optimal.
From this study, it is expected the application of Real Coded Genetic Fuzzy System in forecasting rainfall can be a solution for the government to determine the planting season agricultural products in order to maximize results.
2
RELATED WORKS
There are three ways to forecast the rainfall, using time series, using radar, or based on the relationship between meteorological indicators and rainfall. Different methodologies have been studied to solve the rainfall forecasting based on those ways, such as statistical method, numerical modelling, machine learning, and heuristic algorithm.
The statistical method is mostly used to modelling the rain from meteorological indicators such as temperature, wind, sea level, humidity, dew point and etc. Different statistical methods have been used. Partially Adaptive Classification Trees (PACT) was used by [10] to forecast rain over Puerto Rico. The result shows that the PACT is better than climatology and accomplishes aptitude over perseverance. Additionally, PACT is easier and natural than linear discriminant analysis. However, the results ought to be treated with some consideration since they depend on a single experiment with a limited number of cases. Moreover, PACT can be more effective if it’s combined with other models.
Besides PACT, another study conducted by [11] use First-order Markov Chain, Logistic model, and Generalized Estimating Equation (GEE) to modelling the rainfall over the Eastern Thailand. They utilize the normal of downpour volume from 15 climate stations and 52 variables from meteorological indicators. The statistical method in this study has been proved that it is successful to observe the weather and modelling the rain.
Another statistical method used to modelling the rain is GSTAR-SUR which implemented by [12]. They use the method to forecast the rainfall in area Tengger, East Java. However, the RMSE from the forecast result is extensive.
The numerical modellings which often used to forecast the rainfall are Generalized Linear Models (GLMs) and Markov Chain Models (MCM). Chandler & Wheater [13] use the GLMs which can manage abnormal amounts of variability, for example, those commonly connected with every day precipitation successions.
Fuzzy inference also used to predict the rainfall by [8] using Tsukamoto Fuzzy Inference System. Based on their carried out experiments, they observed that the proposed approaches deliver better results than GSTAR-SUR. However, they only use the time series data for rainfall without considering the meteorological data such as temperature, wind speed, and relative humidity which will cause inaccurate prediction.
Besides using Tsukamoto Fuzzy Inference System, Mamdani Fuzzy Inference System also used by [4] to forecast rainfall between December to May in Khorasan province. The outcomes demonstrated that FIS model is promising and productive and can effectively forecast the amount of the rainfall. However, there were numerous missing values which will cause inaccuracies. The model could have been further enhanced by giving all the more training data.
The fuzzy logic also used by [5] to predict rainfall using temperature and wind speed data. They recommend the fuzzy logic to predict the rainfall and its volume. However, the membership function is manually determined. This will cause the inappropriate result. In order to determine the appropriate membership function, the GA is used in this research.
3
METHODOLOGY
Every day, we experience various issues that don’t have any available answer with the exception of making a decision based on our past encounters. These induced choices are evaluated and accepted with real circumstances by either perceptions or estimations [6].
Rainfall forecasting should have an accurate prediction because it affects agricultural production. Usually, we asked experts to determine the level of rainfall. However, according to [6], expert knowledge is known as an unclear or uncertain expression and not in the type of any measured quality. Furthermore, Pawar & Ganguli [8] said that answers using words rather than using numbers are frequently more helpful for maintenance engineers. Among the few soft computing methods, fuzzy inference system is one of the methods that transform numerical inputs to linguistic. However, fuzzy inference system does not have the capacity of gaining from the given information and the fuzzy rules must be created by human experts.
The process of building a fuzzy rule base is difficult and may turn out to be very complicated if the quantity of input and output is growing. In order to solve this problem, there is a hybridization of fuzzy inference system and the genetic algorithm called Genetic Fuzzy System (GFS), which produces an automatically fuzzy rules from the information [9].
Besides produces the rules bases, according to Karr and Gentry (as cited in Ross [14]), in order to optimize the membership function we can use the Real Coded Genetic Algorithm (RCGA). RCGA is the GA which uses the real number as chromosome representation in an array. RCGA is used because when the function is complex and need a lot of generation, binary representation will take time. RCGA help the optimization faster than binary representation [16, 17]. The combination of GFS and RCGA will produce Real Coded Genetic Algorithm (RCGFS) which is used in this study.
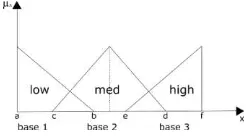
For example, the membership function used for all of the input and output use triangles as shown in Fig. 1 below.
Fig. 1. Membership functions for input and output are triangles
Where low, medium, and high are the linguistic membership. Base 1, base 2, and base 3 are the range of the linguistic membership. Base 1 is the length from a to b. Base 2 is the length from c to d. Base 3 is the length from e to f. In this research, we use triangular membership function shape. The membership function shape for medium linguistic is an isosceles triangle.
Based on Fig. 1, the right side of the membership function is compelled to have the right point wedge at the maximum limit of the fuzzy variable range. While the left side of the membership function is compelled to have the left-point wedge at the minimum limit of the fuzzy variable range. The RCGFS is used to find the bases’ lengths of the 14 membership functions.
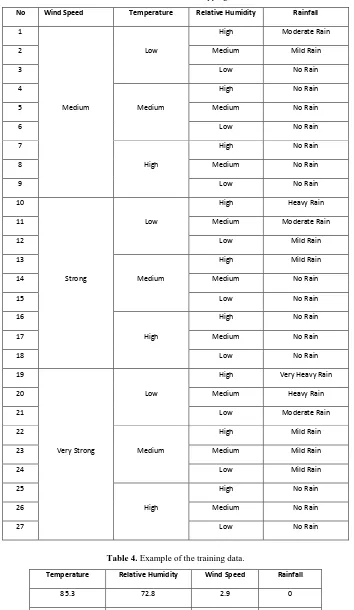
Table 3. Functional Mapping.
No Wind Speed Temperature Relative Humidity Rainfall
1
Table 4. Example of the training data.
Temperature Relative Humidity Wind Speed Rainfall
Table 5. The rainfall range.
Very Heavy Rain Rainfall > 100mm
Table 6. Attribute’s Range.
Attribute Range Base Range Base
Wind Speed (knots) 0 – 20.2 0 – 20.2 1 - 3
Temperature (ºF) 75.2 – 87.4 0 – 12.2 4 – 6
Relative Humidity (%) 51.8 – 94.7 0 – 42.9 7 - 9
Rainfall (mm) 0 – 1965.5 0 – 1965.5 10 - 14
Chromosome Representation. Chromosome representation for membership function is shown in Table 5.
Table 7. Chromosome Representation.
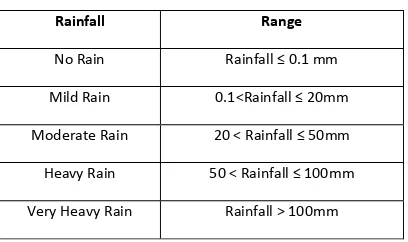
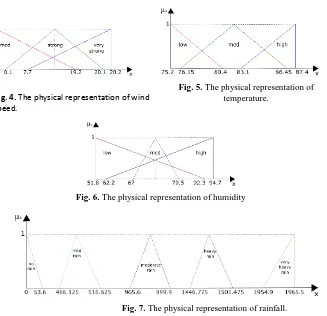
The physical representation of the chromosome is shown in Fig. 2-5. The base values of Fig. 2 is obtained from Table 5, columns Base 1, Base 2, and Base 3. From the chromosome, the base value for wind speed is 19.2, 20, and 12.5. Then the range for Medium is 0 and 19.2. For Strong fuzzy class, as in this research we use the isosceles triangle, then the midpoint of the triangular is 20.2/2 = 10.1. So, the range from the midpoint to maximum or minimum limit of Strong is 20/2=10. Then the range for Strong are 10.1 - 10 = 0.1 and 10.1 + 10 = 20.1. The range for Very Strong fuzzy class is 20.2-12.5=7.7 and 20.2. This scheme also uses for temperature and relative humidity.
F
ig. 4. The physical representation of wind speed.Fig. 5. The physical representation of
temperature.
Fig. 6. The physical representation of humidity
Fig. 7. The physical representation of rainfall.
Fitness Function. This study uses the fitness function as follows.
� = − (2) = √ ∑= − ′ (3)
The square errors from the difference between the output value and the actual value are used
to determine the fitness. The actual value is using the data from Table 2.
Reproduction. The crossover used in this research is extended intermediate recombination which uses the following formula [18]:
= + � − � = , … , (4)
α randomly selected on the interval [-0.25, 1.25]. Two parents were selected to do the crossover (P1 and P2), the offspring of C1 and C2 is calculated based on the following formula [16]:
� = � + � � − � � = � + � � − � (5)
4
DATASET
The source of meteorological indicators is from NOAA Satellite and Information Service and the source of rainfall data is from Indonesian Agency for Meteorological, Climatological, and Geophysics (Badan Meteorologi, Klimatologi, dan Geofisika or BMKG). This study uses Banyuwangi stations with 1200 data from the year of 2010 to 2016. Banyuwangi is a city that included in East Java province in Indonesia. The attributes that used in this study is meteorological data (temperature, relative humidity, and wind speed) and rainfall data. Each meteorological attribute has three linguistic membership (low, medium, high). Rainfall has five linguistic membership (no rain, mild rain, moderate rain, heavy rain, very heavy rain).
5
EXPERIMENTAL RESULT
The dataset used in this paper will be divided into two parts, 70% of data will be used as data training (840 records) and 30% will be used as testing data (360 records). The parameters used in this study are determined as follows:
Crossover rate is 0.4 Mutation rate is 0.2
Number of generation is 1000 Elitist Selection
By using those parameters, we run the RCGFS ten times and conduct results of best, average and worst RMSE as shown in Table 6.
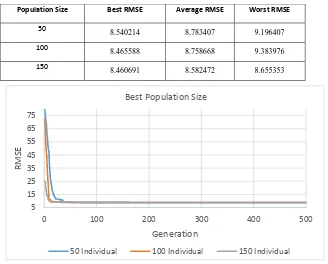
Table 8. Best Population Scenario using elitist selection.
Population Size Best RMSE Average RMSE Worst RMSE
50
Fig. 8. Best Population using Elitist Selection
From Table 6, the lowest RMSE was achieved when the population size is 150. The RMSE value decreases in accordance with the increasing number of population. It can be concluded that the higher population size, the lower RMSE that can be achieved and increases the accuracy of the RCGFS.
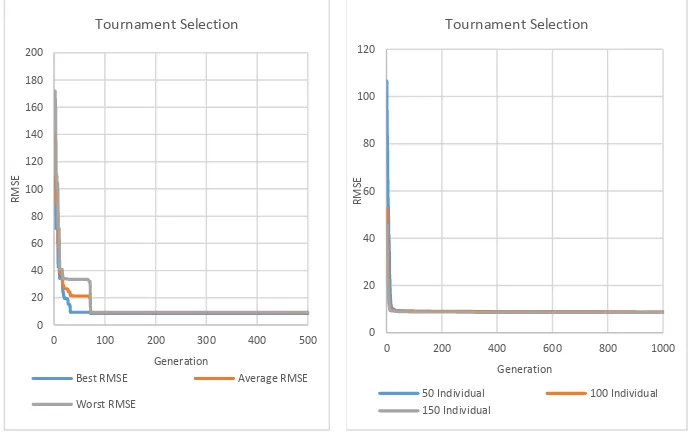
In order to expand the differing qualities of solutions, we compare the elitist and tournament selection to determine the best selection method for RCGFS within 50 individual. After done some test with tournament selection, we found that the result is not better than the elitist selection and the implementation on real-coded resulted in early convergence.
As shown in Fig. 7, the RCGA using tournament selection encounter premature convergence under 100 generation. In order to overcome this problem, we decided to use random injection every ten generation and test it for 50, 100, and 150 individuals (see Fig. 8).
Fig. 9. Tournament Selection Fig. 10. Tournament Selection with random
injection.
Table 9. Best Population Scenario using Tournament Selection with random injection. Population Size Best RMSE Average RMSE Worst RMSE
50 8.618335 8.790474 9.303635
100 8.454973 8.860081 9.384711
150 8.589251 8.623194 8.664468
After comparing the best, average, and worst RMSE using elitist (Table 6) and tournament selection (Table 7), we found that the tournament selection is worse than elitist selection. Those low RMSE values in elitist selection indicate that elitist selection can be used as the selection method for RCGFS.
Fig. 8 shows that when the population size is 50, the graph converges after the 898th generation, while when the population size is 100, the graph converges after the 445th generation. When the population size is 150, the graph converges after the 418th generation. It can be concluded that the higher population size, the faster its convergence.
Table 10. Best Crossover Rate and Mutation Rate Scenario.
Crossover Rate Mutation Rate Average RMSE
0.3 0.3 8.813995
0.4 0.2 8.758668
0.5 0.1 8.857979
As shown in Table 8, the best average RMSE is conducted when the crossover rate is 0.4 and the mutation rate is 0.2.
After done some testing to get the best population size, selection method, crossover rate, and mutation rate, we obtained the following parameter values.
Population size is 150 Number of Generations is 195 Crossover Rate is 0.4
Mutation Rate is 0.2
Selection method is Elitist Selection
In order to find out the accuracy after obtained the best parameter of genetic algorithm and the membership function of fuzzy inference, we examined scenarios as follows.
1. Five rainfall classes: no rain (<=0.1 mm), mild rain (<=20mm), moderate rain (<=50 mm), heavy rain (<=100 mm), and very heavy rain (>100 mm).
2. Four rainfall classes: no rain or mild rain (<=20 mm), moderate rain (<=50 mm), heavy rain (<=100 mm), and very heavy rain (>100 mm).
Using 30% testing data, the first scenario obtained 245 correct classifications with accuracy 68.05% and the second scenario obtained 332 correct classifications with accuracy 92.22%. The RMSE and fitness value for both scenarios are respectively 150.104547 and 849.895453. The second scenario obtained higher accuracy than the first scenario. This happens probably because the number of data is too small.
6
CONCLUSIONS
This paper has shown the using of Real Code Genetic Fuzzy System (RCGFS) to solve the rainfall forecasting. The real number representation of genetic algorithm demonstrates that the RCGFS is reliable and very helpful in determining the membership function. After conducting some experiment, we reached three conclusions. First, the higher population size, the lower RMSE that can be achieved, and increases the accuracy of the RCGA. Second, the higher population size, the faster its convergence for both selection method (elitist and tournament selection). Third, the membership function obtained from RCGFS can be used for predicting rainfall with four rainfall classes (no rain or mild rain, moderate rain, heavy rain, very heavy rain).
Future Works. The RCGFS could improve by also use Genetic Algorithm to determine the base rules and the shape of the membership function. Furthermore, in order to increase the correctness, it could use more meteorological indicators and also use larger datasets.
REFERENCES
1. Gale T. Indonesia. http://www.encyclopedia.com/topic/Indonesia.aspx. Accessed 2 May 2016. (2007)
2. Ministry of State Secretariat of the Republic of Indonesia. Sumber Daya Alam. http://indonesia.go.id/en/potential/natural-resources. Accessed 2 May 2016.
3. Efendi R, Suwarti. Anticipation of Climate Change By Assembling Maize Varieties Tolerant to Drought and Inundation (Antisipasi Perubahan Iklim Dengan Perakitan Varietas Jagung Toleran Kekeringan Dan Genangan). Semin Nas Inov Teknol Pertan 133–142. (2013)
4. Fallah-Ghalhary GA, Mousavi-Baygi M, Nokhandan MH. Annual Rainfall Forecasting by Using Mamdani Fuzzy Inference System. Res J Environ Sci 3:400–413. (2009)
5. Jimoh RG, Olagunju M, Folorunso IO, Asiribo MA. Modeling Rainfall Prediction using Fuzzy Logic. Int J Innov Res Comput Commun Eng 1:929–936. (2013)
6. Hasan M, Shi XF, Tsegaye T, et al. Rainfall Prediction Model Improvement by Fuzzy Set Theory. 2013:1–11. doi: 10.4236/jwarp.2013.51001. (2013)
7. Agboola A, Gabriel A, Aliyu E, Alese B. Development of a fuzzy logic based rainfall prediction model. Int J Eng Technol 3:427–435. (2013)
8. Wahyuni I, Mahmudy WF, Iriany A. Rainfall Prediction in Tengger Region-Indonesia Using Tsukamoto Fuzzy Inference System. 1th Int Conf Inf Technol Inf Syst Electr Eng 1–11. (2016)
9. Pawar PM, Ganguli R. Structural Health Monitoring Using Genetic Fuzzy Systems. Media. doi: 10.1007/978-0-85729-907-9. (2011)
10. Carter MM, Elsner JB. A Statistical Method for Forecasting Rainfall over Puerto Rico. Weather Forecast 12:515– 525. doi: 10.1175/1520-0434(1997)012<0515:ASMFFR>2.0.CO;2. (1997)
11. Ingsrisawang L, Ingsriswang S, Luenam P, et al. Applications of Statistical Methods for Rainfall Prediction over the Eastern Thailand. In: Proc. Int. MultiConference Eng. Comput. Sci. pp 17–20. (2010)
12. A. Iriany, W. F. Mahmudy A, Nisak S. GSTAR-SUR Model for Rainfall Forecasting in Tengger Region , East Java. In: 1st Int. Conf. Pure Appl. Res. Univ. Muhammadiyah Malang. pp 1–8. (2015)
13. Chandler RE, Wheater HS. Analysis of rainfall variability using generalized linear models: A case study from the west of Ireland. Water Resour Res 38:10-1-10–11. doi: 10.1029/2001WR000906. (2002)
14. Nhita F, Adiwijaya. A rainfall forecasting using fuzzy system based on genetic algorithm. 2013 Int Conf Inf Commun Technol 111–115. doi: 10.1109/ICoICT.2013.6574557. (2013)
15. Ross TJ. Fuzzy Logic with Engineering Applications, Third. Wiley. doi: 10.1002/9781119994374. (2010)
16. Mahmudy WF. Evolutionary algorithms (Algoritma Evolusi). Progr Inf Technol Comput Sci Univ Brawijaya, Malang 1–101. (2013)
17. Mahmudy WF, Marian RM, Luong LHS. Real Coded Genetic Algorithms for Solving Flexible Job-Shop Scheduling Problem - Part I: Modelling. Adv Mater Res 701:359–363. doi: 10.4028/www.scientific.net/AMR.701.359. (2013) 18. Mühlenbein H, Schlierkamp-Voosen D. Predictive Models for the Breeder Genetic Algorithm I. Continuous