Environmental Assessment
Hot Mud Flow
East Java, Indonesia
Final Technical Report:
United Nations Disaster Assessment and
Coordination mission in June & July 2006
and
Follow-up mission in July 2006
Published in Switzerland, 2006 by the Joint UNEP/OCHA Environment Unit Copyright © 2006 Joint UNEP/OCHA Environment Unit
This publication may be reproduced in whole or in part and in any form for educational or not-for-profit purposes without special permission
from the copyright holder, provided acknowledgement is made of the source. Joint UNEP/OCHA Environment Unit
Palais des Nations CH-1211 Geneva 10 Switzerland
Tel. +41 (0) 22 917 3484 - Fax +41 (0) 22 917 0257
http://ochaonline.un.org/ochaunep
Table of Contents
Executive Summary ...1
Overview ...1
Summary of findings, conclusions and recommendations ...1
1 Introduction ...3
Situation ...3
2 Findings and Observations ...4
Banjar Panji I well...4
Mud volcanos ...4
Toxic gas: hydrogen sulphide...5
Humanitarian and infrastructural impact...5
Emergency response ...6
Overview of the affected site...8
Environmental assessment ...9
Review of existing sampling and data analysis ...9
Independent sampling and analysis by the UNDAC team ...11
Analysis of the environmental assessment ...12
3 Conclusions and Recommendations...16
Overview ...16
Conclusions...16
Recommendations ...18
4 Future Outlook and Indicative Risk Assessment...20
Marine environment exposure...20
Agricultural land exposure...20
Annex I Sampling, Analysis and Results of the Impact Screening Carried Out By The UNDAC Team and RIVM/VROM. ...25
Introduction ...25
Sampling strategy...26
Summary of results from analysis done at RIVM, Netherlands...28
Dry weight of the mud ...30
Analysis of inorganic compounds in mud ...31
Measurements of air with handheld measurement devises ...32
Analysis of organic compounds in air by canisters...32
Analysis of organic compounds in air by charcoal tubes...35
Analysis of organic compounds in air by passive samplers ...38
Analysis of radiation ...40
Results ...42
Annex II Possible Options for Mud Management...43
Annex III Proposed Setup of Mud Quality Monitoring Program ...44
Annex IV Follow-up Mission Report ...48
Executive Summary
Overview
Since 29 May 2006, a mud volcano has been emitting ‘hot mud’ in Sidoarjo district in East Java, Indonesia. Mud volcanoes are geological phenomena due to subsurface over-pressurized mud layers. The cause of the eruption has not yet been established. However, it may be linked to the gas exploration activities by Lapindo Brantas at the Panjar Banji I well.
The mud volcano emits mud at an average rate of more than 40,000 m3/day, and has inundated 4 adjacent villages, displacing nearly 7,000 people. Almost 12,000
(accumulative) medical treatments have been carried out, mainly for people affected by the release of hydrogen sulphide gas.
On 20 June, the Indonesian Ministry of Environment (KLH) made a request for technical assistance with the identification of environmental impacts of the ‘mud flow’ to the United Nations Office of Humanitarian Affairs (OCHA). OCHA Environmental Emergencies Section in collaboration with the OCHA Field Coordination Support Section deployed a United Nations Disaster Assessment and Coordination (UNDAC) team with five environmental experts from 25 June to 6 July 2006. Following a second request made by the Indonesian Ministry of Environment at the end of the UNDAC emergency mission on 27 July 2006, an environmental expert was redeployed to Indonesia. The government of Switzerland kindly provided the expert for this follow up mission.
This report contains the technical findings, conclusions and recommendations, including results of analysis by the Institute for Public Health and the Environment in the Netherland from the first mission, as well as the report of the follow-up mission. The latter is in Annex 4.
Summary of findings, conclusions and recommendations
Findings and conclusions
The following is a brief summary of the findings and conclusions. More detail on each of these conclusionscan be found in section 3 of this report.
• The current impact on human health and the environment is low due to containment of the mud in above ground basins.
• The above-ground basins are not a sustainable solution.
• Sudden release of the mud into an aquatic environment will kill the aquatic ecosystem and have serious humanitarian consequences.
• Normal levels of organic compounds (including phenols) have been found in the mud.
• Air samples and measured air quality do not show concentrations of toxic gasses (including hydrogen sulphide) above expected levels.
• More research and monitoring of the quality of the mud is needed before final statements can be made on the toxicity of the mud. However, organic compounds, and heavy metals including phenol and mercury are not found to be above normal levels.
Recommendations
The following is a brief summary of the recommendations. More detail on each of these recommendations can be found in section 3 of this report.
• Reinforcement of the above-ground basins is urgently needed.
• The local environmental authorities should strengthen their coordination, analysis and interpretation capacity focusing on heavy metals (in particular mercury) and salinity/conductivity (as an indicator for the dispersion of the mud).
• Developent of a medium term strategy based on a number of options, including a worst case scenario is urgently required.
• Measurement of the radioactive isotopes is required to determine the re-usability of the mud.
• The UN agencies currently involved should continue to monitor the humanitarian impact on the affected population.
1 Introduction
Situation
On 29 May 2006, two days after the earthquake that struck Yogyakarta, Indonesia and killed almost 6,000 people, a mudflow stemming from or near the Banjar Panji I gas drilling well in Sidoarjo district in the East Java Province was reported. The mud was estimated to be flowing at a rate of 5,000m3/day and rapidly flooded surrounding
areas, displacing thousands of people. In addition, between 800 and 900 people had to seek medical treatment after exposure to and inhalation of a poisonous gas
On 20 June 2006, the United Nations Office for Coordination of Humanitarian Affairs (OCHA) received a request for technical assistance from the Indonesian Ministry of Environment. In coordination with the United Nations Resident Coordinator (a.i.), it was decided to deploy a United Nations Disaster Assessment and Coordination (UNDAC) team with environmental experts.
International collaboration
The governments of the Netherlands and Switzerland kindly provided UNDAC trained environmental experts for this mission. In addition, the Netherlands’ Government made available two associate experts of the Dutch National Institute of Public Health and the Environment (RIVM) for sampling and analysis. OCHA’s Environmental Emergencies Section (EES) provided a team leader for the mission.
Together with the Indonesian Ministry of Environment, it was agreed that the team would provide technical assistance to the environmental authorities with the
identification of environmental impacts of the mud, and based on the outcomes, provide recommendations for mitigation. In particular, independent sampling and analysis would be undertaken -in the field and Jakarta- with a primary aim to establish indications to determine the ‘toxicity’ of the mud. This criterion is the most important parametre to determine environmental impact of the mud and will also determine options for the management of the mud (i.e., should the mud be classified as toxic waste or as resource for agricultural purposes).
This report
This technical report provides an overview of the findings, conclusions and
recommendations of the team as at the end of their field mission. Extensive scientific support has been received from various research institutions in the Netherlands, in particular from the Policy Support Team for Environmental Incidents (BOT-Mi). A final report will be compiled and presented at a later stage and will also include the
analysis of samples – and interpretation – undertaken at the Netherlands Institute for Public Health and Environment.
2 Findings and Observations
This section provides an overview of the findings and observations obtained during the field visits, sampling and analysis, and review of existing data and interviews with important actors in East Java Province.
Banjar Panji I well
The Banjar Panji I is an exploration well that was commissioned to determine the feasibility of exploiting an underlying rich natural gas formation (named the ”Kunjung formation”). The well had reached a depth of over 3,000 metres when three different mud flows started. The first and largest flow started on 29 May and is situated at 200 metres south west from the drilling well. On 2 June, a second mudflow appeared, while the next day, a third mud emission started. The second two mud flows were situated between 800 and 1000 metres north east from the gas drilling well and apparently both stopped flowing on 5 June.
Mud volcanos
Volume of mud
On 21 June, Lapindo Brantas calculated the volume of mud emitted since 29 May, based on surface and depth measurements using GPS. On that date, the volume was estimated to be 1.1 million m3 of mud. The depth of the mud was ranging from 3.5 to
6.4 metres around the source of the mudflow, to 0.1 to 0.6 metres at the edges of the flood zones. Although the flow is not continuous and the mud volcano is intermittently active, the estimated average volume of emitted mud over that period would have been over 40,000 m3/day. At the time of writing, the flow is continuing.
Based on interviews with the Lapindo Brantas geologists, it appears that the mudflow stems from a geological phenomenon known as a mud volcano. Mud volcanoes are not uncommon and can occur both on the surface and at ocean bottoms worldwide. They are often associated with petroleum deposits.
Reportedly, the island of Java has experienced a number of mud
volcanoes before, of which one has now been active for several years. This active mud volcano is situated
approximately 200 km west of Sidoarjo district, near Purwodadi.
A possible explanation for the cause of the mud volcano eruption is that a pressurized mud layer, which also contained hydrogen sulphide (H2S), was
pierced by the gas drilling well or found its way ‘spontaneously’, vertically upwards to the surface.
A mud volcano is a small volcano-shaped
cone of mud and clay, usually less than 1-2 m tall. These small mud volcanoes are built by a mixture of hot water and fine sediment (mud and clay) that either (1) pours gently from a vent in the ground like a fluid lava flow; or (2) is ejected into the air like a lava fountain by escaping volcanic gas and boiling water. The fine mud and clay typically originates from solid rock--volcanic gases and heat escaping from magma deep below turn groundwater into a hot acidic mixture that chemically changes the rock into mud- and clay-sized fragments.
Government investigations
Government investigations are ongoing to establish whether the drilling of the exploration well has caused the mud volcano to erupt and no speculations can be made until the findings of these investigations have been published.
Toxic gas: hydrogen sulphide
As mentioned above, the eruptions were associated with the release of a toxic gas, most likely to have been hydrogen sulphide (H2S). Measurements, reported by the
Indonesian Ministry of Environment, stated that hydrogen sulphide levels reached 700 parts per million (ppm) on the first day (apparently at the source), while the concentration dropped to 3 ppm on the second day of the events, down to 0 ppm
on the third day. Although no further information about these measurements is known, the concentration of 700 ppm would suggest a direct and acute impact on human health – and can be fatal.
It is assumed that the hydrogen sulphide was contained in the over pressurised mud layer. During the site visits and sample taking, detectors were used (to ensure on-site safety of the team) and no hydrogen sulphide was detected. In addition, large
numbers of people on and near the mud volcano confirmed that no release of toxic gases was taking place.
Humanitarian and infrastructural impact
The mudflow has inundated the adjacent villages of Renokenongo, Siring, Jatirejo and Kedungbendo. As of 4 July, the total number of displaced people was up to 6,915 (1,788 households). Local authorities have provided temporary shelter in the Pasar Baru Porong (a market due to be opened in July) for 5,664 people and in the Balai Desa Renokenongo for another 717 people. In addition, 534 people have been hosted by families in safer locations. There are 1,382 school-aged children among the total number of Internally Displaced People (IDP).
Four hospitals and 13 health posts have treated an accumulated number of 11,494 people, of which 215 were inpatients. On 4 July, 34 people were still in local
hospitals/health posts. Patients have been treated for acute respiratory tract infection and digestive problems, such as diarrhoea.
On 15June 2006, the Indonesian Department of Health sent three metric tons of supplementary baby and seven metric tons of fortified biscuits to Sidoarjo District. Food and non-food items (including instant noodles, coffee, sugar, mineral water, rice, milk, biscuits, cooking oil, soaps, and sleeping mats) have been provided by a range of entities, such as the House of Representatives, local government, local community
Hydrogen sulphide is a colorless, toxic,
flammable gas that is responsible for the foul odor of rotten eggs. It often results when bacteria break down organic matter in the absence of oxygen, such as in swamps, and sewers. It also occurs in volcanic gases, natural gas and some well waters. Source:
Affected infrastructure
Facilities (other than houses) inundated by the mud include 17 schools, and 15 factories. Compensation will be provided to the affected population and labourers affected by the closure of the factories.
The types of small and medium sized factories inundated by the mud, include clocks and watch production, steel construction, food production (drinks and crackers), and Ratan furniture production. Hazardous materials used in these factories may have formed a secondary pollution into the mudflow.
The Surabaya-Gempol toll road has been closed as mud is flowing from the southern flood zone over a stretch of 50 metres into the northern flood zone (see the aerial overview on page 10 below). The local police have deployed around 250 personnel per day to guard the abandoned houses, provide security in the temporary shelters, and direct traffic.
There have been tensions between communities on both sides of the toll road protection dam when the mud levels started rising and threatened to flood villages. Reportedly villagers broke the dam, resulting in flooding on both sides.
Emergency response
As the mud volcano and mudflow has not been declared a national disaster, the overall coordination and responsibility for the emergency response rests with the provincial authorities, i.e., the Governor of East Java. Based on their assessments of the situation, the provincial authorities have established the following three main objectives:
• stem the flow
• manage the social impacts
• minimize the environmental impacts.
Stem the flow
The first objective is to stem the flow of mud from the source. A snubbing unit1 will be
used through the existing well in order to try to stop the mud flow. This is based on the assumption that the mud volcano was caused by the piercing of the subsurface over pressurised mud layer by the gas drilling well. It is expected that this effort will take approximately one month (until the end of July).
If this measure fails, a relief well can be drilled as a second subsurface action to stop the mudflow. Drilling a relief well can take up to three to four months and so far there are no indications that this will guarantee stoppage of the mudflow. The snubbing unit and relief well efforts are carried out by Lapindo Brantas (owner of the gas drilling well), BP Migas (Regulatory Body for Oil and Gas of Indonesia) and ESDM
(Department of Energy and Natural Resources).
1
Snubbing is described at the act of putting drill pipe into the wellbore when the blowout preventers (BOPs) are closed and pressure is contained in the well
Manage the social impacts
The second objective of the authorities is to manage the social impacts associated with the mudflow. Local government authorities, including Satlak (the district
implementation unit for disaster management) are trying to mitigate the social impacts by providing shelter and food for displaced people, arrange payment of compensation for loss of work and income, and further sensitize the affected population to the
response activities. No international organisations have been involved in the response activities of this disaster.
Minimize environmental impacts
The third objective is to minimize the environmental impacts by containment of the mud in above-ground basins or ‘ponds’. These efforts are led by the Indonesian Ministry of Environment, in cooperation with the Sepuluh November Institute of Technology of Surabaya (ITS), and the Army Corps of Engineers.
The above ground basins are constructed with two metre high earth walls, and are filled with the mud by both gravity and the use of pumps. The table below shows the planned basins including their surface and capacity. These basins should be finished and filled before the end of July. However, taking the average emission of 40,000 m3/day experienced during the first three weeks, the first phase of basins will be filled within 26 days.
Above ground basin
A B C 1 2 3 4 Total
Surface (ha) 24 32 12 12 80
Volume (‘000 m3) 360 320 180 180 1040
Overview of the affected site
The image below provides an overview of the active mud volcano, various above-ground basins, and the affected villages superimposed on a satellite image taken in 2002. The shaded area shows the mud flood zones north and south of the Surabaya-Gembol toll road reflecting the situation around 20 June.
The village of Renokenongo is situated only a few hundred metres south of the mud volcano and is entirely inundated by 2 metres of mud. The village of Siring is situated in the northwest corner of the Northern Flood Zone. The village of Jatirejo is on the bottom left corner of the image (to the right of the railway track).
Basin A and B
(Northern Flood Zone)
Basin C
Basin 3 and 4
Active Mud Volcano
Panjar Banji I
gas drilling well
Basin 1 and 2
Southern Flood
Environmental assessment
The overall objective of the environmental assessment of the current situation is to provide an indication of the hazards to the population and the impact on the
environment. The impact of the current situation can best be estimated by reviewing the possible hazard (defined by the characteristics and toxicity of substances
present), the quantity and the exposure of the main receptors as shown in the equation below:
IMPACT = QUANTITY x HAZARD x EXPOSURE
The main receptors for which the hazard, quantity and exposure need to be evaluated are the:
• population that is potentially exposed to the mud and air originating from the mud volcano, and
• local environment (e.g. paddy fields, fish ponds, rivers and the marine environment).
Review of existing sampling and data analysis
Different institutions (government and universities) are currently involved in analysing samples taken from the mud. Unfortunately, because there was no agreed
methodology, objective, nor analytical procedures, it is impossible to accurately compare the existing data.
UNDAC team review
The UNDAC team organized a meeting with the organisations involved in monitoring (sampling, measurement and analysis) as part of the environmental impact
assessment. The meeting was attended by Bapedalda, ITS and two other
laboratories, as well as the Deputy-Minister of Environment. An overview of the sampling, measurement, analysis and conclusions were presented and shared.
From the presentations made, the sampling strategy seemed to be good given the limited capacity and the amount of analysis. The basic analytical methods used to identify inorganic compounds were considered in principle, valid. Due to the time restrictions of the mission no detailed evaluation of the total procedures of sample handling and preparation could be carried out.
It was found during the review that analytical procedures applied by the individual institutions were not always valid, or adapted to the specific requirements of the emergency – in particular, irrelevant parameters and incorrect procedures were observed. Not all details of the sample methodology, procedures and data were accessible. Accredited laboratories (such as the forensic laboratory) could, however, be used to improve the credibility of the data.
Review of analysis approach
Organic compounds are analysed by a method that is not valid or distinctive enough to identify the individual compounds. Phenol is reported to be present but the methods applied would not allow its detection.
Due to the lack of an agreed analytical procedure tailored to the emergency, samples were analysed using routine sets of parameters and analysis that do not necessarily apply to the current situation. For instance, water quality parameters such as BOD and COD) are not relevant for the analysis of mud as mud does not contain organic matter. These irrelevant parameters contributed to the confusion to interpret the samples.
To obtain an overall analysis of the mud, water is not separated from the solid phase. In addition, the results are compared with ambient quality standards that apply to the discharge of water to the surface water. No dry weight content of the samples is determined. However, soil quality standards might need to be applied depending of the use or disposal of the mud at a later stage. For the comparison with soil quality standards, the concentrations of the components in the solid phase requests the analysis of the dry weight content.
Air quality is analysed and monitored for a number of specific components, however not for Volatile Organic Compounds (VOC), which could be expected to be present in the mud and vapour from the volcano at the high temperatures.
Summary of data and analyses
Listed below is a summary of the data and analyses conducted by the different institutions to date:
• All concentrations of metal and mercury are low and below the standards in the samples shown. Discussion however made clear that some samples showed high concentrations of metal. The mud seems to be not homogenous. A secondary source of pollution (possibly from the industrial facilities) might be an explanation for these concentrations.
• Air concentrations of SO2, H2S, CO, NO2 are low (most below detection limits)
• It is not clear if concentrations of H2S where high during the incident and if the in the
press reported effects are linked to emissions.
• Apart from the overall monitoring group formed by KLH, the forensic laboratory, agricultural university of Bogor (West Java), and Public Works authorities where also investigating the quality of the mud. No formal interaction between these groups was noted. The facilities of the forensic laboratory are expected to meet the quality
standards needed (accredited laboratory including quality control and cross referencing).
• The release of analytical results and consolidation of the results did not meet with the pace of the emergency and the required decision making process.
• Difficulties are noted with the interpretation of the available information and dealing with uncertainties.
• The analysis carried out where resource driven (normal measurements and
• No timeframes, sequence nor deadliness for the delivery of consolidated factual information where set.
Independent sampling and analysis by the UNDAC team
In addition to the review of the data and analyses by the local institutions, UNDAC team conducted some independent sampling and analysis. The objective was to provide a reference and verification of a complete investigation (information gathering, sampling, analysis and interpretation) to the environmental authorities to identify toxic substances and subsequent hazards to the population and environment.
Identification of organic and inorganic compounds
In order to provide the most added value to the existing data, priority was given to the identification of organic and inorganic compounds present in the mud and air
(sampling and analysis) of the emission point and at locations where the population is exposed. A detailed description of the research strategy, methodology is provided in an annex (I).
Additional activities
The following additional activities were also carried out:
• Rehearsal and supervision of analysis of organic compounds in the mud samples taken by KLH.
• Joint identification and interpretation of the results of samples with high heavy metal contents together with ITS. Provide interpretation of the results according to the Dutch water-, sludge- and soil standards. The Dutch water quality standards add to the currently used Indonesian standards of “discharge water into surface waters”. No sludge or soil standards were available. The intended use, discharge or disposal of the mud determines what standards should be applied (water, sludge or soil).
Results
Upon return of the team, RIVM (Dutch National Institute of Public Health and Environment in the Netherlands) undertook a full scan and identification of organic and inorganic substances in the mud and air samples taken by the UNDAC team for cross referencing. In addition radiation levels of the mud were measured. The results are summarised below:
• Heavy metals in mud: all low, most of them like normal background values. • Organic compounds in air (by active and passive samplers): concentrations of
benzene and toluene elevated at the source and the “exposure” location. Also xylenes and hydrocarbons are elevated. Based on the spectrum of this, different components and the fact that the “upwind” reference sample contains the same spectrum (although lower concentrations) we draw the conclusion that these components do not originate from the mud. Near to the sampling sites human activities take place (digging, pumping of mud, traffic) that allow concentrations of substances in this spectrum to occur. The upwind location was influenced less by these kind of activities.
• Radiation: normal background values or even below detection limits for all types of radiation.
Analysis of the environmental assessment
Summary of methodology
The methodology used by the UNDAC team to assess the impact of the current situation and possible future developments takes into account the:
• danger (characteristics and toxicity of substances present) • quantity, and
• exposure of the main receptors.
Each element of the equation has to be assessed, and estimated to be LOW,
MEDIUM or HIGH. The overall impact is HIGH only if the impact of all three elements is HIGH. All currently available data is taken into account including an expert
judgment of the validity and representation.
Impact assessment
The indicative impact assessment is presented in the table below. This describes the individual assessment of the three components (mud, water and air) and the overall assessment of the environmental impact.
Comments on the assessment
The analysis of heavy metals in the current samples are expected to be valid, although they have not yet been fully checked. The validity of results and further review will be undertaken by crosschecking the analysis at RIVM (Dutch National Institute of Public Health and Environment).
The samples reviewed and analysed indicate a heterogeneous composition of the mud. It is not determined whether this is due to the geological composition of the mud or due to a source of secondary pollution. There is a variation in the concentrations of heavy metals between samples taken by KHL and ITS.
Assessment matrix of the current situation
Component Critical parameter
Impact Quantity/Concentration Hazard- to the
receptor
metals LOW MEDIUM AND HIGH Local elevation of heavy metals and especially mercury. The quality is not homogenous and
Limited, because of lack of contact (direct and indirect via intake/consumption/food chain) and good binding of toxicant to sludge variation not known due to shortage of analysis. Expected to be
homogeneous.
HIGH
Toxic compounds LOW Limited and localised no vulnerable eco-systems
LOW
Not relevant due to small quantities and dilution in air.
Mud Salinity LOW HIGH LOW/ MEDIUM LOW LOW volatile compounds are expected to only be emitted directly form the source, not from the mud.**
HIGH
Not relevant due to small quantities (low
concentration) and dilution in air*
Notes:
*Although the concentrations in the ambient air are low and no health effects are to be expected, the compounds have a low detection level for humans. In other words, the UNDAC team and the population note a “smell nuisance”.
3 Conclusions and Recommendations
Overview
The UNDAC mission has based its results on the best available information at the time of writing. The emergency situation surrounding the mud volcano and the many actors working at (parts of) the solutions might result in conclusions and recommendations loosing their validity when more information becomes available or the situation changes over time. The team has done its best to specify, where possible, the assumptions it had to make as well as the argumentation for them.
It should be explicitly stated that due to the large volume of the mud being emitted and areas covered, the conclusions and recommendations in this report should be seen as indicative only. A final report will be presented, including the analysis of samples and interpretation, undertaken by the RIVM in the Netherlands.
Conclusions
Listed below is a brief summary of the concluding points. Each of these points is explained on the pages below:
• impact on human health and the environment • sustainability of the above-ground basins • impact of sudden release of the mud • toxicity levels
• risks
• existing measuring and monitoring capacity.
Impact on human health and the environment
Samples and analysis indicate that the current impact of the physical and chemical characteristics of the mud on human health and environment is expected to be low, mainly due to the current practice of containment of the mud in above-ground basins. As an emergency response measure, the containment of the mud in above-ground basins is the best solution. Containment in basins limits exposure of the mud to humans and the environmental impact.
Sustainability of above-ground basins
The above-ground basins are considered unsustainable due to the following factors:
• dam wall collapse
• approaching rainy season (overflow, saturation)
• continuous emission of mud (average 40,000 m3/day).
Dam wall collapse has been observed during the mission. The cause of the dam wall collapse is unknown. The rainy season normally starts in October, with mean total rainfall increasing from 47 mm in October to 105 mm in November and 327mm in
of the dam walls, resulting in dam wall collapse. There is no guarantee that the mudflow can or will be stopped. In any case, the mud flow will continue for months, and in a worst-case scenario, for years and exacerbate the humanitarian situation.
Impact of sudden release of mud
The mud is characterised by high salinity (comparable to sea water) and high turbidity (sediments) and can create anaerobe conditions.
Sudden release of the mud into an aquatic environment (river, sea) will result in ‘killing’ the aquatic ecosystem with serious implications for those people dependent on these ecosystems (fish ponds, sea fishing). Release of mud onto agricultural land will destroy crops. In addition to these acute effects on agricultural land and aquatic environment, heavy metals, if proven to be present, will be released into the environment and into the food chain with possible long-term impacts on human health.
Toxicity levels
Due to some conflicting results of analyses conducted by local authorities, local universities and the UNDAC team, the main conclusion is that more research and monitoring of the quality of the mud is needed before final statements can be made on the toxicity of the mud. It is not determined whether the elevated levels of pollutants found by the local authorities are due to the natural composition or due to secondary pollution by, for example, the flooded industrial facilities in the affected area.
Some results that can be reported are:
• Media reports indicated the presence of phenols in the mud. None of the samples examined showed levels of organic compounds, including phenols, above normal expected background concentrations. Although the samples are not representative for the entire area of mud, there are no indications of significant deviations.
• Air samples and measured air quality do not show concentrations of organic
compounds and specific toxic gasses (including hydrogen sulphide) above expected background concentrations.
• Based on samples and analysis, combined with existing data, indications exist that the mud content is not homogeneous. However, results of analysis performed by the UNDAC team and RIVM do not confirm this.
• Some samples taken and analyzed by the local authorities (and university) show elevated levels of toxics, such as heavy metals, including mercury. Samples and analysis performed by the UNDAC team and RIVM (Netherlands) do not show elevated levels of organic compounds or heavy metals.
• Radiation has been measured at RIVM and proven to be of background level for all types of radiation (alpha, beta and gamma).
Other risks
Existing measuring and monitoring capacity
The existing capacity for measurement and monitoring of air, mud and water quality is sufficient to provide appropriate information to the decision-making process in the emergency response activities. However, there is a clear need for increased
coordination and interpretation of data. There are many actors involved in sampling and measurement (i.e., KLH, ITS, Airlangga University, Agricultural entities, public works entities) but an agreed monitoring and analysis programme has not been agreed
established, resulting in incomparable data and possible misinterpretation. This poses a serious risk for decision-makers.
Recommendations
Listed below is a brief summary of the recommendations. Each of these points is explained on the pages below:
• reinforce above-ground basins
• strengthen coordination, analysis and interpretation capacity • develop a medium term strategy
• determine re-usability of the mud
• continue to monitor humanitarian impact.
Reinforce above-ground basins
Enforcement of existing above-ground mud basins is urgently needed to prevent damage and dispersion caused by collapse. If the existing dam walls prove to be too weak to contain the mud, there is an urgent need for enforcement of the dam walls in order to maintain the high-level of containment (and therefore low exposure).
Strengthen coordination, analysis and interpretation capacity
The environmental authorities should strengthen their capacity for coordinating, analysing and interpreting the analyses focusing on the following critical parameters: heavy metals (in particular mercury) and salinity/conductivity (as indicator for the dispersion of mud). To achieve this, the following steps should be undertaken.
Step Action 1 Agree on a method to obtain representative samples from the large
surface area. For example:
a) divide all above-ground basins into imaginable rosters of 12 blocks of equal size.
b) take an equal number of samples from each roster block and mix to obtain a representative sample from each roster block.
2 Mix the representative samples from each block to obtain a representative sample from the entire basin.
Step Action 3 Carry out a Robins test to verify the types of substances measured.
Note: For a Robins test, the environmental authorities should have the same blind sample analyzed by all entities involved and coordinate the agreement of methodology to be used for future analysis.
Develop a medium term strategy
There is an urgent need to develop a medium term strategy – parallel to the ongoing emergency response - based on a number of options, including a worst-case scenario. The environmental authorities should carry out a full and detailed environmental impact assessment of all options for mud management as soon as possible, involving local expertise and integrating humanitarian and social impacts. The next section outlines some possible scenarios for re-use and disposal of the mud.
Determine reusability of the mud
Measurements for radioactive isotopes (such as uranium and thorium) should be undertaken to determine the re-usability of the mud. Radioactive isotopes could occur as Naturally Occurring Radioactive Materials and are associated with geological formations.
Monitor humanitarian impact
It is recommended that the UN agencies, through the UN Technical Working Group for Disaster Risk Reduction (UN TWG) continue to monitor the humanitarian impact of this mudflow on the affected population. In case the situation deteriorates, affecting larger numbers of people in the area, the UN TWG, together with the Government of
4 Future Outlook and Indicative Risk Assessment
As a first step towards developing medium term strategies, as well as providing
guidance on possible options for re-use of the large quantities of mud, scenarios have been roughly developed in an attempt to identify the environmental impacts of different options.
The scenarios include discharging into the aquatic environment (river and marine) and exposure of agricultural land to the mud. Annex II provides further details on the possible options for mud management.
Marine environment exposure
The aquatic environment can be exposed to the mud for example, if a decision is made to deposit the mud at sea. This situation would occur in the event of a dam collapse or overflow, as the sea is located only few kilometres from the source. The mud would follow natural gravity and be transported via rivers to the sea (if no preventive measures are taken).
Impact
Numerous fish ponds are situated in the coastal zone. Apparently the marine environment, including former mangroves, has been degraded by the aquaculture activities. The table below provides an overview of expected impacts.
Agricultural land exposure
Impact of exposure of the MARINE environment Component Critical
parameter
Impact Quantity/Concentration Hazard- to the receptor Exposure
of ecosystem
Exposure of humans
Mud Heavy
metals MEDIUM MEDIUM Local elevation of heavy metals and especially
not assessed MEDIUM: Through bioaccumulation and bio concentration humans will be exposed by consumption of seafood.
Mud Salinity LOW HIGH:
Concentrations expected
Not relevant LOW Not relevant
Mud Suspended
solids HIGH HIGH: The suspended solids are composed of more than condition on the sea floor and clocking of fish gills)
HIGH
Mud flow dilution is not expected to take place at the discharge point because of the difference of density between the mud and the sea water. The mud will rapidly cover the sea bottom and
The mud is characterized by high turbidity (sediments) and possible creation of anaerobe (no oxygen) conditions.
Aquatic environment of river systems exposure Component Critical
parameter
Impact Quantity/Concentration Hazard- to the receptor Exposure
of ecosystem
Exposure of humans
Mud Heavy
metals MEDIUM MEDIUM Local elevation of heavy metals and especially mercury.
Mud Salinity HIGH HIGH:
Concentrations expected to be
solids HIGH HIGH: The suspended solids is composed of more than 90% clay river bed and clocking of fish gills)
HIGH Not relevant
Impact of exposure of the agriculture lands Component Critical
parameter
Impact Quantity/Concentration Hazard- to the
receptor
metals MEDIUM MEDIUM: Local elevation of mercury slightly exceeding the Dutch sludge standards for agricultural use as organic fertilizer. Also slightly exceeding the Dutch
Environmental Assessment Report Page
Annex I Sampling, Analysis and Results of the Impact
Screening Carried Out By The UNDAC Team and
RIVM/VROM.
Introduction
Prior to the design of a sampling strategy a first reconnaissance has been carried out to the sampling and analysis already done by local actors. The strategy of sampling and analysis carried out by UNDAC is based on the question: what has the UNDAC team to add to the work done already considering our available
equipment and expertise? The analysis of UNDAC-samples is partly done by one of the team members using the facilities of the Indonesian Ministry of Environment and partly at RIVM in the Netherlands. Based on the available resources and data, the undac team decided to contribute with the following activities and expertise:
1. Perform a complete investigation (information gathering, sampling, analysis and consolidation) to be able to carry out an independent environmental impact assessment. Priority was given to the part of the investigation that where not covered by the existing response. The activities include:
Identification of the organic and inorganic compounds present in the mud and air (sampling and analysis) of the emission point and at the locations where the population is exposed (detailed description of the research strategy, methodology is provided in this annex).
2. Radiation measurements of the mud (alpha, beta and gamma radiation) 3. Rehearsal and supervision of analysis of organic compounds in the mud
samples taken by KLH.
4. Think along to identify and interpret the results of samples with high heavy metal contents (ITS). Provide interpretation of the results according to the Dutch water-, sludge- and soil standards. The Dutch water quality standards add to the currently used Indonesian standards of “discharge water into surface waters”. No sludge or soil standards were available. The intended use, discharge or disposal of the mud determents what standards should be applied (water, sludge of soil).
5. Perform at RIVM (Dutch National Institute of Public Health and Environment in the Netherlands) a full scan and identification of organic and inorganic substances in the mud and air samples taken by the Undac team for cross referencing. Full analysis will be performed and results submitted after completion of the mission.
6. Interpretation of results and overall impact assessment.
Environmental Assessment Report Page 26 Hot Mud Flow East Java, Indonesia
Technical Report July 2006
Sampling strategy
The overall objective of the quick scan of the environmental impact of the current situation is to have an indication on the hazards to the population and the impact on the environment. Impact of the current situation can be estimated by reviewing the possible danger (characteristics and toxicity of substances present), the quantity and the exposure of the main receptors.
In formula: IMPACT = QUANTITY x HAZARD x EXPOSURE_of receptor
In case of the mudvulcano the two main receptors for which the hazard, quantity and exposure need to be evaluated are the population that is potentially exposed to the mud and air originating from the mudvulcano and the local environment (soil and water).
The following sampling strategy is applied to identify the (potential) impact on the population and the environment:
Impact of air pollution
The hazard, quantity and exposure of the mud can be estimated by type and
concentration of the substances present in the ambient air at the location where the population is exposed (receiving point) and where mud/slurry is emitted by the mud volcano. In practical terms this means the need to identify and quantify the emission of hazardous substances in the air (directly from the source and from the mud). Emissions of H2S, aromatic carbons, SO2 are expected. In order to both identify the hazardous substances present and to monitor the possible exposure of the
population different sampling techniques are used, varying in sampling time. The techniques used range from instantaneous sampling and handheld measurement equipment (to identify the present substances and concentrations at a certain time) to passive sampling badges providing information about the average concentration during several days. An overview of the sampling activities is provided in Table
AppIV-1 and Fig AppIV-1. Table AppIV-2 provides a detailed list of the sampling activities.
Impact of the mud
The hazard, quantity and exposure of the mud can be estimated by type and concentration of the substances present in the mud. This estimation is done at the source (for clear identification purpose) and at the location of possible exposure (where population or specific environments can be in contact with the mud) In practical terms this means the need to identify and quantify the hazardous
Environmental Assessment Report Page
!!@@INCLUDE FIG AppIV-1: MAP of UNDAC sampling locations, send separately by mail due to magnitude of file.
Table AppIV-1 Overview of samples and results
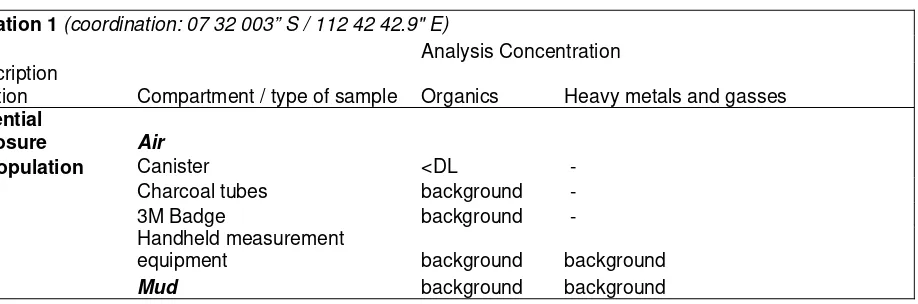
Location 1 (coordination: 07 32 003” S / 112 42 42.9" E)
Analysis Concentration Description
location Compartment / type of sample Organics Heavy metals and gasses
Potential
exposure Air
of population Canister <DL -
Charcoal tubes background - 3M Badge background -
Environmental Assessment Report Page 28 Hot Mud Flow East Java, Indonesia
Technical Report July 2006
Location 2 (coordination : 07 31 369" S / 112 428" E)
Source Air
Canister <DL - Charcoal tubes background - 3M Badge background -
Handheld measurement equipment background background Mud background background
Location 3 (coordination: 07 32 008 S / 112 42 448 E) Reference
location Air
Canister <DL Charcoal tubes background
Handheld measurement equipment background background
Soil background background
<DL: Below detection limits.
Summary of results from analysis done at RIVM,
Netherlands
Heavy metals in mud: All low, most of them like normal background values. Organic compounds in air (by handheld measurement devices, active and passive samplers): concentrations of benzene and toluene elevated at the source and the “exposure” location. Also Xylenes and hydrocarbons are elevated. Based on the spectrum of this different components and the fact that the “upwind” reference sample contains the same spectrum (although lower concentrations) we draw the conclusion that this components do not originate from the mud. Near to the sampling sites human activities take place (digging, pumping of mud, traffic ed) that very well allow this
concentrations in air of substances in this respective spectrum to occur. The upwind location was influenced less by this kind of activities. No hydrogen sulfide (H2S) was measured.
Organic compounds in mud: no major elevations detected nor expected based on components in air (volatile substances would be found in air as well if present).
Radiation: normal background values or even below detection limits for all types of radiation.
Results in detail
Environmental Assessment Report Page
Locations and analysis
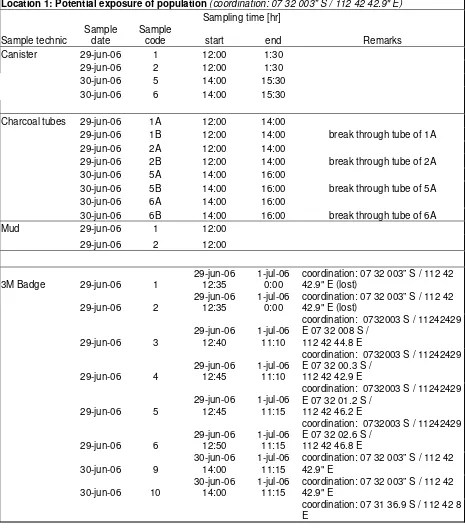
Table AppIV-2. UNDAC samples and measurements
Location 1: Potential exposure of population (coordination: 07 32 003” S / 112 42 42.9" E) Sampling time [hr]
Sample technic Sample date Sample code start end Remarks
Canister 29-jun-06 1 12:00 1:30 29-jun-06 2 12:00 1:30
30-jun-06 5 14:00 15:30 30-jun-06 6 14:00 15:30
Charcoal tubes 29-jun-06 1A 12:00 14:00
29-jun-06 1B 12:00 14:00 break through tube of 1A 29-jun-06 2A 12:00 14:00
29-jun-06 2B 12:00 14:00 break through tube of 2A 30-jun-06 5A 14:00 16:00
30-jun-06 5B 14:00 16:00 break through tube of 5A 30-jun-06 6A 14:00 16:00
30-jun-06 6B 14:00 16:00 break through tube of 6A
Mud 29-jun-06 1 12:00 29-jun-06 2 12:00
3M Badge 29-jun-06 1 29-jun-06 12:35 1-jul-06 0:00 coordination: 07 32 003” S / 112 42 42.9" E (lost)
29-jun-06 2 29-jun-06 12:35 1-jul-06 0:00 coordination: 07 32 003” S / 112 42 42.9" E (lost)
29-jun-06 3 29-jun-06 12:40 1-jul-06 11:10
coordination: 0732003 S / 11242429 E 07 32 008 S /
112 42 44.8 E
29-jun-06 4 29-jun-06 12:45 1-jul-06 11:10
coordination: 0732003 S / 11242429 E 07 32 00.3 S /
112 42 42.9 E
29-jun-06 5 29-jun-06 12:45 1-jul-06 11:15
coordination: 0732003 S / 11242429 E 07 32 01.2 S /
112 42 46.2 E
29-jun-06 6 29-jun-06 12:50 1-jul-06 11:15
coordination: 0732003 S / 11242429 E 07 32 02.6 S /
112 42 46.8 E
30-jun-06 9 30-jun-06 14:00 1-jul-06 11:15 coordination: 07 32 003” S / 112 42 42.9" E
Environmental Assessment Report Page 30 Hot Mud Flow East Java, Indonesia
Technical Report July 2006
Location 2: Source (coordination : 07 31 369" S / 112 428" E)
Charcoal tubes (SKC) 29-6-06 3A 16:00 18:00
29-6-06 3B 16:00 18:00 break through tube of 3A 29-6-06 4A 16:00 18:00
29-6-06 4B 16:00 18:00 break through tube of 4A Mud 29-6-06 3 16:00:00 +/- 15 cm deep
29-6-06 4 16:00:00 +/- 15 cm deep 3-7-06 5 11:30:00 +/- 15 cm deep 3-7-06 6 11:30:00 +/- 15 cm deep
3M badge 7 29-jun-06 16:00 1-jul-06 13:00coordination: 07 31 36.9 S / 112 42 8 E
8 29-jun-06 16:00 1-jul-06 13:00coordination: 07 31 36.9 S / 112 42 8 E
Location 3: Reference location/ nu mud influence (coordination: 07 32 008 S / 112 42 448 E)
Canister 3-jul-06 7 10:45 12:45 3-jul-06 8 10:45 12:45
Charcoal tubes 3-jul-06 7A 10:45 12:45
3-jul-06 7B 10:45 12:45 3-jul-06 8A 10:45 12:45 3-jul-06 8B 10:45 12:45 Soil (reference) 3-jul-06 7 11:30
3-jul-06 8 11:30
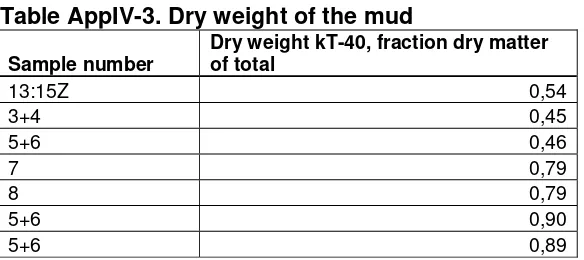
Dry weight of the mud
Dry weight of the mud is measured to make comparison of the results with soil standards possible (fractions of pollutants in ug/kg-dry substance). The mud is dehydrated at 40 degrees Celsius. The dry weigh contents of the mud samples is given in table Table AppIV-3. It is noted that the mud consists of very fine clay particles settling and drying slowly.
Table AppIV-3. Dry weight of the mud
Sample number
Dry weight kT-40, fraction dry matter of total
13:15Z 0,54 3+4 0,45 5+6 0,46 7 0,79 8 0,79 5+6 0,90 5+6 0,89
Environmental Assessment Report Page
Analysis of inorganic compounds in mud
Analysis of chlorate, nitrate and sulfate
Chlorate, nitrate and sulfate are analyzed using an ion chromatographic method. Ions are separated by bringing the samples in to a fluid flow and leading it trough a column with ion switch. The ions are measured by conductivity detection after chemical suppression.
Analysis of Phosphate ( ortho-P )
Phosphate is analyzed using an automatic photometre. The sample is mixed with a solution of molybdaat, antimony and ascorbinacid, as a result a blue coloured antimony fosformolybdatcomplex as formed. The extinction is measured at 800 nm to detect the present quantity orthophosphate.
Analysis of Ammonium
Ammonium is analysed by Berthelot respons: ammonia is chlorinated to
monochloramine. After oxidation a blue-green complex is formed. The ammonium is measured by absorption at 660 nm.
Table AppIV-4a Inorganic compounds in mud
Sample name
Mud 2 Oost-Java 13:15 624,9 4,48 0,000 0,224 0,2990 2065 Mud 3+4 Mix 876,9 5,96 0,000 6,308 0,0466 2708 Mud 5+6 mix 1264,8 6,765 0,000 17,721 0,0218 3766 Soil 7 5,1 0,061 0,064 11,023 1,3449 123,2 Soil 8 7,7 0,101 0,643 13,685 1,4397 119,9
Analysis of heavy metals
The samples are destructed using aqua regia (nitrohydrochloric acid) following Inductively Coupled Plasma Mass Spectrometry (ICP-MS) analyses of the heavy metals.
Table AppIV-4b, concentrations of metals in the mud
Environmental Assessment Report Page 32 Hot Mud Flow East Java, Indonesia
Technical Report July 2006
Organic compounds in mud are analyzed in Indonesia. No major elevations of organic compounds are found nor are indications found in the analysis of the air besides the mud that high concentrations of organic compounds would be present.
Measurements of air with handheld measurement devises
With handheld measurement equipment a direct reading of the concentrations at the sampling moment and location are provided. The equipment measures specific components individually. The results of the measurements are not highly accurate and are used for screening purposes, personal protection and a first impression. The components that are measured during several points in time and locations (during all other sampling occasions) are:
Total hydrocarbons with photo ionisation detector (multi PID2)
H2S, NH3, SO2, HCN, CO, CO2, O2 en PH3 using electrochemical cells Combustible gasses using an explosion alarm monitor.
No unexpected elevations are noted during the various measurements.
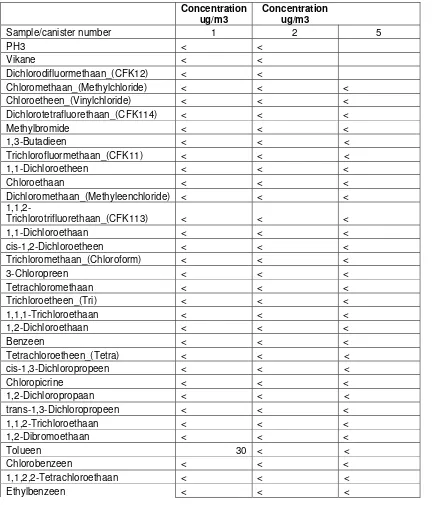
Analysis of organic compounds in air by canisters
Environmental Assessment Report Page
quantitative analysis. In addition to the charcoal tubes and passive samplers the canisters allow analysis of the air without the use of an absorbent (such as charcoal). The absence of the absorbent to trap and desorb the components eliminates possible inaccuracies due to trapping of desorption characteristics of certain components. Due to the relative small quantities of air analyzed the detection limits are higher in comparison to analysis of the samples taken with the charcoal tubes and passive samplers.
Table App. V-a, Organic compounds in air sampled by canisters, analyzed in The Netherlands at RIVM
Chloromethaan_(Methylchloride) < < < Chloroetheen_(Vinylchloride) < < < Dichlorotetrafluorethaan_(CFK114) < < <
Methylbromide < < < 1,3-Butadieen < < < Trichlorofluormethaan_(CFK11) < < <
1,1-Dichloroetheen < < < Chloroethaan < < < Dichloromethaan_(Methyleenchloride) < < <
1,1,2-Trichlorotrifluorethaan_(CFK113) < < < 1,1-Dichloroethaan < < < cis-1,2-Dichloroetheen < < < Trichloromethaan_(Chloroform) < < <
3-Chloropreen < < < Tetrachloromethaan < < < Trichloroetheen_(Tri) < < < 1,1,1-Trichloroethaan < < < 1,2-Dichloroethaan < < <
Benzeen < < <
Tetrachloroetheen_(Tetra) < < < cis-1,3-Dichloropropeen < < <
Chloropicrine < < < 1,2-Dichloropropaan < < < trans-1,3-Dichloropropeen < < < 1,1,2-Trichloroethaan < < < 1,2-Dibromoethaan < < <
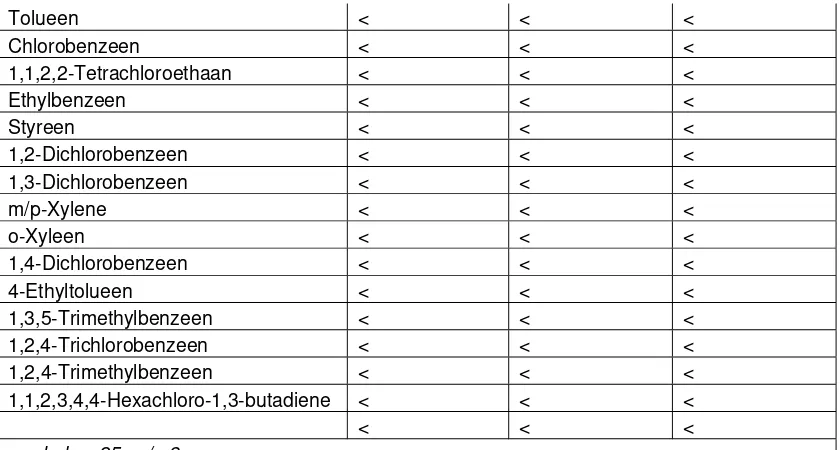
Tolueen 30 < <
Chlorobenzeen < < < 1,1,2,2-Tetrachloroethaan < < <
Environmental Assessment Report Page 34 Hot Mud Flow East Java, Indonesia
Technical Report July 2006
Styreen < < <
1,2-Dichlorobenzeen < < < 1,3-Dichlorobenzeen < < <
m/p-Xylene < < <
o-Xyleen < < <
1,4-Dichlorobenzeen < < < 4-Ethyltolueen < < < 1,3,5-Trimethylbenzeen < < <
1,2,4-Trichlorobenzeen < < < 1,2,4-Trimethylbenzeen < < < 1,1,2,3,4,4-Hexachloro-1,3-butadiene < < <
< = below 25 ug/m3
Concentration ug/m3
Sample/canister number 6 7 8
PH3 < < <
Vikane < < <
Dichlorodifluormethaan_(CFK12) < < < Chloromethaan_(Methylchloride) < < < Chloroetheen_(Vinylchloride) < < < Dichlorotetrafluorethaan_(CFK114) < < <
Methylbromide < < < 1,3-Butadieen < < < Trichlorofluormethaan_(CFK11) < < <
1,1-Dichloroetheen < < < Chloroethaan < < < Dichloromethaan_(Methyleenchloride) < < <
1,1,2-Trichlorotrifluorethaan_(CFK113) < < <
1,1-Dichloroethaan < < < cis-1,2-Dichloroetheen < < < Trichloromethaan_(Chloroform) < < <
3-Chloropreen < < < Tetrachloromethaan < < < Trichloroetheen_(Tri) < < < 1,1,1-Trichloroethaan < < < 1,2-Dichloroethaan < < <
Benzeen < < <
Tetrachloroetheen_(Tetra) < < < cis-1,3-Dichloropropeen < < <
Environmental Assessment Report Page
Tolueen < < <
Chlorobenzeen < < < 1,1,2,2-Tetrachloroethaan < < <
Ethylbenzeen < < <
Styreen < < <
1,2-Dichlorobenzeen < < < 1,3-Dichlorobenzeen < < <
m/p-Xylene < < <
o-Xyleen < < <
1,4-Dichlorobenzeen < < < 4-Ethyltolueen < < < 1,3,5-Trimethylbenzeen < < <
1,2,4-Trichlorobenzeen < < < 1,2,4-Trimethylbenzeen < < < 1,1,2,3,4,4-Hexachloro-1,3-butadiene < < <
< < < < = below 25 ug/m3
Table App. V-b, Organic compounds in air sampled by canisters, analyzed by Undac expert in Indonesia at Ministry of Environment
@@ RAMON will send later
Analysis of organic compounds in air by charcoal tubes
The charcoal tubes are used with a calibrated pump to sample a continuous flow during a required sampling period (often chosen to be several hours). After desoprtion of the trapped pollutions in the air the analysis of the components is done at the laboratory using GC-MS techniques that allow identification of components and highly accurate quantitative analysis. Due to the relative large quantities of air sampled, the detection limits are low.
Table App. VI-a, Organic compounds in air sampled by charcoal tubes,
analyzed in The Netherlands at RIVM
Concentrations of standard reference components in ug/m3 air
Environmental Assessment Report Page 36 Hot Mud Flow East Java, Indonesia
Technical Report July 2006
Concentrations of standard reference components in ug/m3 air
tolueen 20 < 1 18 < 1 11 < 1 10 < 1 17 < 1 7 < 1 6 < 1
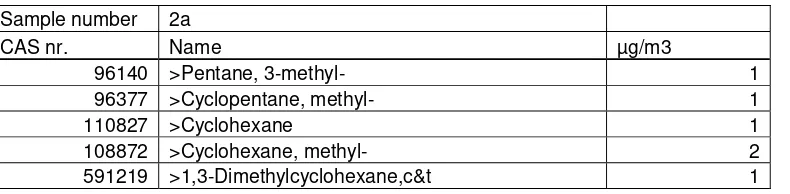
Concentrations of components outside standard reference set* in ug/m3 air
Sample number 1a
CAS nr. Name µg/m3
Environmental Assessment Report Page
Sample number 2a
CAS nr. Name µg/m3
96140 >Pentane, 3-methyl- 1 96377 >Cyclopentane, methyl- 1 110827 >Cyclohexane 1 108872 >Cyclohexane, methyl- 2 591219 >1,3-Dimethylcyclohexane,c&t 1
*Concentrations of compounds outside the standard reference set are calculated based on the response of toluene. The results are therefore not of the highest accuracy but are valid to be used as indications.
Table App. VI-b, Organic compounds in air sampled by charcoal tubes, analyzed by Undac expert in Indonesia at Ministry of Environment
Environmental Assessment Report Page 38 Hot Mud Flow East Java, Indonesia
Technical Report July 2006
Analysis of organic compounds in air by passive samplers
Passive samplers are used to sample the air during a long period (often chosen to be several days). The resulting average concentrations during these longer periods allow good insight in the average exposure of the population. After desoprtion of the trapped pollutions in the air the analysis of the components is done at the laboratory using GC-MS techniques that allow identification and highly accurate quantitative analysis. Due to the relative large quantities of air sampled, the detection limits are low.
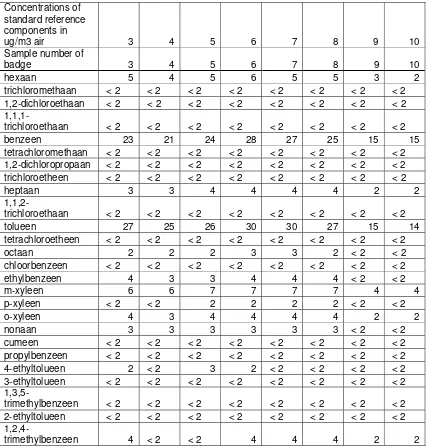
Table App. VII, Organic compounds in air sampled by passive samplers, analyzed in the Netherlands at RIVM
Environmental Assessment Report Page
1,3-dichlorobenzeen < 2 < 2 < 2 < 2 < 2 < 2 < 2 < 2 1,4-dichlorobenzeen < 2 < 2 < 2 < 2 < 2 < 2 < 2 < 2 Decaan 3 4 3 4 4 4 3 2
1,2,3-trimethylbenzeen < 2 < 2 < 2 < 2 < 2 < 2 < 2 < 2 1,2-dichlorobenzeen < 2 < 2 < 2 < 2 < 2 < 2 < 2 < 2 cymeen < 2 < 2 < 2 < 2 < 2 < 2 < 2 < 2 limoneen < 2 < 2 < 2 < 2 < 2 < 2 < 2 < 2 butylbenzeen < 2 < 2 < 2 < 2 < 2 < 2 < 2 < 2 undecaan 2 < 2 < 2 < 2 < 2 < 2 < 2 < 2
1,3,5-trichlorobenzeen < 2 < 2 < 2 < 2 < 2 < 2 < 2 < 2
1,2,4-trichlorobenzeen < 2 < 2 < 2 < 2 < 2 < 2 < 2 < 2
1,2,3-trichlorobenzeen < 2 < 2 < 2 < 2 < 2 < 2 < 2 < 2 dodecaan 5 5 3 3 5 3 2 < 2 tridecaan < 2 < 2 < 2 < 2 < 2 < 2 < 2 < 2 tetradecaan 6 5 4 4 6 4 4 3 pentadecaan < 2 < 2 < 2 < 2 < 2 < 2 < 2 < 2 hexadecaan < 2 2 < 2 < 2 2 2 < 2 < 2
Concentrations of components outside standard reference set* in ug/m3 air
Sample number 6 CAS nr. Name µg/m3
96140 >Pentane, 3-methyl- 2 96377 >Cyclopentane, methyl- 2 590738 >Hexane, 2,2-dimethyl- 2 108872 >Cyclohexane, methyl- 2
Sample number 7 CAS nr. Name µg/m3
96140 >Pentane, 3-methyl- 2 96377 >Cyclopentane, methyl- 2 590738 >Hexane, 2,2-dimethyl- 2 108872 >Cyclohexane, methyl- 2
Sample number 8 CAS nr. Name µg/m3
96140 >Pentane, 3-methyl- 2 96377 >Cyclopentane, methyl- 2 590738 >Hexane, 2,2-dimethyl- 2 108872 >Cyclohexane, methyl- 2
Environmental Assessment Report Page 40 Hot Mud Flow East Java, Indonesia
Technical Report July 2006
Analysis of radiation
Different kinds of radioactive decay
Radioactive isotopes can emit alpha particles, beta particles and gamma rays, depending on the isotope. Each have a different kind of interaction with the human body and therefore a short explantion is given below.
Alpha particles: A positively charged particle emitted by certain radioactive material consisting of two neutrons and two protons, the nucleus of a helium atom. A dangerous carcinogen when inhaled or ingested. Alpha radiation can penetrate the body to just below the dead skin, but is blocked by clothing or even a sheet of paper. When released inside our bodies from material we inhale or swallow, alpha particles are able to transfer their energy at short range to damage body cells.
Beta particles: A beta particle is a single high-energy electron moving at high speed and carrying a negative charge. They can travel about one metre through air and can penetrate the skin, to reach internal tissue. Can cause skin burns and, when ingested, cancer. Beta rays are especially dangerous when emitted inside the body.
Gamma rays: Gamma rays are electromagnetic waves or photons emitted from the nucleus (center) of an atom. They have no electrical charge and penetrate deeply into the body, or pass through it, creating ions as they collide with atoms along their path. Gamma rays are similar to X-Rays, but are much more powerful.
Natural radioactivity in soil samples from Indonesia
Radioactive isotopes like Th-232, Ra-226 and K-40 are naturally present in all different types of soil, but the amounts vary considerably depending on the material. Many building materials, like concrete and bricks, are made from these soil
materials and therefore also contain the same radioactive isotopes. These radioactive isotopes emit the different kinds of radiation called alpha, beta and gamma radiation as mentioned above.
How much radioactivity is allowed in these building materials depends on where they are used, but requirements for protection to radiation are given in the EU Council Directive 89/106/EEC of 21 December 1988 relating to construction products (EC 1988). By order of the European Commission the Finnish Center for Radiation and Nuclear Safety (STUK) has made a study about natural radioactivity of building materials and in industrial byproducts used as raw materials in building material industry (Mustonen et. al 1997).
Th-Environmental Assessment Report Page
232, Ra-226 and K-40, expressed in Bq/kg. If this value of the activity index is less than or equal to 1, the building material can be used for construction. However, if the value of the activity index exceeds 1, it is required to show specifically that the safety requirement will be met, and the indoor radon concentration of 200 Bq/m3 due to the use of the material will not be exceeded. The EU Article 31 Group of Experts on Radiation Protection has in March 1999 decided to publish the STUK report as Radiation Protection No. 95.
Environmental Assessment Report Page 42 Hot Mud Flow East Java, Indonesia
Technical Report July 2006
Results
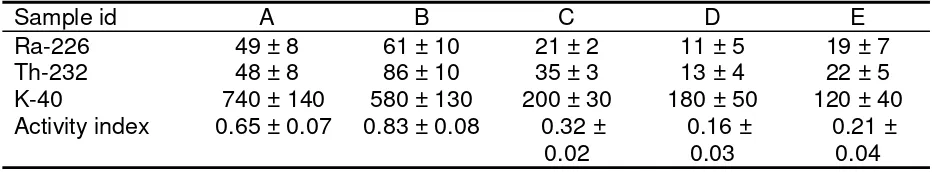
The results from the gammaspectrometric measurements are given in Table 2 using the parametres given in Table 1.The total-alpha and total-beta results are all below the detection limits of the method, being 300 and 2000 Bq/kg respectively.
Table 1: Relevant sample parametres
Sample id A B C D E
Reference 13:15Z 3+4 5+6 7 8 Wet weight 142 gram 146 gram 338 gram 181 gram 150 gram
Dry fraction 53.58% 45.23% 40.54% 79.44% 78.93%
Dry weight 76.1 gram 66.0 gram 137.0 gram 143.8 gram 118.4 gram
Table 2: Results from gammaspectrometric measurements in Bq/kg
Sample id A B C D E
Ra-226 49 ± 8 61 ± 10 21 ± 2 11 ± 5 19 ± 7
Th-232 48 ± 8 86 ± 10 35 ± 3 13 ± 4 22 ± 5
K-40 740 ± 140 580 ± 130 200 ± 30 180 ± 50 120 ± 40 Activity index 0.65 ± 0.07 0.83 ± 0.08 0.32 ±
0.02 0.16 ± 0.03 0.21 ± 0.04
Conclusions on radiation
The radioactivity in the soil samples analysed is below the recommandations as given by the EC and the soil material can therefore be used for making bricks. Additional results for e.g. heavy metals content can however make this soil material not suitable for futher use after all.
References
EC, 1988: Council Directive 89/106/FFC of 21 December 1988 on the approximation of laws, regulations and administrative provisions of the
Member States to construction products. Official Journal L 040, 11/02/1989 pp. 0012-0026
European Commission. Office for Official Publications of the European Commission. Radiation Protection Series.
Mustonen R., Pennanen M., Annanmäki M. Oksanen, 1997: Enhanced Radioactivity of Building Materials.