Fiscal Capacity and Poverty Alleviation: A Panel Data
Analysis for Yogyakarta Special Province, Indonesia
Jaka Sriyana
Department of Economics, Universitas Islam Indonesia, Yogyakarta
Ring Road Utara Condongcatur, Depok, Sleman, Yogyakarta 55283, Indonesia. Telp: +62-0274-881546; Facsimile: +62-0274-882589, E-mail: [email protected]
Received: March 2015; Accepted: May 2015
Abstract
This study attempts to analyze the role of fiscal capacity in poverty alleviation in Yogyakarta for the period of 2006-2013. For this purpose, this study uses panel data approach to estimate the empirical model involving four regencies and a city. This research found that fixed effects model is the best model to explain the role of fiscal capacity to the poverty rate. Overall, the results present that all independent variables are good predictors for poverty rate model. Based on the complete fixed effects model, the research shows that public spending and fiscal transfer are significant predictors for poverty rate. In contrast, government own revenue has negative impact to poverty rate. These results indicate fiscal capacity in among regencies and city in Yogyakarta has well managed to improve social welfare. This study also reveals that local governments need to improve their public spending as well as to strengthen their frameworks on public services policies.
Keywords: panel, fiscal, policy, poverty, unemployment JEL Classification:A13, C10, J19
Kapasitas Fiskal dan Pengentasan Kemiskinan:
Sebuah Analisis Data Panel untuk Daerah Istimewa
Yogyakarta, Indonesia
Abstrak
Penelitian ini mencoba untuk menganalisis peran kapasitas fiskal dalam pengentasan kemiskinan di Yogyakarta untuk periode 2006-2013. Untuk tujuan ini, penelitian ini menggunakan pendekatan data panel untuk mengestimasi model empiris yang melibatkan empat kabupaten dan kota. Penelitian ini menemukan bahwa model efek tetap adalah model terbaik untuk menjelaskan pengaruh kapasitas fiskal terhadap tingkat kemiskinan. Secara keseluruhan, hasil penelitian memaparkan bahwa semua variabel independen mampu menjelaskan dengan baik model tingkat kemiskinan. Berdasarkan model efek tetap lengkap, penelitian menunjukkan bahwa belanja publik dan transfer fiskal merupakan variabel penentu untuk tingkat kemiskinan. Sebaliknya, Pendapat-an Asli Daerah (PAD) sendiri memiliki dampak negatif terhadap tingkat kemiskinPendapat-an. Hasil penelitian ini menunjukkan kapasitas fiskal di antara kabupaten dan kota di Yogyakarta telah berhasil dengan baik untuk meningkatkan kesejahteraan sosial. Penelitian ini juga mengungkap-kan bahwa pemerintah daerah perlu meningkatmengungkap-kan belanja publik mereka serta memperkuat kerangka kerja mereka pada kebijakan pelayanan publik.
Kata kunci:panel, fiskal, kebijakan, kemiskinan, pengangguran Klasifikasi JEL: A13, C10, J19
1. Introduction
Poverty is one of major problems of economic development including in among regencies and
poor groups will have to adjust and work harder in order to survive. The adjustment process cannot be implemented by the poor themselves without the government involvement through some appropriate policies. It is very important to give special attention to empower the poor people in order to reduce the income gap with the rich people. In recent years, in line with decentralization policy, government programm-es have to apply more appropriate approach to development that places the government bureaucrats in the role of development catalyst. Local governments agencies should guide and assist community to follow government activi-ties, particularly those related to poverty allevi-ation in the regencies and cities.
The main government task in poverty rate alleviation is to create environment that allow poor people to empower their self. It is better for local government to encourage local economic change through economic growth rather than through top-down policies. Focusing on reducing poverty rate requires much appropriate local development planning, participation and empowerment programmes in the local level. The local governments now need to ensure the provision of assistance to poor people by direct programme, such as providing resources to poor people group to enable them to undertake their own development programmes.
An important key achievement in reducing poverty rate is the success of community empo-werment programmes in the multi economic sectors. All regencies and city in Yogyakarta special province have a potential for rapidly reducing their poverty. Based on the pheno-mena of the nature of poverty in these regencies and city, some priority actions should deliver significant impact in the fight against poverty number. According to the decentralization framework, the local governments have high potential chances to increase their fiscal capac-ity which may come from both central and local sources. Furthermore, bureaucracy in the local governments should improve their fiscal man-agement to be more efficient and effective. Local governments can also get some benefits from its ongoing processes of decentralisation process to encourage community in improving welfare
their self (Wardhana, 2010). Since Yogyakarta has undergone with stronger decentralised gov-ernment and greater social openness, it will make more opportunity for government to plan and organize their poverty alleviation pro-grammes.
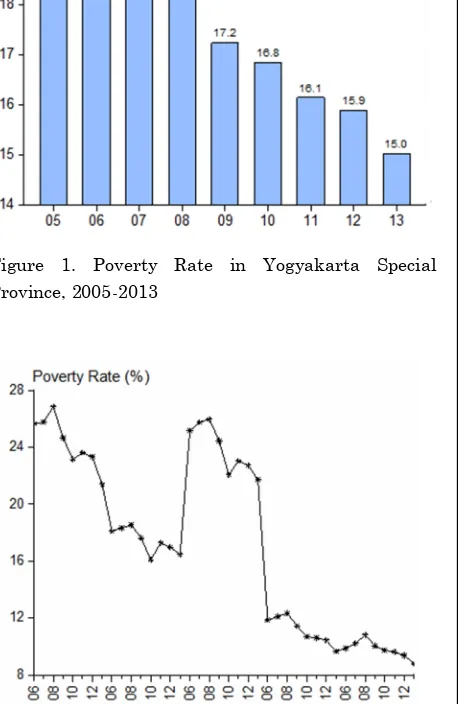
Figure 1. Poverty Rate in Yogyakarta Special Province, 2005-2013
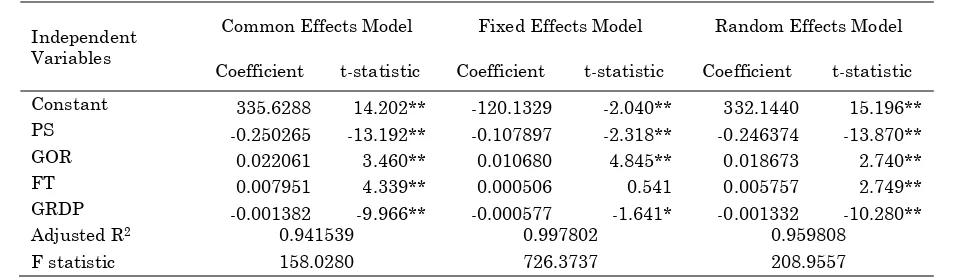
Figure 2. Poverty Rate in Regencies and City, 2005-2013
province in the period of 2006-2013. The period from 2007 to 2013 is considered as the success-ful episodes in the poverty alleviation. However, at the period of 2005-2006 the poverty rate increased in a small level. From this situation, it indicates that government has successfully managed their development programmes in reducing the poor people number.
The behaviour of poverty rate based on the provincial data may different with that in the regency and city. Figure 2 describes the annual data of poverty rate among all regency/city. Subscript 1-5 indicate regency/city respectively for Kulonprogo, Bantul, Gunungkidul, Sleman and Yogyakarta City. Kulonprogo and Gunung-kidul are two regencies with higher poverty rate than other regencies/city, meanwhile Yogyakarta city has lowest poverty rate. Sleman regency also performs with low poverty rate which is almost equal with Yogyakarta city. Other regency, Bantul has a moderate poverty rate comparing to others. Overall, all regencies and city experience with declining poverty rate for this period.
Some research noted that poverty has multi dimensions aspects and causes (Blank, 2008; Chaudhry, Malik, & Hassan, 2009; Miranti, Vidyattama, Hansnata, Cassells, & Duncan, 2013). Basically, it can be pointed out that poverty occurs due to the economic and non economic aspects. In fact, the phenomena of poverty in among regency/city in Indonesia are caused by non-income and income factors. Moreover, non-income poverty is considered more serious than income poverty (Wardhana, 2010). All dimensions of human basic needs, primary consumption, social behaviour, educa-tion, health and access to basic infrastructure would be considered to be main important fac-tors of poverty (Chaudhry et al., 2009). Almost all regencies in Indonesia need substantial improvements in educational attainment at the primary school level, basic healthcare coverage, and expansion of employment opportunities (Wardhana, 2010). Furthermore, analysis of determinants of poverty rate as well as the role of government policy in alleviating poverty rate in the local level is important to be conducted. Since government policy has many objectives
and aspects, this research likely focuses on the fiscal policy. More specific, the analysis will involve several variables of fiscal capacity, eco-nomic, and social.
Theoretical Framework. As an impor-tant economic problem in developing countries, poverty has multi dimension factors. For addi-tion, many papers have discussed poverty in various aspects (Chaudhry et al., 2009; Duclos, Sahn, & Younger, 2006; Waglé, 2008). Gener-ally, income is suspected as a main important instrument in the poverty issue, because it can afford people capabilities. In contrast, other researchers noted that poverty can be measured in other dimensions rather than economic aspect (Mat-Zin, 2007; McCulloch, Weisbrod, & Timmer, 2007). Meanwhile, some authors attempts to apply the new approach considers multidimensional to the poverty alleviation in various countries (Duclos et al., 2006; Qori’ah, Indrawati, & Wardhono, 2010).
Since many papers provide evidence for the multidimensional measurement of poverty, the poverty issue should be analyzed in more vari-ous perspectives. The justification of the idea is that incomplete indicator probably lead to inac-curate estimations. Although some recent researches pointed out that income variable is most important factor to poverty, other dimen-sions such as public facilities and services, edu-cational attainment, employment and govern-ment capacity are often strongly correlated with poverty rate (Sobhan, 2002; Vijayakumar & Brezinova, 2012). These correlations highlight the fact that measuring these additional dimen-sions enriches and provides additional information to the poverty reduction (Wattanakuljarus, 2007).
plan appropriate policies in poverty alleviation programme through multidimensional setting (Alkire & Foster, 2008; Sobhan, 2002) Empirical assessments of multi dimension factors to pov-erty alleviation reveal that external factors in some extend play more important effects (McCulloch et al., 2007; Qori’ah et al., 2010). Furthermore, an analysis of poverty issue re-garding to formulate appropriate and effective policies need to involve several multidimen-sional variables including internal and external factors.
In recent years, both central and local gov-ernments have commitment to run several poli-cies and programme regarding to poverty issues simultaneously. However, different capacities in some aspects in among local governments toward policy formulation lead to different re-sults in reducing poverty rate. Some research-ers stressed on the role of government policy to avoid the negative impact of market imperfec-tions or incompleteness to the local economic performances (Atkinson & Bourguignon, 1982; Kis-Katos & Sparrow, 2013). Meanwhile, other papers focused on how formulating appropriate government interventions to fulfill basic needs and to improve poor people capability (Ducloset al., 2006; Miranti et al., 2013). The qualities of local government policies are generally depend on the government capacity, including fiscal capacity as a major matter at the regencies and cities in Indonesia.
This study attempts to formulate appropri-ate policy regarding to poverty alleviation in Yogyakarta. For this purpose, this research analyzes empirical relationship between fiscal capacity and poverty rate using panel data for all local governments in Yogyakarta. Further-more, this research develops the poverty model as a function of several economic and social independent variables refers to the previous related literature. The basic model of poverty rate is expressed as follows:
POVRit= f (PSit, GORit, FTit, GDRPit, Xit) (1)
The dependent variable is poverty rate (POVR) in each regency/city. Meanwhile, four
main independent variables, namely public spending (PS), government own revenue (GOR), fiscal transfer (FT) and gross domestic regional product (GDRP). These variables are thought as main important economic variables influencing the poverty rate. For addition, variable X is a set of several social variables such as popula-tion, unemployment, and education which are also included in the analysis. Subscript i refer to regency/city, meanwhile subscriptirefers to the period.
2. Research Method
2.1. Data and Variables Measurement
This research seeks to provide an empirical analysis of poverty and its determinants in four regencies and a city for the period of 2006-2013 in Yogyakarta special province. For this reason, a panel data analysis is thought as an appropri-ate method. The previous researches present some basis of various factors affecting poverty rate to develop an estimable model which covers a dependent variable and several independent variables (Equation 1). Based on the developed model, this research defines poverty rate as a percentage of number of poor people to total population in each regency/city. Four main independent variables in the model, namely public spending, government own revenue, fis-cal transfer and gross domestic regional product are explained as follows. Public spending is annual government budget for public spending. Government own revenue which is officially named as Pendapatan Asli Daerah (PAD) is annual local government own revenue stated in the government budget. Fiscal transfer is reali-zation of central government transfer to each regency/city annually. Last, gross domestic regional product is regency/city annual income in constant price. All data used in this analysis are collected from annual report of Daerah Istimewa Yogyakarta in figures published by BPS-Statistic Yogyakarta Province 2007-2014.
2.2. Method of Analysis
bene-fits from using panel data. First, to get more reliable estimates of the parameters of the model. Second, to identify and measure effects that cannot be identified and measured individ-ually using cross-sectional data or time-series data. Third, to control for unobservable factors that vary across units and over time. Based on these reasons, the model can substantially reduce estimation bias. Furthermore, panel data analysis is also usually less multi co-line-arity among explanatory variables rather than time-series or cross-section data alone. As a result, the empirical model will has more pre-cise parameter estimates.
Consider an economic relationship that involves a dependent variable (Y) and two observable explanatory variables (X1 and X2) for
number of units and more than one period. That is a set of panel data for Y, X1, and X2. The
panel data consists ofN-units andT-time peri-ods, and therefore the model has N times T observations. Then, the panel regression model is given by
Yit= β0it+ β1X1it+ β2X2it+ μit (2)
for i = 1, 2, …, N and t = 1, 2, …, T
Yit is the value of Y for the unit i and for the time period t;X1it is the value of X1 for the
unit i and for the time period t,X2itis the value of X2for the unit i and for the time period t, and
μit is the error for the unit i and for the time periodt. Error term for the regression model is decomposed into two components. The first component represents all unobserved factors that vary across units and over time as constant effects which lead to fixed effects model. The second component represents all unobserved factors that vary across units and time as a random effects trough residual which lead to random effects model. It is assumed that unob-servable factors for the unit i and period at t will affect constant at the empirical model. This is the reason of the procedure of choosing the best panel empirical model. As widely known, there are three approaches of panel data
analy-sis, namely common, fixed effects and random effects model. However, it needs preconditions test before choosing the best model. To find the best empirical model using panel data, several steps of testing procedure should be conducted.
A common model assumes that a set of panel data has no effects based on different units and time periods. The common model states that there no different intercepts due to individual and timer period effects. In other words, the model is considered applicable for all individuals at every time as well as in the clas-sical linier regression. Furthermore, this model assumes that individual characteristics across unit and time variant do not affect the coeffi-cients estimate. Next model, fixed effects model assumes that unobservable factors across units and time period of observation can be captured by differences in the constant term. In fixed effects, the estimate model has different inter-cepts as a result of different units and time periods. A different important assumption in random effects model is that the unobserved random effects are uncorrelated with the explanatory variables. This factor affects the intercepts through residual as random effects. A random effects model is widely preferable because it covers characteristics of the data based on cross unit and time period trough random effects of its error. In this model, the es-timation results do not lose degrees of freedom, as is the case in and common and fixed effects. Model selection among these three approaches will be conducted using F test and Hausman test. F test is used to choose which a better model between common and fixed effects is. Meanwhile, random effects against fixed effects approach will be selected based on Hausman criterion. A Hausman test is a widely accepted method to compare the fixed and random effects for testing to this assumption (Baltagi, 2001; Wooldridge, 2003).
0 1 it 2 it 3 itt
i
PS
GOR
FT
POVR
it n
1 i
it 5 t i
4
GRDP
X
(3)
Variable X1tis a set of some social variables
which are considered as important factors and will be estimated in the empirical model as ad-ditional information.
3. Research Finding and Discussion
This research applies a set of panel data from 40 annual observations, corresponding to 4 regencies and a city for the period of 2006 to 2013. An analysis using panel data begins with testing process of model selection among three models of common, fixed effects, and random
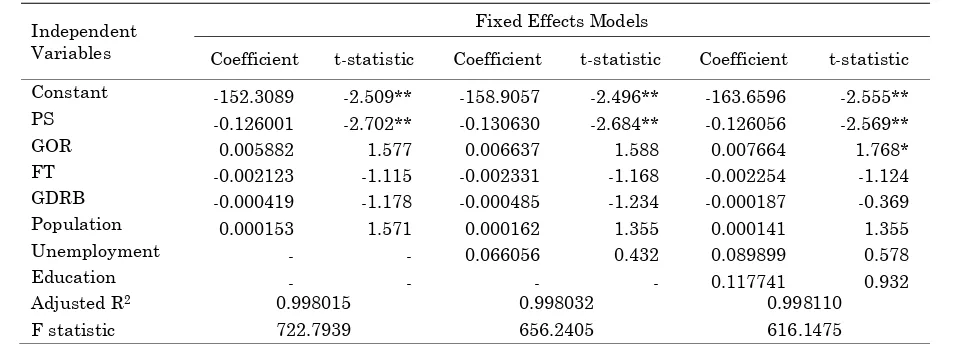
effects. To provide a comprehensive result, this paper estimates three empirical models which are presented in Table 1. The estimation results confirm that all independent variables are indi-vidually significant for three empirical models. The models also result high F statistic and coef-ficient of determination which indicate proper estimation method.
Table 2 presents the result testing between common and fixed effects. Based on F and Chi-square statistic, it can be inferred that fixed effects model is better than common model. The next step is to assess whether the panel data model follows fixed effects or random effects model. The result of Hausman test based on chi-square statistic as reported in Table 3 shows that the corresponding effect is statistically sig-Table 1. Estimates Result of Common, Fixed Effects, and Random Effects Model
Independent Variables
Common Effects Model Fixed Effects Model Random Effects Model
Coefficient t-statistic Coefficient t-statistic Coefficient t-statistic Constant 335.6288 14.202** -120.1329 -2.040** 332.1440 15.196** PS -0.250265 -13.192** -0.107897 -2.318** -0.246374 -13.870** GOR 0.022061 3.460** 0.010680 4.845** 0.018673 2.740** FT 0.007951 4.339** 0.000506 0.541 0.005757 2.749** GRDP -0.001382 -9.966** -0.000577 -1.641* -0.001332 -10.280** Adjusted R2 0.941539 0.997802 0.959808
F statistic 158.0280 726.3737 208.9557
Note: *, ** = significant at 0.10 and 0.05 significance level respectively.
Table 2. Test for Common and Fixed Effects
Redundant Fixed Effects Tests
Test cross-section and period fixed effects
Effects Test Statistic d.f. Prob. *
Cross-section F 92.404704 (4,24) 0.0000 Cross-section Chi-square 111.893166 4 0.0000
Period F 19.297891 (7,24) 0.0000
Period Chi-square 75.655452 7 0.0000
Cross-Section/Period F 49.899689 (11,24) 0.0000 Cross-Section/Period Chi-square 126.906055 11 0.0000
nificant. It means that null hypothesis which states that random effects is true should be rejected. The conclusion of the test is that fixed effects model is appropriate model for this anal-ysis. The arguments of the model are that random effects model often requires in a large number data. In a limited number data it elimi-nates a large portion of the total variation. Finally, further analysis of poverty will be con-ducted based on fixed effects model.
The empirical results of fixed effects are presented in Table 4. For addition, this analysis also involves three more independent variables namely, population, unemployment rate, and education. The data of population refers to number of population for annual data in each regency/city. Unemployment rate is the per-centage of annual unemployment to the total population in each regency/city. Last, education is defined as number of population who gradu-ates from senior high school in each regency/
city. All the data are taken from Daerah Isti-mewa Yogyakartain figures for various editions which are published by BPS-Statistic of Yogya-karta province.
The estimation process results three differ-ent empirical models as presdiffer-ented in Table 4. The first model has one more independent vari-able from previous model that is number of population. The second model is added with unemployment rate. Meanwhile the last model has education variable as an additional varia-ble. From these three models, the second model seems to be the best model since it has more significant variables. As theoretically expected, three independent variables, PS, FT and GRDP in this selected model are negatively significant. Meanwhile GOR and unemployment have posi-tive correlation with poverty rate but they are not significant. The education variable in the third model is also not significant indicating that poverty is not affected by education level. Table 3. Hausman Test: Fixed and Random Effects
Correlated Random Effects - Hausman Test Test period random effects
Test Summary Chi-Sq. Statistic Chi-Sq. d.f. Prob. *
Period random 39.735410 4 0.0000
Note: Ho: Random effects is true; Ha: Fixed effects is true. * = Ho is rejected at 0.10 significance level. It means that fixed effects is better than random effects.
Table 4. Estimates Results of Complete Model
Independent Variables
Fixed Effects Models
Coefficient t-statistic Coefficient t-statistic Coefficient t-statistic Constant -152.3089 -2.509** -158.9057 -2.496** -163.6596 -2.555** PS -0.126001 -2.702** -0.130630 -2.684** -0.126056 -2.569** GOR 0.005882 1.577 0.006637 1.588 0.007664 1.768* FT -0.002123 -1.115 -0.002331 -1.168 -0.002254 -1.124 GDRB -0.000419 -1.178 -0.000485 -1.234 -0.000187 -0.369 Population 0.000153 1.571 0.000162 1.355 0.000141 1.355 Unemployment - - 0.066056 0.432 0.089899 0.578
Education - - - - 0.117741 0.932
Adjusted R2 0.998015 0.998032 0.998110
F statistic 722.7939 656.2405 616.1475
Interpretation of the analysis to the pov-erty rate is based on the second model of fixed effects model. The negative intercept in the model indicates that the poverty rate for all regency/city relates with high level of independ-ent variables. It means that high rates of pov-erty rate in Kulonprogo and Gunungkidul have positive correlation with high rate of population and unemployment as well as government own revenue although these variables are not sig-nificant. Theoretically, population and unem-ployment have negative correlation with pov-erty rate, so that this finding is not debatable (Chaudhry et al., 2009). In fact, government own revenue is one important fiscal variable in the local government which reflect part of local fiscal capacity. It is expected that this variable will support the welfare rate of the society. However, this research does not support this preposition. In contrast this variable has posi-tive sign which indicates increasing government revenue fails to alleviate poverty rate.
A negative correlation between public spending and poverty rate in this study reflects ineffectiveness of government programmes. Contradict as theoretically, the coefficient of public spending is not statistically significant even though at the 0.10% significance level. This result is not in line with Miranti et al., (2013) who studied the role of decentralization policy to poverty rate. Their research concluded that some government policies in the decen-tralization period perform effective impact to poverty reduction. This analysis finds that neg-ative relationship between this variable and poverty rate indicate the low achievement of government fiscal policy in the local level. A possible reason why public spending has nega-tive correlation with poverty rate can be explained using government programme per-spective. In the case that public spending increase, it means that local government has more activities for development programmes. Finally increasing in public spending tends to decrease the poverty rate.
Unexpected result due to the role of fiscal transfer is found in this analysis. Fiscal transfer has an insignificant and positive relationship with poverty rate (Table 1). Based on this
result, it can be inferred that such relationship may runs in two ways. First, it indicates decreasing growth of fiscal transfer as poverty rate declines. Secondly, it could also be inter-preted that fiscal transfer is allocated into some government activities which does not affect pov-erty alleviation. This second reason is more rational and acceptable since the local govern-ments have other several obligations. This idea is similar with some previous researches (Qori’ah et al., 2010; Sobhan, 2002; Vijaya-kumar & Brezinova, 2012).
In this model, gross domestic regional product which measures real income also has negative relation with poverty rate. This finding implies that economic growth in local level lead to reduce number of poor people. This phenom-enon is in line with a comprehensive research conducted by McCulloch et al., (2007). A similar finding was also concluded by (Qori’ah et al., 2010). This paper pointed out that income varia-ble is the main factor in determining poverty in the local level. In the case of regency/city in Yogyakarta special province, there is strong role of economic growth in alleviating poverty rate. This conclusion is also supported by empirical estimation presented in Table 2. When some social variables are excluded from the model, this variable is significant even though at the 0.1% significance level. It means that economic growth which is measured by gross regional domestic product plays a very important role to improve social welfare.
Overall, this analysis demonstrates a posi-tive relationship between fiscal capacity and poverty rate reduction. This also indicates that the increase of local fiscal capacity that may come from central government lead to bring the better quality of live in the local level. This re-sult suggests that government activities relat-ing to the public services should be improved as well as fiscal transfer from central government. This research point out that central government should improve local government capacity through increasing fiscal transfer. This result is similar with other previous research such as (Chaudhry et al., 2009; Kis-Katos & Sparrow, 2013).
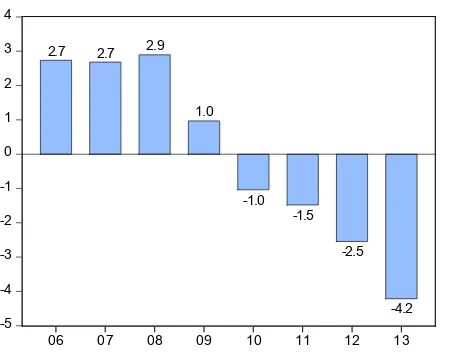
As a final point, with regard of poverty elimination, fiscal capacity indicators used in this empirical model are able to explain the determinants of poverty rate in among selected local governments. For addition, the empirical estimation using fixed effects model exhibits the variation effects of its intercept due to cross sec-tion and time period. Table 5 presents empirical estimates which contain heterogeneity effects due to cross section units. Based on this esti-mates, Sleman regency has a lowest intercept, meanwhile Kulonprogo experiences with a highest autonomous poverty rate. Figure 3 de-picts the volatility of the heterogeneity effects caused by time variant. However, this figure describes strong different of the poverty rate volatility across this period. In the year 2009 was the cutting point of the effect of unobserv-able factor into intercept. It can be inferred that after this period, the fiscal policy performs bet-ter effect to poverty alleviation.
Table 5. Cross Section Effects of Fixed Effects Estimates
Regencies/City Cross Section Effects
1 Kulonprogo 13.62092 2 Bantul -4.677285 3 Gunungkidul 11.65845 4 Sleman -13.73077 5 Yogyakarta -6.871318
Figure 3. Time Series Effects of Fixed Effects Estimates
4.
Conclusion
This research attempts to analyze the role of fiscal capacity to the poverty rate alleviation. The result show that fiscal capacity, which are reflected by fiscal transfer and public spending play very important role to the poverty allevia-tion in regencies and city in Yogyakarta special province. Other fiscal capacity variable that is government owned revenue does not signifi-cantly affect the poverty rate reduction. As a final point, it can be concluded that increasing in fiscal capacity will lead to reduce poverty rate in Yogyakarta.
This research highlights that central gov-ernment needs to improve local govgov-ernments’ fiscal capacity through improving fiscal trans-fer. In other hand, local bureaucrats need to emphasize some programmes on poverty allevi-ation meet to their goals. In other words, public spending in the local government should be conducted more efficient and effective. In short, this study also reveals that local governments need to improve their public spending as well as to strengthen their frameworks on public ser-vices programmes.
Some key elements might be recommended in policy planning related to poverty alleviation: (a) Empowering local government capacity through increasing the fiscal capacity; (b) Increasing government activity relating to the poverty alleviation; (c) Empowering poor family
-5 -4 -3 -2 -1 0 1 2 3 4
06 07 08 09 10 11 12 13 2.7 2.7 2.9
1.0
-1.0 -1.5
-2.5
through income generating programmes; (d) Reduce unemployment in the area of poor fam-ily; (e) Ensuring control of market as well as accessibility to various economic resources for the poor family.
5.
References
Alkire, S., & Foster, J. 2008.Counting and mul-tidimensional poverty. United Kingdom: Queen Elizabeth House, University of Oxford.
Atkinson, A. B., & Bourguignon, F. 1982. The comparison of multi-dimensioned distri-butions of economic status. Review of Economic Studies,49, 183–201.
Baltagi, B. 2001. Econometric analysis of panel data (2nd ed.). England: John Wiley & Son.
Blank, R. M. 2008. How to improve poverty Measurement in the United Sates. Jour-nal of Policy AJour-nalysis and Management, 27(2), 233–254. doi:10.1002/pam
BPS, D. I. Y. 2014.Yogyakarta special province in figures.
Chaudhry, I. S., Malik, S., & Hassan, A. 2009. The impact of socioeconomic and demo-graphic variables on poverty : A village study. The Lahore Journal of Economics, 14(1), 39–68.
Duclos, J. Y., Sahn, D. E., & Younger, S. D. 2006. Robust multidimensional poverty comparisons. The Economic Journal, 116(514), 943–968.
Kis-Katos, K., & Sparrow, R. 2013. Poverty, labour markets and trade liberalization in Indonesia. Inthe institute for the study of labor discussion paper (pp. 1–32). Re-trieved from http://www.econstor.eu/ han-dle/10419/90005
Mat-Zin, R. 2007. Poverty and inequality reduc-tion in the ASEAN community: The need for political will. Inthe 32nd conference of federation of ASEAN economic association (pp. 1–31). Bangkok, Thailand.
McCulloch, N., Weisbrod, J., & Timmer, C. P. 2007. Pathways out of poverty during an economic crisis: an empirical assessment of rural Indonesia. In center for global development working paper (pp. 1–40). Retrieved from www.cgdev.org
Miranti, R., Vidyattama, Y., Hansnata, E., Cas-sells, R., & Duncan, A. 2013. Trends in poverty and inequality in decentralising Indonesia. In OECD social, employment and migration working Papers (pp. 1– 115). OECD publishing. doi:10.1787/ 5k43bvt2dwjk-en
Qori’ah, C. G., Indrawati, Y., & Wardhono, A. 2010. Review of policy on poverty elimita-tion programme. In the 10th Indonesia Regional Science Association (IRSA) Con-ference(pp. 28–29). Surabaya, Indonesia.
Sobhan, R. 2002. Mainstreaming poverty eradiction: moving from micro to macro agenda. In centre for policy dialogue (pp. 1–24). Dhaka, Bangladesh.
Vijayakumar, S., & Brezinova, O. 2012. Poverty Incidence and its determinants in the estate sector of Sri Lanka. Journal of Competitiveness, 4(1), 44–55. doi:10.7441/ joc.2012.01.04
Waglé, U. R. 2008. Multidimensional poverty: An alternative measurement approach for the United States? Social science re-search,37(2), 559–580.
Wardhana, D. 2010. Multidimensional poverty dynamics in Indonesia (1993-2007). In Master Thesis. United Kingdom: The University of Nottingham. Retrieved from http://xa.yimg.com/kq/groups/18209593/10 93273342/name/Final+Draft+15092010+-+4094224.pdf
Wattanakuljarus, A. 2007. Is tourism growth pro-poor growth? Inthe 32nd conference of federation of ASEAN economic associa-tions (FAEA)(Vol. 0, pp. 1–20). Bangkok, Thailand.