Refer to Important disclosures on the last of this report
StockData
Target price (Rp) Rp10,350
Prior TP (Rp) Rp10,160
Shareprice (Rp) Rp8,925
Upside/downside (%) +16.0
Sharesoutstanding (m) 11,644
Marketcap. (US$ m) 6,836
Estimate Change; Vs. Consensus
2018F 2019F
PT Indo Premier Sekuritas [email protected] +62 21 5793 1169
Robust earnings growth
Strong 3Q18 result, above expectations.
Regaining market share dominance in noodle segment.
Further margin expansion across the board.
Maintain BUY on ICBP with higher TP of Rp10,350.
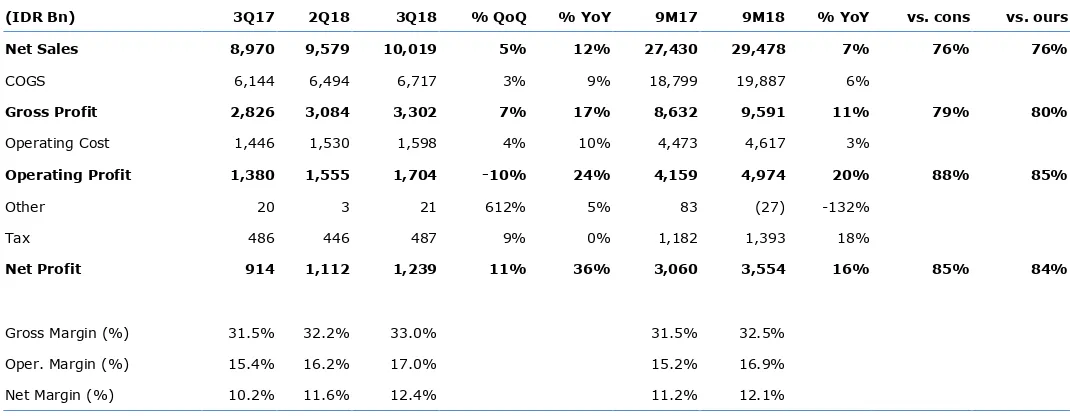
Robust 3Q18 earning, exceeding expectations.
ICBP recorded net earnings of
Rp1.2tn in 3Q18 (+36% yoy; +11% qoq) and Rp3.6tn cumulatively in 9M18
(+16% yoy), forming 84% and 85% of ours and consensus respectively. This is
mainly on the back of improvement in market share and margin expansion. Top
line also booked a moderate growth, recording Rp10tn in 3Q18 (+12% yoy; +5%
qoq) and Rp29.5tn in 9M18 (+7% yoy). We continue to like ICBP on the back of
strong 9M18 earnings and improvement in market share driven by new innovative
products.
Regaining dominance in noodle segment.
In 3Q18, the noodle segment alone
grew by +13% yoy(vs. 2Q18: +7.2%yoy; 3Q17: +8.3%yoy), the strongest
was also confirmed through our on-the-ground checks, where retailers and
consumers were saying that Indofood has had better advertising and innovative
products to attract consumers. Although volume growth in the industry has been
shrinking, without new innovations and aggressive marketing from Wings’, we
believe that ICBP can still gain more market share in the segment.
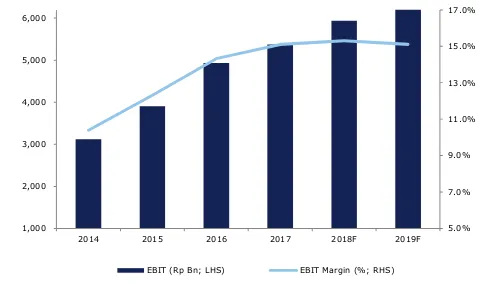
Margin expansion drove earnings growth.
Gross margin in 3Q18 continued to
improve by +80bps qoq to 33% (vs. 2Q18: 32.2%; 3Q17: 31.5%), mainly on the
back of a more muted commodity growth in 9M18. EBIT margin also improved by
+80bps qoq to 17% in 3Q17 (vs. 2Q18: 16.2%; 3Q17: 15.4%), driven by margin
expansion in the noodle, dairy and food seasonings segments. With less
competition in the noodle segment, we believe that the company will be able to
sustain their EBIT margin at the current level.
Valuation.
We maintain our revenue forecast for FY18F and FY19F, while slightly
raising our earnings forecast by 1.9%/1.5% following improvements in margin in
9M18. We reiterate our BUY call for ICBP and rolling forward our valuation to
FY19F with a higher TP of Rp10,350 (based on target P/E of 25x). We transfer
coverage from Putri Tobing to Elbert Setiadharma.
Indofood CBP
(
ICBP IJ
)
Source : ICBP,IndoPremier Share Price Closing as of : 31-October-2018
2
Refer to Important disclosures on the last of this report
Fig. 1: ICBP quarterly sales trend Fig. 2: EBIT and EBIT margin trend
Source: Company, IndoPremier Source: Company, IndoPremier
Fig. 3: Noodle growth trend Fig. 4: 3Q18 sales breakdown
Source: Company, IndoPremier Source: Company, IndoPremier
Fig. 5: 1Q18 instant noodle market share Fig. 6: 2018 new line extensions
Source: Top Brand, IndoPremier Source: Company
-4.0%
Sales (Rp Bn; LHS) Sales YOY Growth (%; RHS)
5.0%
2014 2015 2016 2017 2018F 2019F
EBIT (Rp Bn; LHS) EBIT Margin (%; RHS)
19,916
2014 2015 2016 2017 2018F 2019F
Noodle (Rp Bn) Noodle YOY Growth (%; RHS)
Noodles
Nutrition and Special Foods Wings Group (Mie
3
Refer to Important disclosures on the last of this report
Fig. 7: Earnings Revision
Source: Company, IndoPremier
Fig. 8: Results Summary
(IDR Bn) 3Q17 2Q18 3Q18 % QoQ % YoY 9M17 9M18 % YoY vs. cons vs. ours
4
Refer to Important disclosures on the last of this report
Year To 31 Dec (RpBn) 2016A 2017A 2018F 2019F 2020F
Cash & Equivalent 8,372 8,945 10,433 13,159 15,672
Receivable 3,720 3,871 3,888 4,260 4,678
Inventory 3,110 3,262 3,329 3,674 4,093
Other Current Assets 369 501 449 475 505
Total Current Assets 15,571 16,579 18,099 21,569 24,948
Fixed Assets - Net 7,114 8,120 8,350 8,527 8,652
Goodwill 1,424 1,424 1,424 1,424 1,424
Non Current Assets 3,160 2,851 2,943 2,443 2,334
Total Assets 28,901 31,619 32,448 35,595 38,990
ST Loans 563 1,148 567 563 563
Payable 2,692 2,904 0 2,940 3,275
Other Payables 2,611 2,525 2,770 3,057 3,406
Current Portion of LT Loans 604 250 234 233 91
Total Current Liab. 6,470 6,827 6,234 6,793 7,334
Long Term Loans 877 954 506 273 182
Other LT Liab. 3,054 3,513 3,055 3,055 3,055
Total Liabilities 10,401 11,294 9,795 10,121 10,571
Equity 6,585 6,765 6,568 6,568 6,568
Retained Earnings 10,979 12,799 15,191 17,851 20,632
Minority Interest 936 760 893 1,054 1,218
Total SHE + Minority Int. 18,500 20,324 22,652 25,473 28,418
Total Liabilities & Equity 28,901 31,618 32,447 35,594 38,989
5
Refer to Important disclosures on the last of this report
Year to 31 Dec 2016A 2017A 2018F 2019F 2020F
Cash Flow
Net Income (Excl.Extraordinary&Min.Int) 3,629 3,543 4,423 4,966 5,347
Depr. & Amortization 510 623 720 773 825
Changes in Working Capital (333) (402) (1) (278) (302)
Others (305) 80 (380) (723) (817)
Cash Flow From Operating 3,501 3,843 4,762 4,738 5,053
Capital Expenditure (728) (1,320) (1,042) (450) (841)
Others 89 (757) 1,644 640 828
Cash Flow From Investing (639) (2,077) 602 190 (13)
Loans (824) 308 (1,046) (238) (233)
Equity 0 0 0 0 0
Dividends 1,545 1,942 1,898 2,145 2,403
Others 119 309 (665) 57 87
Cash Flow From Financing 840 2,559 188 1,964 2,257
Changes in Cash 3,702 4,325 5,551 6,892 7,297
FinancialRatios
Gross Margin (%) 31.5 31.1 31.5 31.0 30.0
Operating Margin (%) 14.3 15.1 15.3 15.1 14.2
Pre-Tax Margin (%) 14.5 14.6 15.2 15.5 15.2
Net Margin (%) 10.4 10.7 11.0 11.3 11.1
ROA (%) 13.0 12.5 13.4 14.1 13.9
ROE (%) 20.6 19.6 20.0 20.0 19.2
ROIC (%) 21.6 20.2 21.2 22.4 22.5
Acct. Receivables TO (days) 36.6 38.9 36.4 34.9 34.9
Acct. Receivables - Other TO (days) 0.0 0.0 0.0 0.0 0.0
Inventory TO (days) 8.3 7.7 8.1 8.4 8.4
Payable TO (days) 37.7 41.6 38.1 34.8 34.6
Acct. Payables - Other TO (days) 0.0 0.0 0.0 0.0 0.0
Debt to Equity (%) 11.0 11.6 5.8 4.2 2.9
Interest Coverage Ratio (x) 0.0 0.0 0.0 0.0 0.0
Net Gearing (%) (34.2) (31.7) (40.3) (47.5) (52.2)
Head Office
PT INDO PREMIER SEKURITAS
Wisma GKBI 7/F Suite 718
Jl. Jend. Sudirman No.28
Jakarta 10210 - Indonesia
p +62.21.5793.1168
f +62.21.5793.1167
INVESTMENT RATINGS
BUY : Expected total return of 10% or more within a 12-month period
HOLD : Expected total return between -10% and 10% within a 12-month period
SELL : Expected total return of -10% or worse within a 12-month period
ANALYSTS CERTIFICATION.
The views expressed in this research report accurately reflect the analysts personal views about any and all of the subject securities or issuers; and no part of the research analyst's compensation was, is, or will be, directly or indirectly, related to the specific recommendations or views expressed in the report.
DISCLAIMERS