117
Returns
Saarce Elsye Hatane
Faculty of Economics, Petra Christian University Jl. Siwalankerto 121-131 Surabaya 60263
E-mail: [email protected]
ABSTRAK
Komoditi kokoa memegang peranan yang penting dalam menghasilkan devisa negara, mengingat kokoa merupakan salah satu komoditi andalan ekspor Indonesia. Dilain pihak, sebagai salah satu jenis tanaman perkebunan, harga komoditi kokoa cenderung mengalami volatilitas yang tinggi sepanjang waktu. Studi ini memiliki dua tujuan, yaitu untuk menguji kemampuan model-model GARCH (ARCH, GARCH, GARCH-M, EGARCH, dan TGARCH) dalam memprediksi volatilitas tingkat pengembalian (return) komoditi kokoa dan menentukan model terbaik diantara model-model tersebut. Dua variabel independen yang digunakan dalam studi ini adalah nilai residual dari persamaan rata-rata dan volatilitas varians kesalahan pada periode-periode sebelumnya. Harga komoditi kokoa yang digunakan adalah harga spot komoditi tersebut selama periode Januari 2005 sampai dengan Juni 2011 yang diperoleh dari BAPPEBTI (Badan Pengawas Perdagangan Berjangka Komoditi). Hasil-hasil penelitian menunjukkan bahwa model GARCH-M dan model EGARCH memberikan prediksi terbaik dalam mengestimasi volatilitas harga komoditi kokoa.
Kata Kunci: volatilitas, GARCH, kokoa, residual, harga spot
ABSTRACT
Cocoa plays an important role in generating Indonesian foreign exchange revenues since it is one of Indonesia’s primary commodity exports. Meanwhile, as part of plantation commodity, cocoa’s price also has volatility nature. This study has two aims: to examine the predictability of GARCH-type models (ARCH, GARCH, GARCH-M, EGARCH, and TGARCH) on the cocoa’s returns volatility and to determine the best predictability model among the significant GARCH-type models. Two independent variables used in this study are the residual from the mean equation and volatility of error variances in the previous periods. The prices used are spot price series in periods of January 2005 to June 2011 from BAPPEBTI (Indonesian Commodity Futures Trading Regulatory Agency – CoFTRA). The results show that GARCH-M and EGARCH models are the best prediction models.
Keywords: volatility, GARCH, cocoa, residual, spot price
INTRODUCTION
Agriculture can be defined as the production process toward the cultivations of plants and animals including fish (Hanafie, 2010). A 2004 report by the
UK’s Department for International Development
(DFID) identified two issues faced by agricultural commodity producers; low returns and high risks. According to the DFID, agricultural commodities suffer low returns because their prices rise less rapidly than those of manufactured products. And they represent high risks in that they show price volatility. The decades of stabile progress in Indonesian agricultural development were suddenly disturbed by
competitiveness as well as optimizing the sustainable management of natural resources.
INDONESIAN COCOA PRODUCTION
Indonesian ability to produce cocoa beans in
large quantities has been proven as it is the world’s
third largest cocoa produces after Ivory Coast and Ghana in the last 20 years (Maruli, 2011). Ivory Coast is the largest country in the world for cocoa plantation. The area reached 3.7 million hectares and total production about 1.5 million tons per year (Caturini, 2011). The economic sanctions imposed by the European Union by January 2011 to the Ivory Coast as the world’s largest producer of cocoa also affected cocoa contract price in the futures exchange market (Hadi & Hari, 2011). One of the economic sanctions was ban on Ivory Coast cocoa exports to the EU. Price of cocoa futures contract in international futures exchange rose by 1.4% in April 2011, and NSYE LIFFE recorded closing price of cocoa futures per April 4, 2011 reached $3.124 per ton, and it was the highest since January 2011 (Caturini, 2011). The high world cocoa price and the ban of Ivory Coast cocoa exports compel the cocoa producers to increase their crops. Since 2010, Indonesian Agriculture Ministry announced Pro Cocoa National Program in order to increase Indonesian cocoa production. Until the end of 2010, Indonesian cocoa plantation areas reached about 1.5 million hectares with number of production about 600,000 – 650,000 tons (Agriculture Data Center, 2010). The program was intended to expand cocoa plantation areas to 900,000 hectares until 2014.
THE AGRICULTURAL COMMODITY’S PRICE VOLATILITY
Generally, commodity prices are volatile, and especially for agricultural commodity prices, their volatile nature is well-known (Newbery, 1989). Dis-cussion on the degree of commodity price volatility has become one remarkable topic, and attracted attention of researchers in economic and financial fields. Some researchers, such as Kroner et al. (1995), Sekhar (2003,2004), O’Connor et al. (2009), and Alom et al. (2010), reported that international prices of agricultural commodities are one of the most volatile prices in international market. The market players in agricultural commodity market pay much attention on the continuous volatility nature of agricultural commodity prices. The persistence of volatile condition causes a difficult situation for market player to put in precise price signals from the
market thus can result in speculative actions. Having a better understanding about commodity prices characteristics is extremely important for developing countries that depend on commodity exports or that import huge amounts of food. It is necessary for policymakers, like government and development agency, to decide on which products they must focus on and to construct appropriate policy. For the producers, it can help them make decision which crops to plant (Deaton, 1999). Less knowledge about volatility in commodity prices can cause the small farmers, who have low tendency to save and poor access to efficient saving instrument, unable to cope with the fluctuated revenues (Sekhar, 2003). For government, un-foreknown variation in export prices can lead to complicated budget and risky debt targets. For the exporters, price volatility increases the financial costs through the increase of cash-flow
variability and the decrease of inventories’ collateral
value (Sekhar, 2004).
THE GARCH-TYPE MODELS
GARCH GARCH (Generalized Autoregressive Conditional Heteroscedasticity) models are applied properly for analyzing prices which demonstrate time
varying level of variance (O’Connor et al., 2009). GARCH-type models, introduced by Bollerslev in 1986, are derived from Autoregressive Conditional Heteroscedasticity (ARCH) models pioneered by Engle in 1982. The ARCH and GARCH metho-dology propose a method for measuring uncertainty if uncertainty is serially correlated. Yang et al. (2001) argued three advantages of this modeling approach. First, compared to more traditional approaches, the GARCH process can describe well the time-varying pattern of price volatility or risk. Second, volatility is predictable. It is consistent with the ability of GARCH-type models in defining the risk as a function of variance from conditional errors of price forecasted. Third, GARCH models help to determine price volatility and price forecasting simultaneously.
chili and shallot was ARCH (1); while for sugar and wheat flour was GARCH (1,1). However, ARIMA was the fitted model for cooking oil and egg. Yang et al. (2001) examined the effect of agricultural liberali-zation policy, the Federal Agricultural Improvement and Reform (FAIR) Act of 1996, towards US agricultural commodity prices volatility using GARCH models. The commodities were corn, oat, soybeans, wheat and cotton. Total observations were 1695 active traded cash and futures prices from 1 January 1992 to 30 June 1998. Finally, the paper concluded that GARCH (1,1) model had done adequate job in describing the data-generating process of cash and futures prices of each commodity. Mahesha (2011) investigated international price volatility of Indian of spices exports. This study applied GARCH (1,1) model to estimate the time varying conditional variances. The result showed that there was a high volatility clustering in cardamom, ginger and pepper. Pinisakikool (2009) applied ARIMA-GARCH and ARIMA-TARCH with dummy variable to investigate whether futures traded in The Agricultural Futures Exchange of Thailand (AFET) could stabilize the spot price volatility or not. The results showed that spot price volatility model of the commodities studied were compatible with GARCH (1,1) and TARCH (2, 2).
The GARCH-type models employed in this study are:
ARCH (q) Model. It was proposed by Engle in 1982 to capture volatility persistence in inflation. The ARCH model does not utilize past standard deviations, but formulate conditional variance ( ) of asset returns by maximum likelihood procedures. The conditional variance equation is:
(1)
GARCH (p,q) Model. According to Bollerslev (1986) and Taylor (1986), the high-order ARCH (q) process is more proximate to model GARCH (p, q). The additional dependencies on the residual variance are permitted on p lags of past as shown below:
(2)
GARCH-M (p,q) Model. It was introduced by Engle et al. in 1987, includes the conditional variance or standard deviation into the mean equation.
EGARCH (p,q) Model. It was introduced by Nelson in 1991. The EGARCH (p,q) denotes conditional variance in logarithmic form. The equation is:
∑ √
∑ |
√ | (3)
TGARCH (p, q) Model. This model was introduced by Zakoïan in 1994. It was developed from Threshold ARCH (TARCH or GJR) model by Glosten, Jaganathan & Runkle. The equation for conditional variance is:
∑
∑ (4)
The Evaluation Process
The first step in evaluating the prediction power among GARCH-type models is measuring the “true or realized volatility.” Brooks (β008) explained that true or ex post volatility is the actual historical
volatility of a security’s price. Ex post volatility measurement used in this study based on formula proposed by Day & Lewis (1992). The model is expressed as follow:
̅ (5)
The best predicting models among the GARCH-type models are selected by using three traditional symmetric evaluation statistics. Those are root mean square error (RMSE), mean absolute percent error (MAPE) and mean absolute error (MAE).
RESEARCH METHODOLOGY
observations of each commodity are 338 weekly spot prices or equal to 337 observations of weekly spot price returns. The prices data are collected from BAPPEBTI (Indonesian Commodity Futures Trading Regulatory Agency–CoFTRA) database by down-loading from www.bappebti.go.id (accessed on July 2011).
The null hypotheses examined in this study are as follows:
: The ARCH model cannot be used to predict
the volatility of Cocoa’s spot price returns. : The GARCH model cannot be used to predict
the volatility of Cocoa’s spot price returns. : The GARCH-M model cannot be used to
predict the volatility of Cocoa’s spot price
returns.
: The EGARCH model cannot be used to predict the volatility of Cocoa’s spot price returns.
: The TGARCH model cannot be used to
predict the volatility of Cocoa’s spot price
returns.
RESULTS AND DISCUSSION
The Data Profile
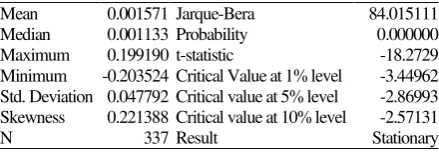
The mean value, as shown in Table 1, is far from one. It indicates that the data are stationary around zero. The standard deviation value, which is far from one, shows the diversity of data, means that cocoa has high volatility in its price return. The skewness value is not zero, and the p-value of Jarque-Bera is less than 0.05. It means that cocoa’s return series are not normally distributed. In time series analysis, data has to be stationary. This study uses ADF test statistic to perform the stationary test. Stationary means that the
data has no unit roots. Table 1 shows that cocoa’s t-statistic values greater than all critical values. It means that the price return series are stationary.
Table 1.The Data Profile
Mean 0.001571 Jarque-Bera 84.015111 Median 0.001133 Probability 0.000000 Maximum 0.199190 t-statistic -18.2729 Minimum -0.203524 Critical Value at 1% level -3.44962 Std. Deviation 0.047792 Critical value at 5% level -2.86993 Skewness 0.221388 Critical value at 10% level -2.57131
N 337 Result Stationary
The ARMA Model
First step in this process is to identify the autoregressive (AR) and moving average (MA) models from correlogram of partial correlation
function (PACF) and autocorrelation function (ACF). Next step is estimating the ARMA models from combination of AR and MA in the identification process. The combination of AR and MA is chosen as ARMA candidate model if both AR and MA have significant p-value at 5% level. Each of ARMA candidate model must be free from serial correlation
problem and must use white’s heteroscedasticity standard error if it has heteroscedasticity problem. The serial correlation problem is detected from probability values, both Prob F and Prob Chi-square, of serial correlation Langrange Multiplier (LM) test. If one of the p-values has value less than 5% (0.05), it indicates that the ARMA candidate model has serial correlation problem. The last step is to select the best ARMA model by comparing the SIC values of all ARMA candidate models. The best ARMA model is the model that has lowest Schwarz Information Criterion (SIC) value.
The Serial Correlation and ARCH LM tests for ARMA candidate models of Cocoa are shown in Table 2. All of those ARMA candidate models have heteroscedasticity problem since their p-values of ARCH LM Tests are less than 0.05. Thus, the
White’s Heteroscedasticity standard error is used to
solve the heteroscedasticity problem.
From all of those AR and MA combination models for Cocoa, there are no ARMA models which have serial correlation problem since all of their p-values from the serial correlation LM tests are greater than 0.05. From all SIC values, the lowest value is on ARMA (21,21) which consists of AR (21) and MA (21). Therefore, it is the best ARMA model which will be used in GARCH construction process for Cocoa.
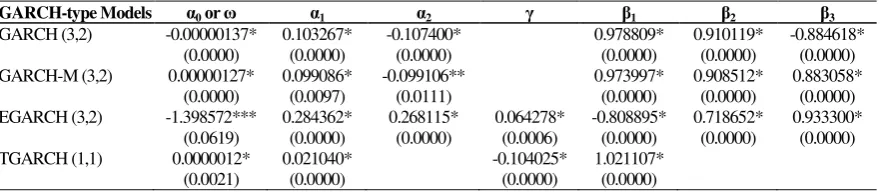
The GARCH-Type Models
After determining the mean equation from ARMA model, the building of volatility equations in GARCH forms begins. First step is to construct the volatility equations in GARCH-type models for each commodity by using the best ARMA models. Second step is to check the significant of p-value of each coefficient, except the constant, in the volatility equation of each GARCH-type model. The significant values of the coefficients in volatility equation will be measured based on three significant levels, i.e. 1%, 5%, and 10%.
Cocoa’s spot price returns. The table also shows that
from all lag combinations of the residuals and volatility, GARCH (3,2), GARCH-M (3,2), EGARCH (3,2) and TGARCH (1,1) have completed
significant coefficients of residuals (α) and volatility ( ). Thus,
,
,
, and
are accepted. It means that GARCH, GARCH-M, EGARCH and TGARCH models can be used to predict the volatility
of Cocoa’s spot price returns.
GARCH (3, 2) means that the spot price returns volatility of cocoa can be predicted by the returns volatility of previous three weeks and squared residuals of previous two weeks. GARCH-M (3,2) has same meaning as GARCH (3,2). The different is
that the returns volatility of Cocoa’s spot price is also
influenced by the conditional variance in the mean equation, which is interpreted as the risk premium. The EGARCH (3,β) means that the current week’s returns volatility of Cocoa can be predicted by
Cocoa’s returns volatilities of the previous three
weeks; and by the squared residuals from the ARMA
model of Cocoa’s returns of the previous two weeks. The positive value of (0.064β78) means that high
price or high returns news generates more price returns volatility for Cocoa. The TGARCH (1,1)
means that the returns volatility of Cocoa’s spot price
returns can be predicted by the returns volatility and squared residual of the previous one week. The
asymmetric symbol ( ), which is also shown in EGARCH model, shows negative value. Different from the positive value in EGARCH model, the
negative value of in TGARCH model means that
negative news related with Cocoa will lead to more
price volatility in Cocoa’s spot price.
CONCLUSIONS AND RECOMMENDATIONS
This study examined γγ7 series of Cocoa’s spot
price with the aims to find the best volatility prediction model from GARCH-type models. The data profile showed that this return series are not normally distributed, the data has heteroscedasticity nature. Therefore, the returns volatility for this characteristic can be fit predicted by GARCH-type models, as mentioned by some researchers in the previous studies. From the five basic models in GARCH-type models, this study finds that only ARCH model cannot be used to predict the returns
volatility of Cocoa. It means that Indonesian Cocoa’s
spot price returns volatility cannot be predicted by the residual alone. It should be combined by the previous returns volatility.
Based on the error statistic criterions, as shown in Table 5, Cocoa has two different types of GARCH models that can be used to predict the volatility of its spot price returns. With respect to RMSE and MAE,
Table 2. The ARMA Models
The Best
Table 3. The ARCH Models
ARCH models 0 1 2 3 4
Note: * = significant at 1%, ** = significant at 5%; *** = significant at 10%; value in the parenthesis is the p-value
Table 4. The GARCH Models
EGARCH (3,2) is the best GARCH model to predict the returns volatility of Cocoa. In term of MAPE, GARCH-M (3,2) is the best GARCH model to
predict the Cocoa’s returns volatility.
From the evaluation results, it can be concluded
that Indonesian Cocoa’s spot price returns volatility
has asymmetric effect. It is described by the EGARCH model. The positive and significant asymmetric value in EGARCH model explains that the market players in Cocoa should pay attention on
Cocoa’s high price news, because it can generate
more price volatility. Mean while, the GARCH-M model means that Indonesian Cocoa’s returns volatility also influenced by its risk premium.
The predictabilities of GARCH-M and EGARCH in predicting the volatility of returns of agricultural commodities are supported by the studies of Beck (2001), Yang et al. (2001), Swaray (2002), Zheng et al. (2008), Sumaryanto (2009), Pinisakikool
(β009), O’Connor et al. (2009), and Mahesa (2011). The results of this study can give benefit to investor and prospective investors to manage their portfolios and asses their investment risks in cocoa market. In order to deal with the relatively high
volatility level of cocoa’s spot price returns, financial
instruments such as forwards and futures markets will be desirable. The results in this study give insight to the market players about timing of hedging. The information from this study can also be a useful reference for economist, financial analysts and researchers, who are interested in Indonesian agricultural export commodities and also interested in the application of GARCH-type models. The application of GARCH-type models in agricultural fields could be a significant contribution to quantitative analysis of financial fields.
For the future researches, the prediction of risk by GARCH-type models used in this study could also be applied in other research objects, such as fixed income financial asset markets, currency markets, stock markets, other commodities markets, tourism, etc. The future researches also can use advanced type of GARCH models in order to get more specific results.
REFERENCES
Agriculture Data Center. 2010. Outlook Komoditas Pertanian Perkebunan Indonesia. Jakarta: Data Center and Information System of Indonesian Agriculture Ministry.
Alom, M.D.F., Ward, B. D. & Hu, B. 2010. Cross Country Mean and Volatility Spillover Effects of Food Prices: Evidence for Asia and Pacific. International Review of Business Research Papers, 6(2):334-355.
Beck, Stacie. 2001. Autoregressive Conditional Hete-rocedasticity in Commodity Spot Prices. Journal of Applied Econometrics, 16(2): 115-132.
Bollerslev, T. 1986. Generalized Autoregressive Con-ditional Heteroscedasticity. Journal of Econo-metrics, 31(3): 307-327.
Brooks, C. 2008. Introductory Econometrics for Finance. Second Edition. New York: Cam-bridge University Press.
Caturini, Rizki. 2011, July 12th. Harga Kontrak Kakao di AS Tertinggi Sejak 1978. Retrieved from www.industri.kontan.ac.id.
Commodity Futures Trading Regulatory Agency (CoFTRA). 2011. Forward-Futures-Spot Commodities Values Data. Retrieved from http://www.bappebti.go.id/?pg= harga_bursa. Day, T. & Lewis, C. 1992. Stock Market Volatility
and the Information Content of Stock Index Options. Journal of Econometrics, 52(1-2): 267-287.
Deaton, A. 1999. Commodity Prices and Growth in Africa. Journal of Economic Perspectives, 13(3):23-40.
Engle, R.F. 1982. Autoregressive Conditional Heteroscedasticity with Estimates of the Variance of United Kingdom Inflation. Econometrica, 50(4):987-1007.
Engle, R. F., Lilien, L. D. and Robins, R. 1987. Esti-mation of Time Variying Risk Premiums in the Term Structure. Econometrica, 55(2): 391-408.
Table 5. The GARCH-M Models
GARCH-type Models RMSE MAPE MAE
GARCH (3,2) 0.02349 715.06363 0.00201
GARCH-M (3,2) 0.02364 623.96758 0.00196
EGARCH (3,2) 0.02275 682.66119 0.00183
Hadi, S. & Hari, L. 2011, July 28th. Indonesia Ber-peluang Kuasai Pasar Kakao. Kompas News-letter.
Hanafie, R. 2010. Pengantar Ekonomi. Yogyakarta: CV.Andi Offset.
Kroner, K. F., Kneafsey, K.P. & Claessens, S. 1995. Forecasting Volatility in Commodity Markets. Journal of Forecasting, 14(2): 77-95.
Mahesa, M. 2011. International Price Volatility of Indian Spices Exports–An Empirical Analysis Asia and Pacific. Journal of Research in Business Management, 2(1):110-116.
Maruli, A. 2011. Indonesia to Become World’s Largest Cocoa Producer. Jakarta: Antara News.
Nelson, D. B. 1991. Conditional Heteroskedasticity in Asset Returns: A New Approach. Econome-trica, 59(2):347-370.
Newbery, D. M. 1989. The Theory of Food Price Stabilization. The Economic Journal, 9(398): 1065-1082.
O’Connor, D., Keane, M. & Barner, E. 2009. Measuring Volatility in Dairy Commodity Prices. Paper was presented at 113th European Association of Agricultural Economist, Greece. Pinjisakikool, T. 2009. Do Futures Stabilize the
Volatility of the Agricultural Spot Prices? Evidence from Thailand. Euro Economica, 22(1): 47-56.
Sekhar, C.S.C. 2003. Volatility of Agricultural Prices: An Analysis of Major International and Domestic Markets. Working Paper, No. 103, Indian Council forResearch on International Economic Relations.
Sekhar, C.S.C. 2004. Agricultural Price Volatility in International and Indian Markets. Economic and Political Weekly, 39(43): 4729-4736.
Sumaryanto. 2009. Retail Price Volatility Analysis of Some Food Commodities Using ARCH/ GARCH Model. Journal of Agro Economic Indonesia, 27(2):125-163.
Swaray, R.B. 2002. Volatility of Primary Commodity Prices: Some Evidence from Agricultural Exports in Sub-Saharan Africa. Discussion Papers in Economics No. 06, The University of York.
Tabor, S.R., Dillon, H.S. & Sawit, M. 1999. Under-standing the 1988 Food Crisis: Supply, Demand or Policy Failure? Paper presented at the International Seminar on Agricultural Sector during the Turbulence of Economic Crisis: Lessons and Future Directions, Center for Agro-Socioeconomic Research, Bogor, 17-18 February.
Tambunan, M. 1999. Economic Crisis Induced Un-employment: Can Agriculture and Rural Eco-nomy Play as the Safe Haven? Paper presented at the International Seminar on Agricultural Sector during the Turbulence of Economic Crisis: Lessons and Future Directions, Center for Agro-Socioeconomic Research, Bogor, 17-18 February.
Taylor, S. J. 1986. Modelling Financial Time Series. Chichester: John Wiley.
The Agriculture and Natural Resources Team of the UK Department for International Development (DFID). 2004. Rethinking Tropical Agricul-tural Commodities. The United Kingdom: The Report of DFID.
Yang, J., Haigh, M. S. & Leatham, D. J. 2001. Agricultural Liberalization Policy and Commo-dity Price Volatility. Applied Economic Letters, 8(9):593-598.
Zakoian, J. M. 1994. Threshold Heteroscedastic Models. Journal of Economic Dynamic and Control, 12(3):193-202.